| Param | Original file | Final file |
|---|---|---|
| Filename | modeM0/AS1A12_056T02_9000005538_40346cztM0_level2.fits | modeM0/AS1A12_056T02_9000005538_40346cztM0_level2_quad_clean.evt |
| Size (bytes) | 400,271,040 | 85,282,560 |
| Size | 381.7 MB | 81.3 MB |
| Events in quadrant A | 3,324,521 | 619,353 |
| Events in quadrant B | 2,338,459 | 636,327 |
| Events in quadrant C | 2,902,326 | 587,609 |
| Events in quadrant D | 5,869,604 | 395,428 |
| Mode M0 | |||
|---|---|---|---|
| Quadrant | BADHDUFLAG | Total packets | Discarded packets |
| A | 0 | 13220 | 3 |
| B | 0 | 10072 | 2 |
| C | 0 | 11541 | 2 |
| D | 0 | 20757 | 2 |
| Mode M9 | |||
|---|---|---|---|
| Quadrant | BADHDUFLAG | Total packets | Discarded packets |
| A | 0 | 36 | 0 |
| B | 0 | 36 | 0 |
| C | 0 | 36 | 0 |
| D | 0 | 37 | 0 |
| Mode SS | |||
|---|---|---|---|
| Quadrant | BADHDUFLAG | Total packets | Discarded packets |
| A | 0 | 100 | 0 |
| B | 0 | 100 | 0 |
| C | 0 | 100 | 0 |
| D | 0 | 100 | 0 |
| Quadrant | Total seconds | Saturated seconds | Saturation percentage |
|---|---|---|---|
| A | 4901 | 65 | 1.326260% |
| B | 4901 | 10 | 0.204040% |
| C | 4901 | 103 | 2.101612% |
| D | 4901 | 1477 | 30.136707% |
Noise dominated data is calculated using 1-second bins in cleaned event files. If a bin has >2000 counts, and if more than 50% of those come from <1% of pixels, then it is considered to be noise-dominated and hence unusable.
| Quadrant | # 1 sec bins | Bins with >0 counts | Bins with >2000 counts | High rate bins dominated by noise | Noise dominated (total time) | Noise dominated (detector-on time) | Marked lightcurve |
|---|---|---|---|---|---|---|---|
| A | 7025 | 4902 | 47 | 47 | 0.67% | 0.96% | 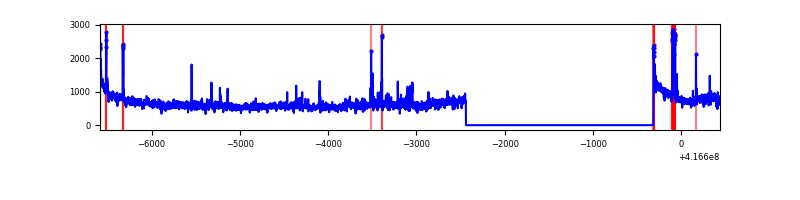 |
| B | 7025 | 4902 | 5 | 5 | 0.07% | 0.10% | 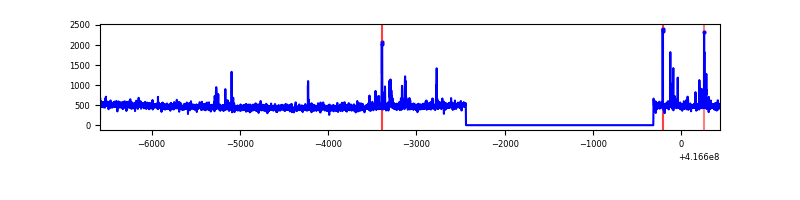 |
| C | 7025 | 4902 | 108 | 108 | 1.54% | 2.20% | 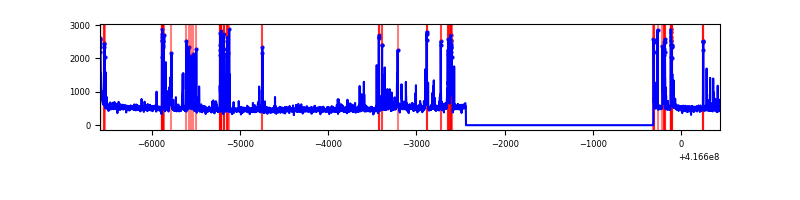 |
| D | 7024 | 4901 | 1301 | 1301 | 18.52% | 26.55% | 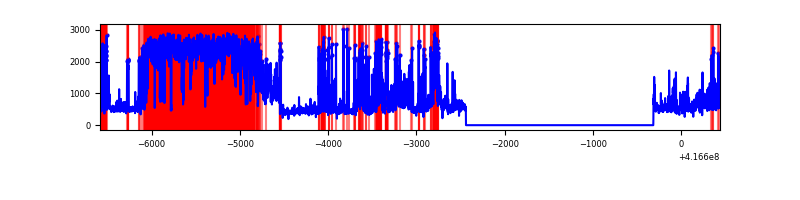 |
Top three noisy pixels from each quadrant. If the there are fewer than three noisy pixels in the level2.evt file, extra rows are filled as -1
| Pixel properties | Quadrant properties | ||||||
|---|---|---|---|---|---|---|---|
| Quadrant | DetID | PixID | Counts | Sigma | Mean | Median | Sigma |
| A | 6 | 10 | 506231 | 4396.65 | 564 | 557 | 115.0 |
| A | 10 | 83 | 456498 | 3964.24 | 564 | 557 | 115.0 |
| A | 13 | 248 | 74252 | 640.75 | 564 | 557 | 115.0 |
| B | 5 | 255 | 49701 | 454.92 | 566 | 553 | 108.0 |
| B | 4 | 170 | 32809 | 298.57 | 566 | 553 | 108.0 |
| B | 0 | 245 | 20216 | 182.0 | 566 | 553 | 108.0 |
| C | 14 | 254 | 500325 | 3980.47 | 543 | 548 | 125.6 |
| C | 15 | 214 | 226790 | 1801.9 | 543 | 548 | 125.6 |
| C | 0 | 10 | 42669 | 335.47 | 543 | 548 | 125.6 |
| D | 12 | 227 | 3427748 | 28578.97 | 482 | 469 | 119.9 |
| D | 2 | 250 | 224689 | 1869.7 | 482 | 469 | 119.9 |
| D | 12 | 128 | 131488 | 1092.52 | 482 | 469 | 119.9 |
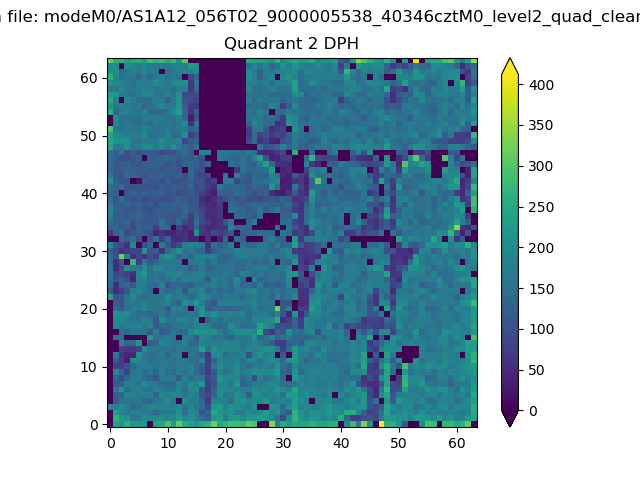
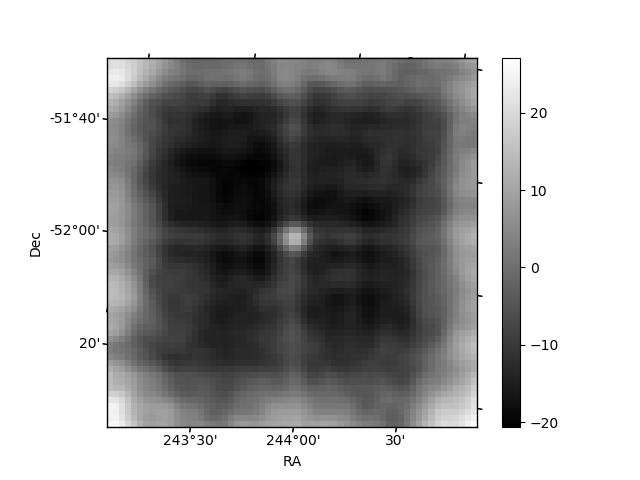
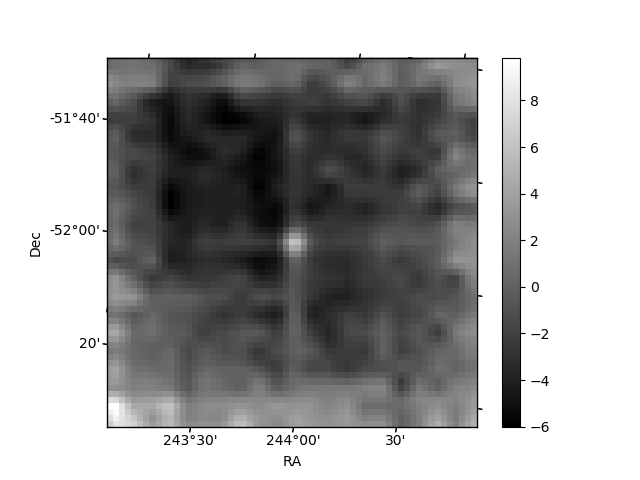
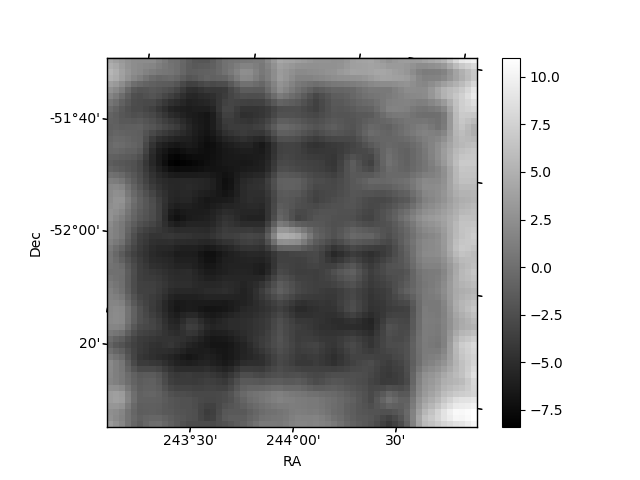
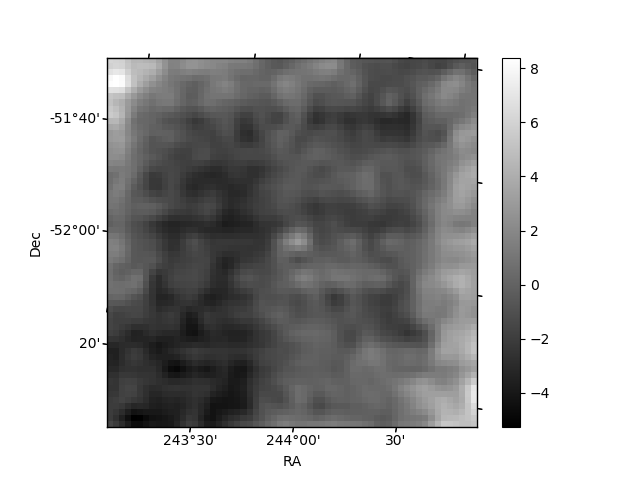
Histogram calculated using DETX and DETY for each event in the final _common_clean file
| Quadrant A | 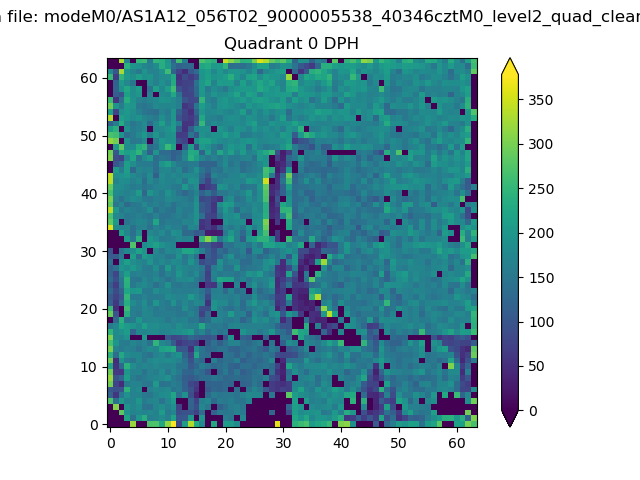 |
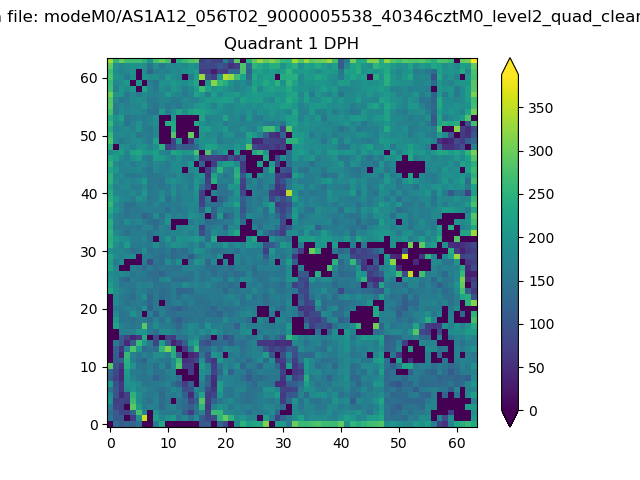 |
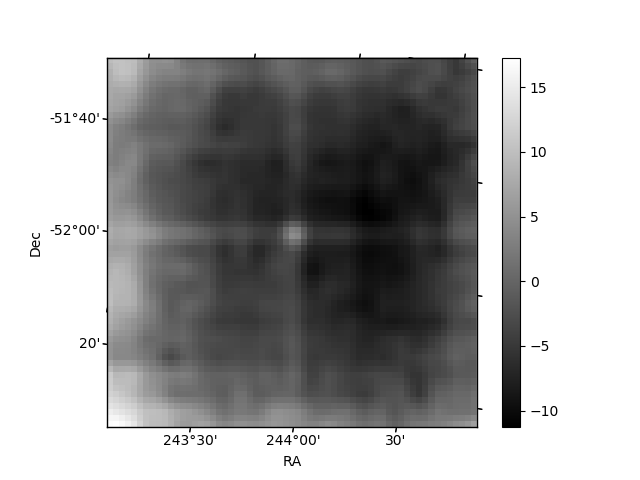
Quadrant B |
|---|---|---|---|
| Quadrant D | 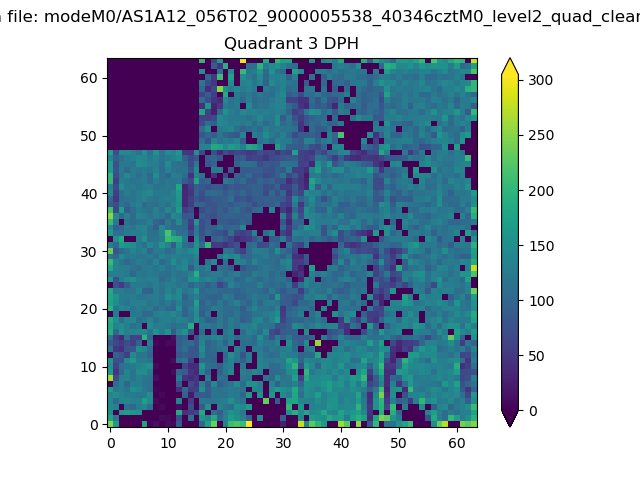 |
 |
Quadrant C |
| Plot type | Count rate plots | Images |
|---|---|---|
| Comparison with Poisson distribution Blue bars denote a histogram of data divided into 1 sec bins. Red curve is a Poisson curve with rate = median count rate of data. |
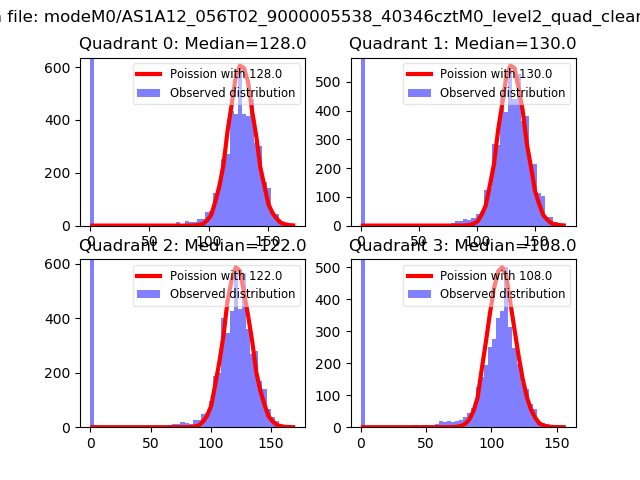 |
 |
| Quadrant-wise count rates Data is divided into 100 sec bins |
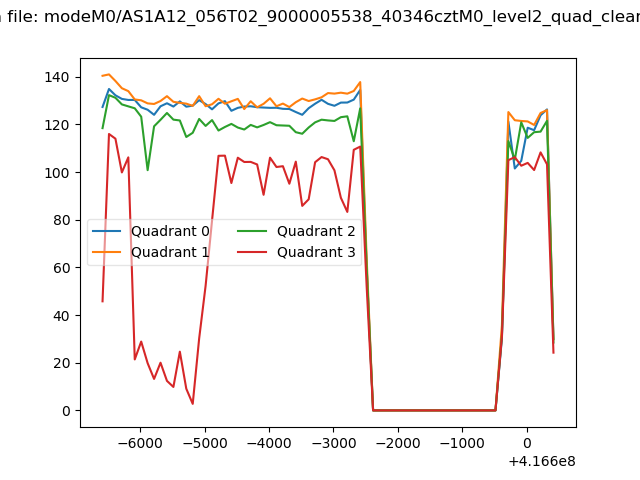 |
|
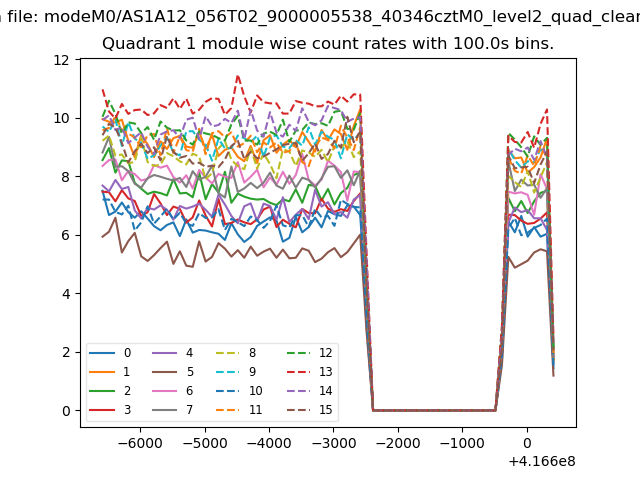
| Module-wise count rates for Quadrant A Data is divided into 100 sec bins |
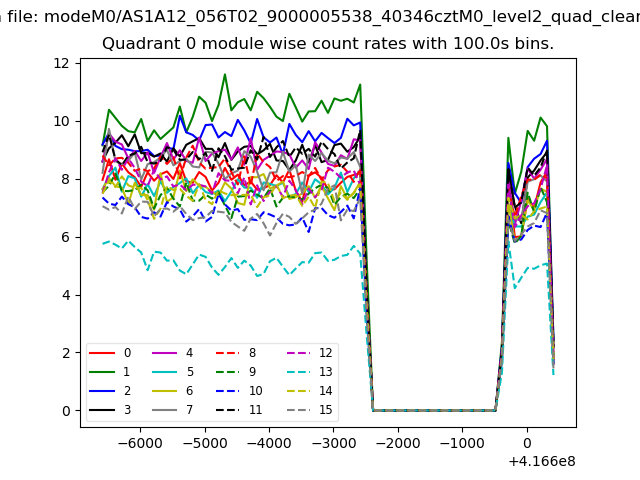 |
 |
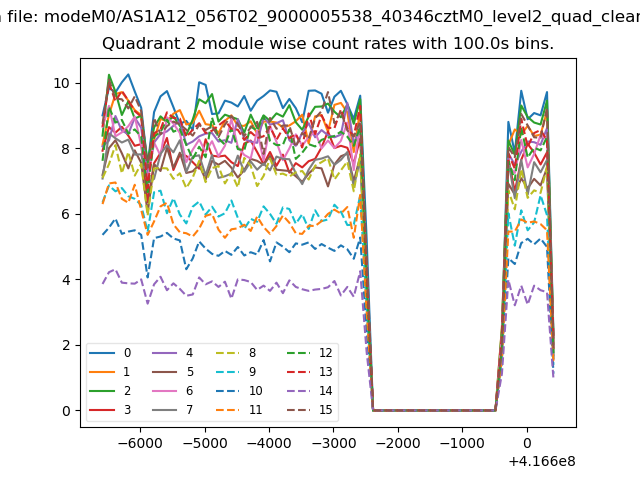
| Module-wise count rates for Quadrant B Data is divided into 100 sec bins |
 |
 |
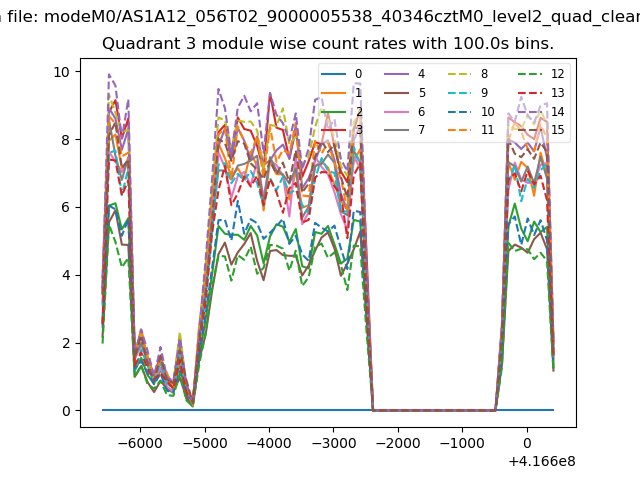
| Module-wise count rates for Quadrant C Data is divided into 100 sec bins |
 |
 |
| Module-wise count rates for Quadrant D Data is divided into 100 sec bins |
 |
 |
| Parameter | Plot |
|---|---|
| CZT HV Monitor | 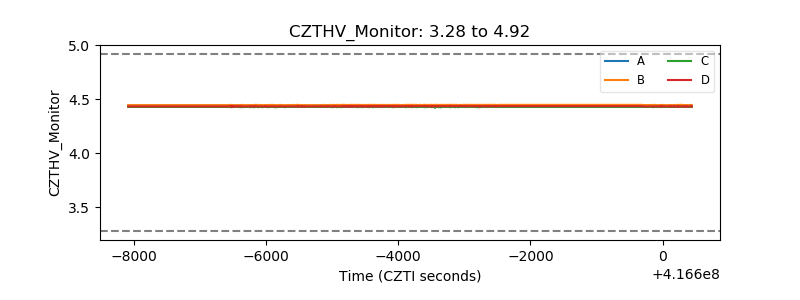 |
| D_VDD | 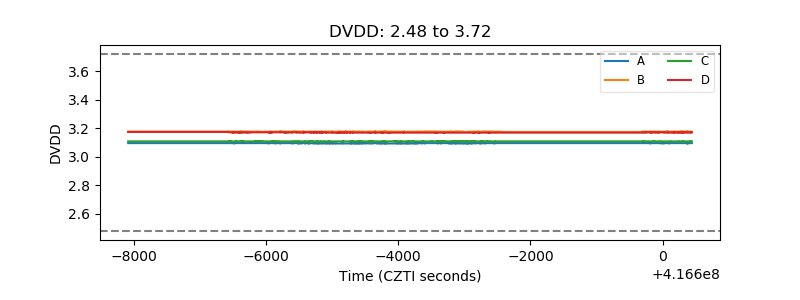 |
| Temperature 1 | 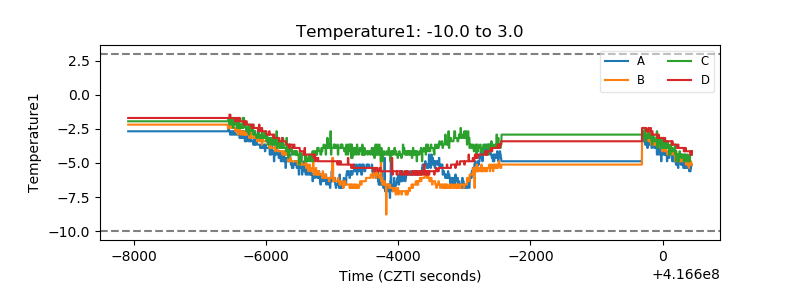 |
| Veto HV Monitor | 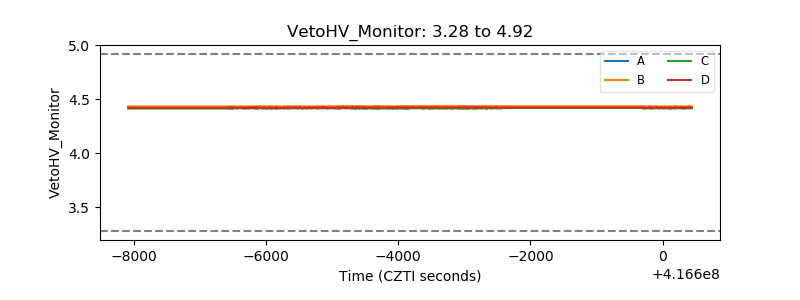 |
| Veto LLD | 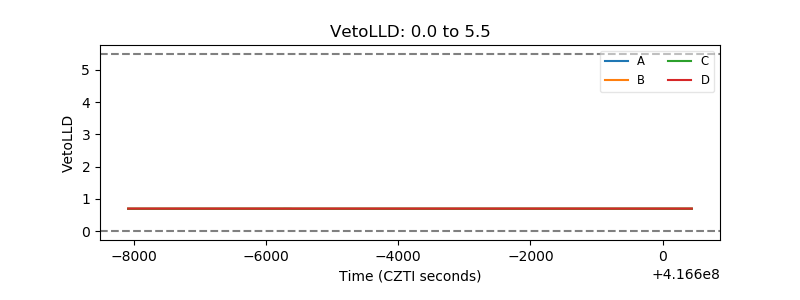 |
| Alpha Counter | 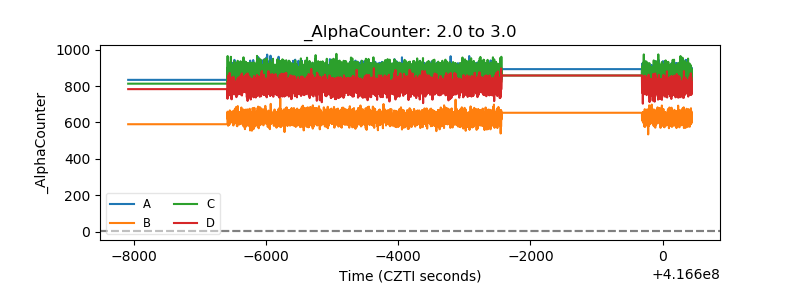 |
| _CPM_Rate | 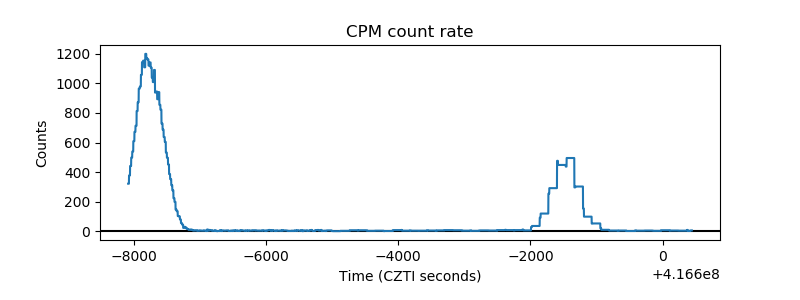 |
| CZT Counter | 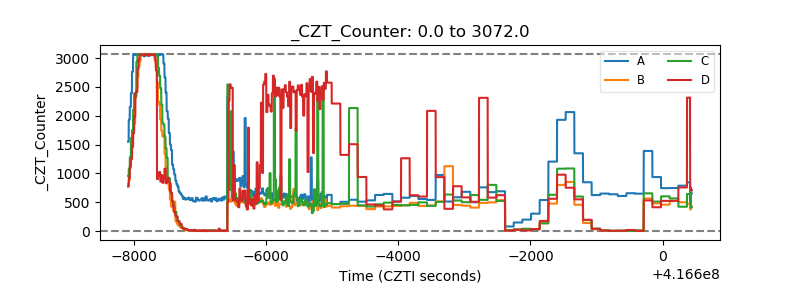 |
| +2.5 Volts monitor | 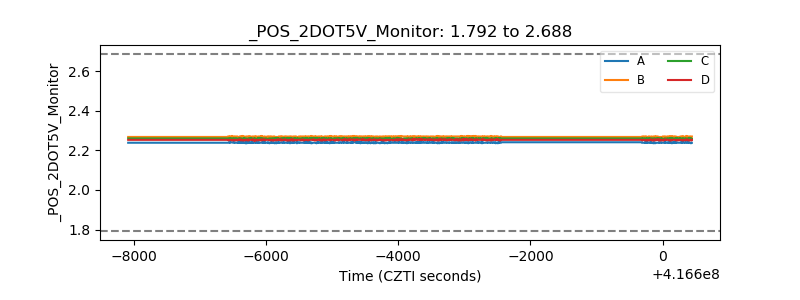 |
| +5 Volts monitor | 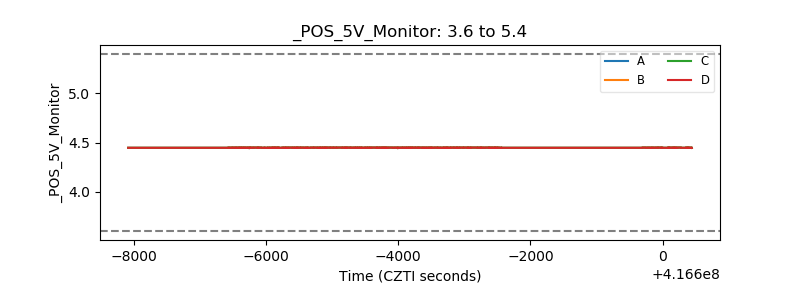 |
| _ROLL_ROT | 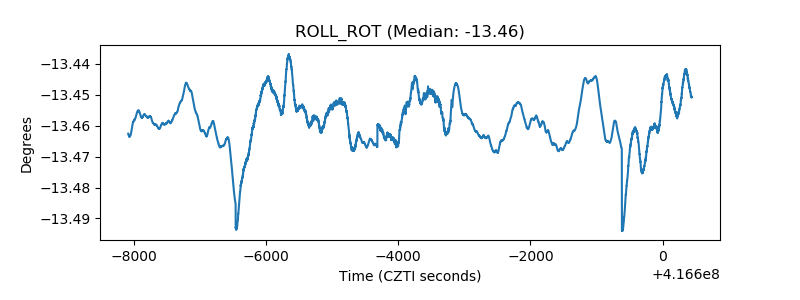 |
| _Roll_DEC | 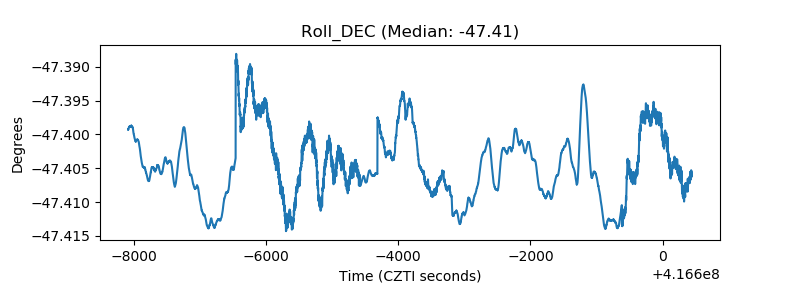 |
| _Roll_RA | 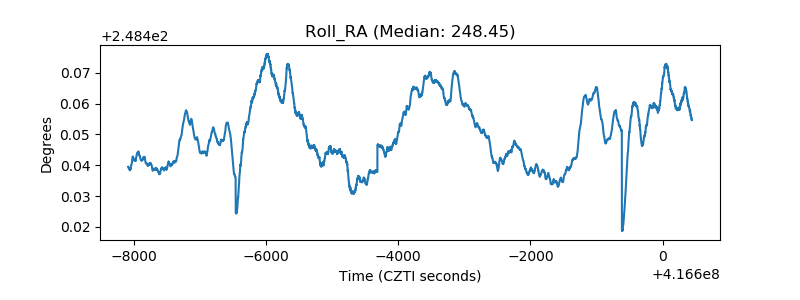 |
| Veto Counter | 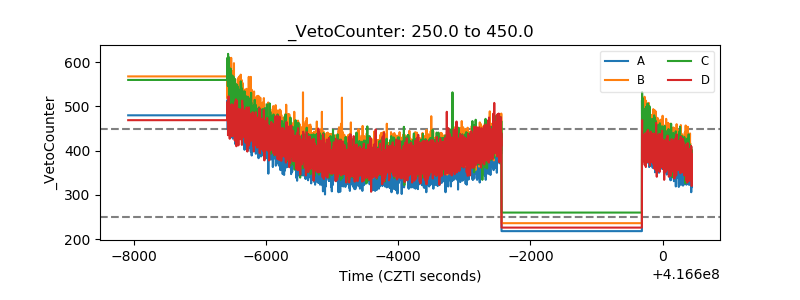 |