| Param | Original file | Final file |
|---|---|---|
| Filename | modeM0/AS1A12_056T02_9000005538_40347cztM0_level2.fits | modeM0/AS1A12_056T02_9000005538_40347cztM0_level2_quad_clean.evt |
| Size (bytes) | 334,748,160 | 87,595,200 |
| Size | 319.2 MB | 83.5 MB |
| Events in quadrant A | 3,548,690 | 598,418 |
| Events in quadrant B | 2,489,205 | 620,651 |
| Events in quadrant C | 2,752,468 | 584,213 |
| Events in quadrant D | 3,211,451 | 498,722 |
| Mode M0 | |||
|---|---|---|---|
| Quadrant | BADHDUFLAG | Total packets | Discarded packets |
| A | 0 | 13895 | 3 |
| B | 0 | 10644 | 2 |
| C | 0 | 11169 | 2 |
| D | 0 | 12922 | 2 |
| Mode M9 | |||
|---|---|---|---|
| Quadrant | BADHDUFLAG | Total packets | Discarded packets |
| A | 0 | 32 | 0 |
| B | 0 | 32 | 0 |
| C | 0 | 32 | 0 |
| D | 0 | 33 | 0 |
| Mode SS | |||
|---|---|---|---|
| Quadrant | BADHDUFLAG | Total packets | Discarded packets |
| A | 0 | 102 | 0 |
| B | 0 | 102 | 0 |
| C | 0 | 102 | 0 |
| D | 0 | 102 | 0 |
| Quadrant | Total seconds | Saturated seconds | Saturation percentage |
|---|---|---|---|
| A | 4997 | 143 | 2.861717% |
| B | 4997 | 40 | 0.800480% |
| C | 4997 | 56 | 1.120672% |
| D | 4997 | 451 | 9.025415% |
Noise dominated data is calculated using 1-second bins in cleaned event files. If a bin has >2000 counts, and if more than 50% of those come from <1% of pixels, then it is considered to be noise-dominated and hence unusable.
| Quadrant | # 1 sec bins | Bins with >0 counts | Bins with >2000 counts | High rate bins dominated by noise | Noise dominated (total time) | Noise dominated (detector-on time) | Marked lightcurve |
|---|---|---|---|---|---|---|---|
| A | 7001 | 4998 | 129 | 129 | 1.84% | 2.58% | 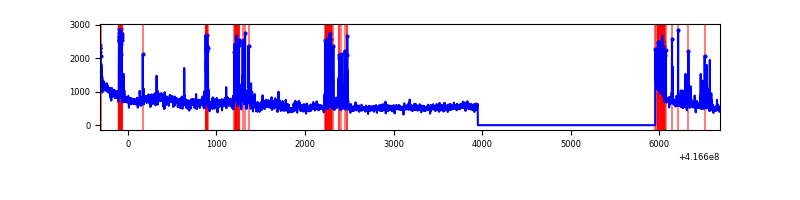 |
| B | 7001 | 4998 | 21 | 21 | 0.30% | 0.42% | 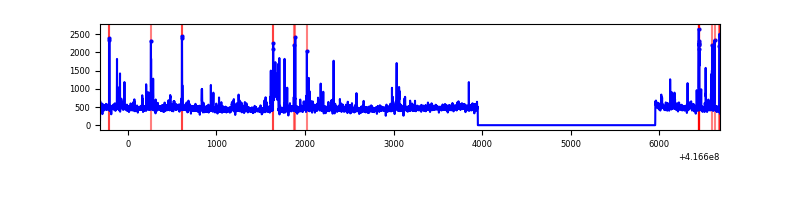 |
| C | 7001 | 4998 | 56 | 56 | 0.80% | 1.12% | 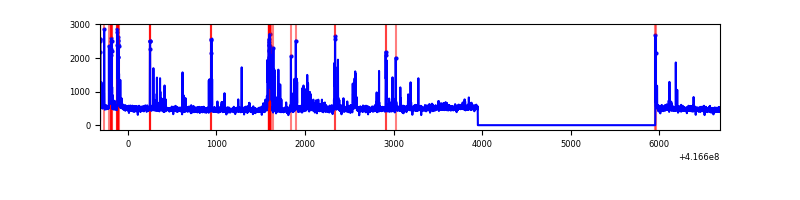 |
| D | 7001 | 4998 | 128 | 128 | 1.83% | 2.56% | 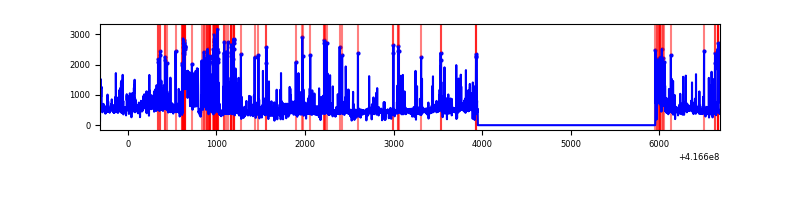 |
Top three noisy pixels from each quadrant. If the there are fewer than three noisy pixels in the level2.evt file, extra rows are filled as -1
| Pixel properties | Quadrant properties | ||||||
|---|---|---|---|---|---|---|---|
| Quadrant | DetID | PixID | Counts | Sigma | Mean | Median | Sigma |
| A | 6 | 10 | 464911 | 4166.9 | 550 | 541 | 111.4 |
| A | 10 | 83 | 445792 | 3995.34 | 550 | 541 | 111.4 |
| A | 13 | 248 | 382283 | 3425.46 | 550 | 541 | 111.4 |
| B | 4 | 170 | 188791 | 1766.58 | 555 | 542 | 106.6 |
| B | 0 | 230 | 39703 | 367.5 | 555 | 542 | 106.6 |
| B | 5 | 255 | 29216 | 269.08 | 555 | 542 | 106.6 |
| C | 14 | 254 | 355220 | 2823.46 | 541 | 547 | 125.6 |
| C | 15 | 214 | 231823 | 1841.13 | 541 | 547 | 125.6 |
| C | 0 | 10 | 25956 | 202.27 | 541 | 547 | 125.6 |
| D | 12 | 227 | 506455 | 3940.37 | 513 | 498 | 128.4 |
| D | 13 | 249 | 208028 | 1616.23 | 513 | 498 | 128.4 |
| D | 12 | 128 | 157866 | 1225.57 | 513 | 498 | 128.4 |
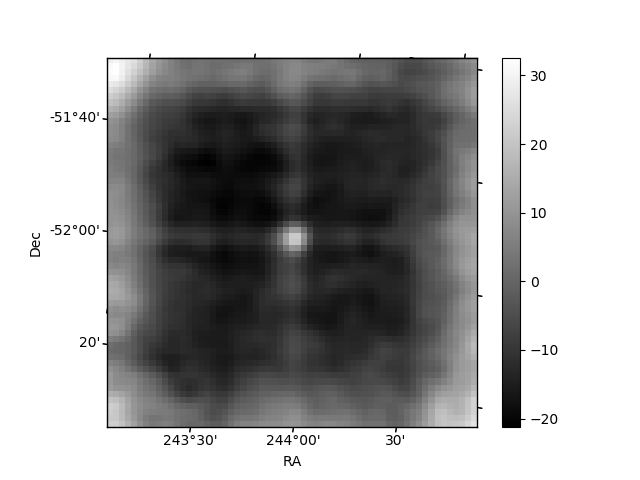
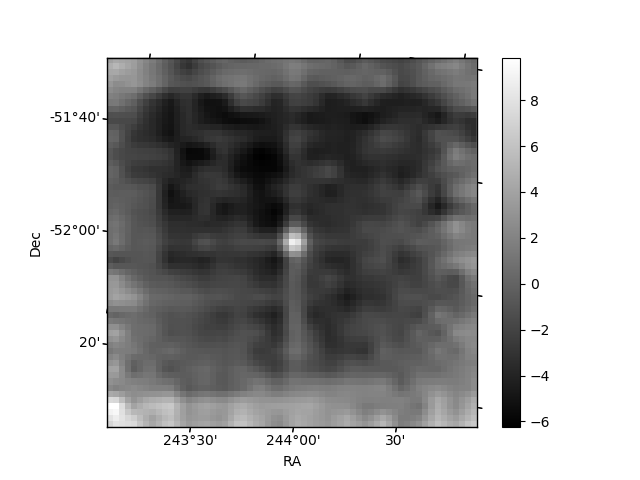
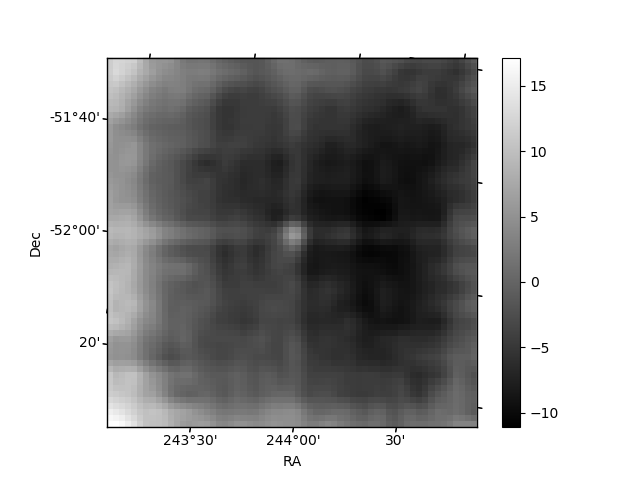
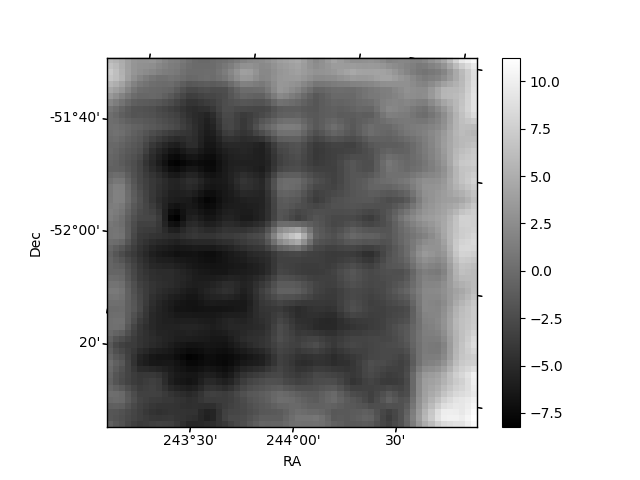
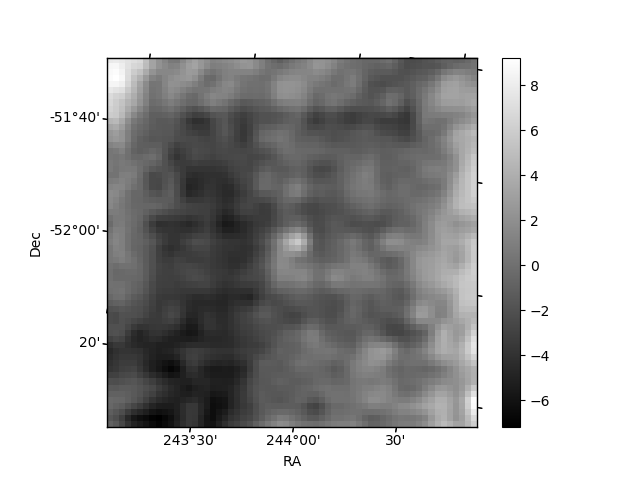
Histogram calculated using DETX and DETY for each event in the final _common_clean file
| Quadrant A | 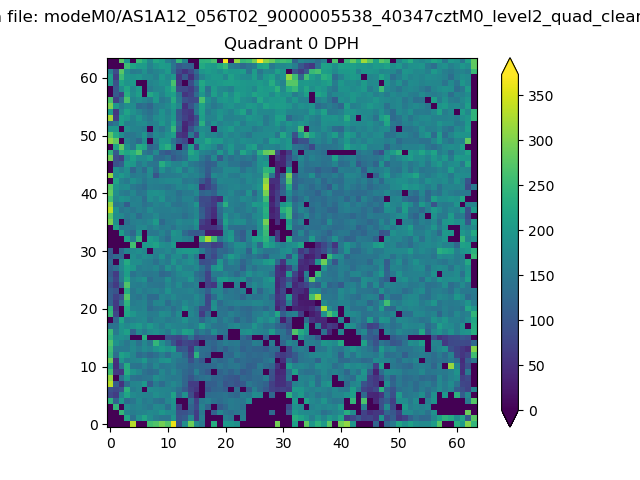 |
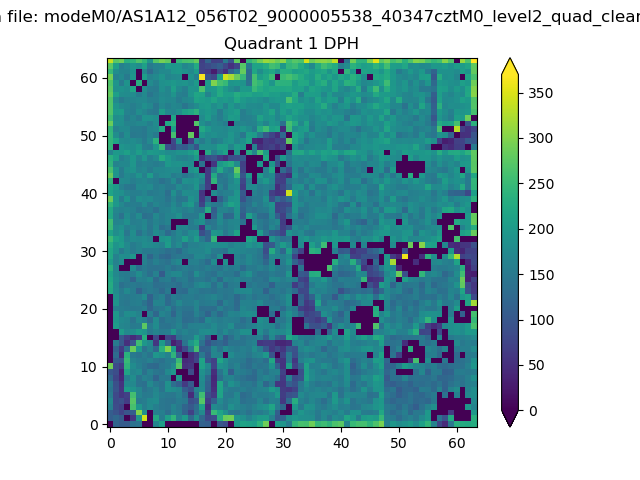 |
Quadrant B |
|---|---|---|---|
| Quadrant D | 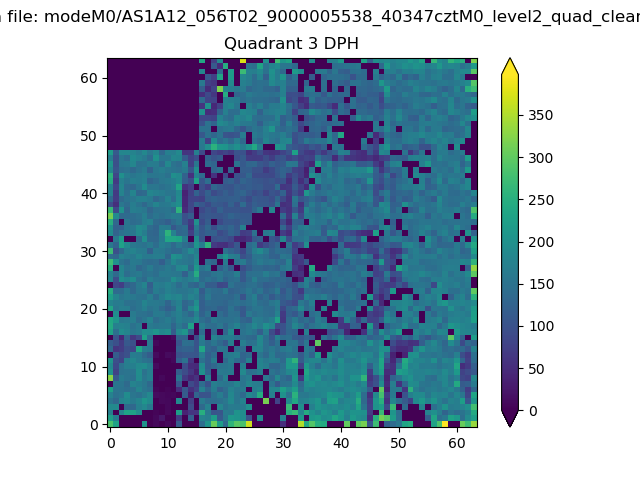 |
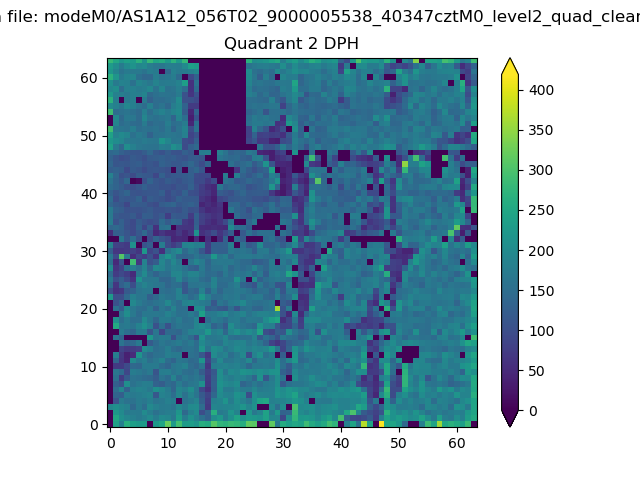 |
Quadrant C |
| Plot type | Count rate plots | Images |
|---|---|---|
| Comparison with Poisson distribution Blue bars denote a histogram of data divided into 1 sec bins. Red curve is a Poisson curve with rate = median count rate of data. |
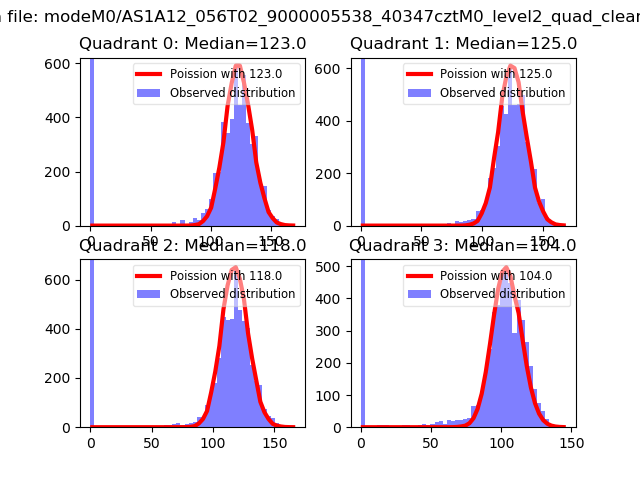 |
 |
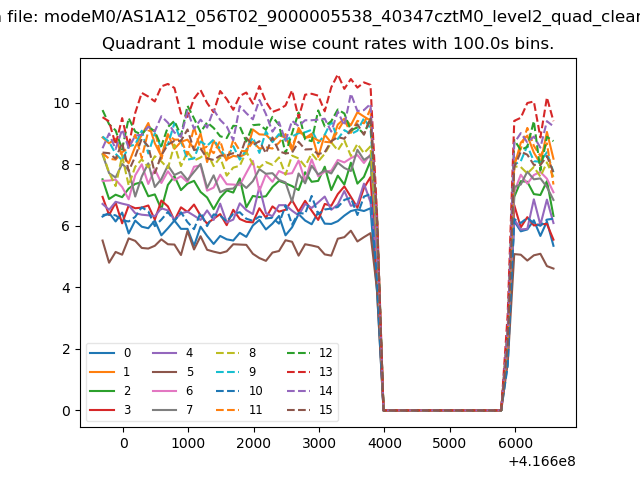
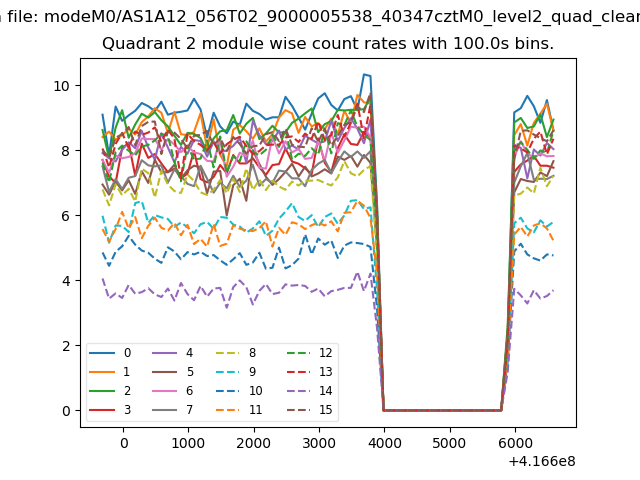
| Quadrant-wise count rates Data is divided into 100 sec bins |
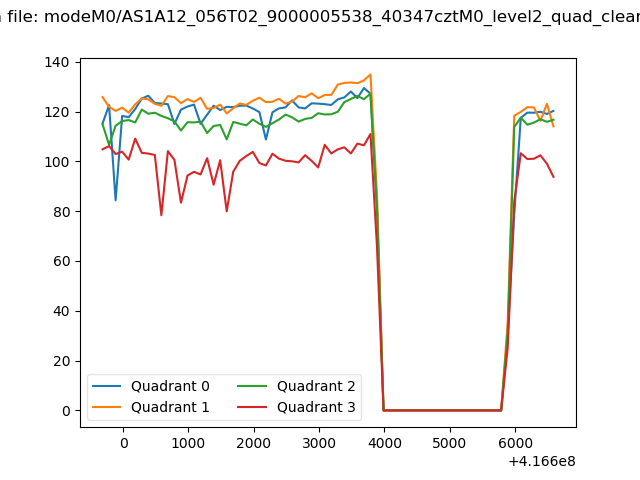 |
|
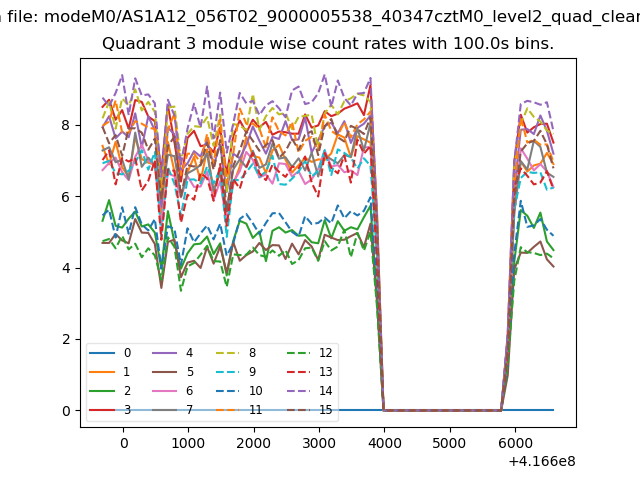
| Module-wise count rates for Quadrant A Data is divided into 100 sec bins |
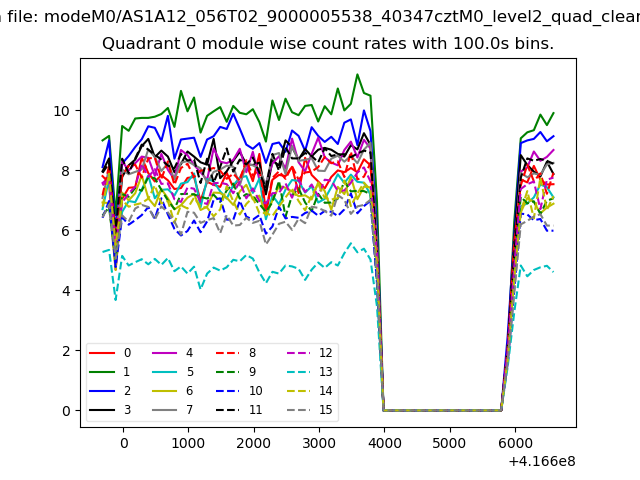 |
 |
| Module-wise count rates for Quadrant B Data is divided into 100 sec bins |
 |
 |
| Module-wise count rates for Quadrant C Data is divided into 100 sec bins |
 |
 |
| Module-wise count rates for Quadrant D Data is divided into 100 sec bins |
 |
 |
| Parameter | Plot |
|---|---|
| CZT HV Monitor |  |
| D_VDD | 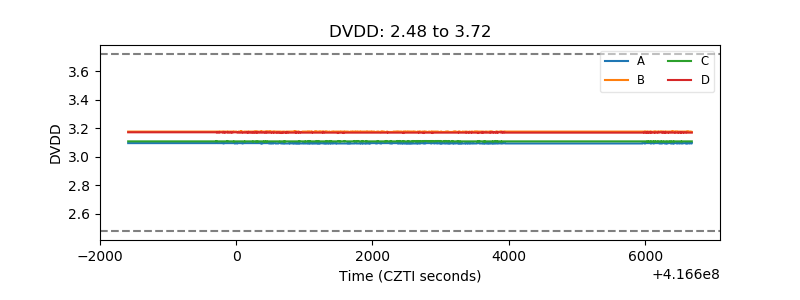 |
| Temperature 1 | 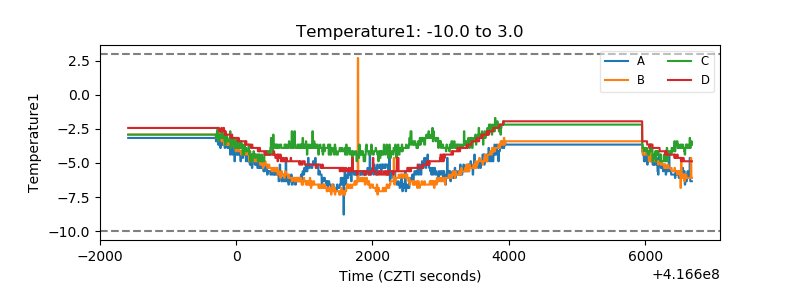 |
| Veto HV Monitor | 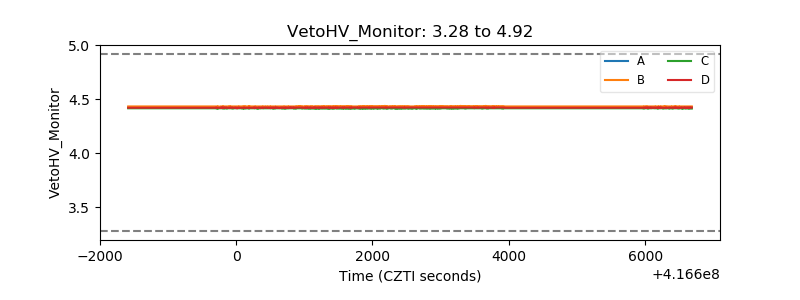 |
| Veto LLD | 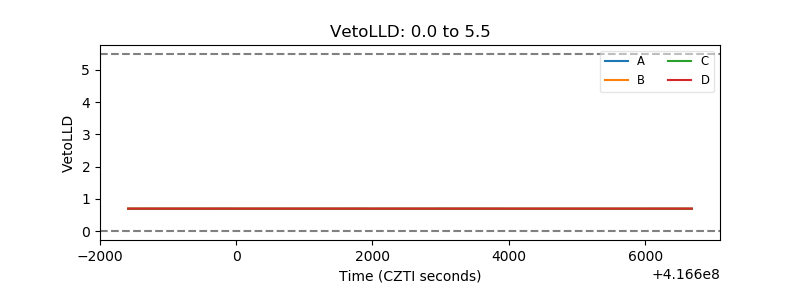 |
| Alpha Counter | 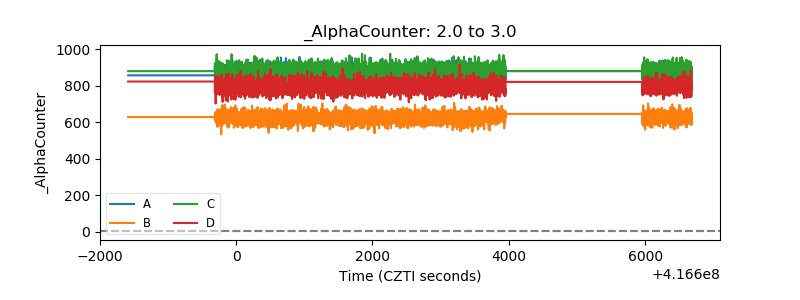 |
| _CPM_Rate | 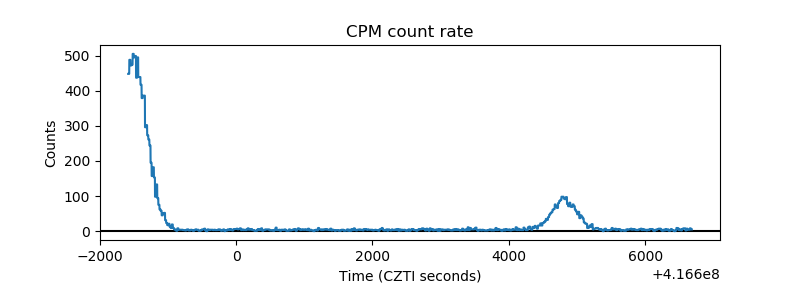 |
| CZT Counter | 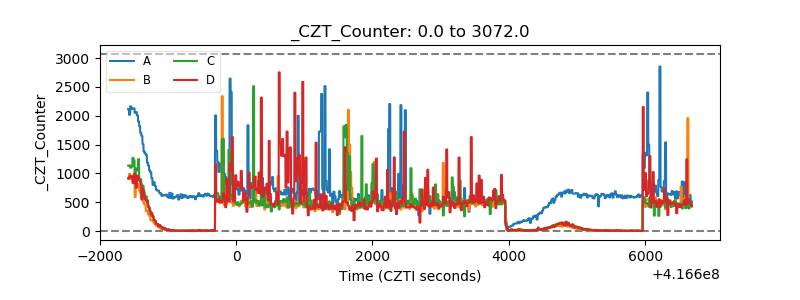 |
| +2.5 Volts monitor | 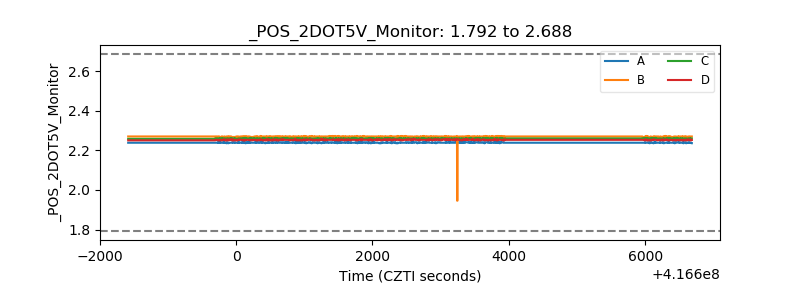 |
| +5 Volts monitor | 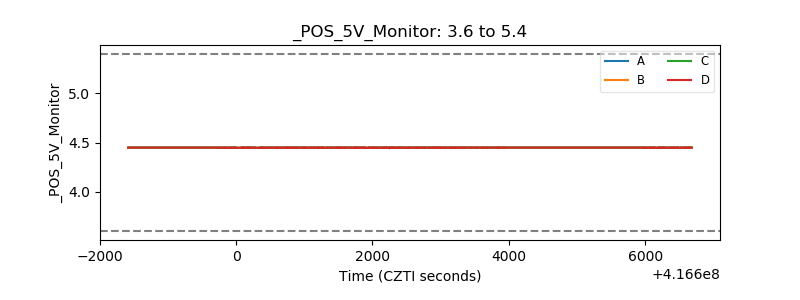 |
| _ROLL_ROT | 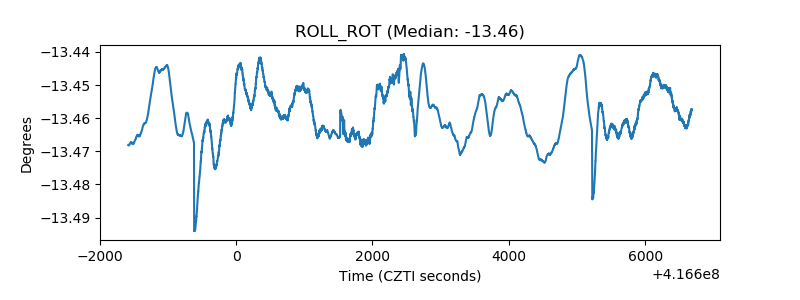 |
| _Roll_DEC | 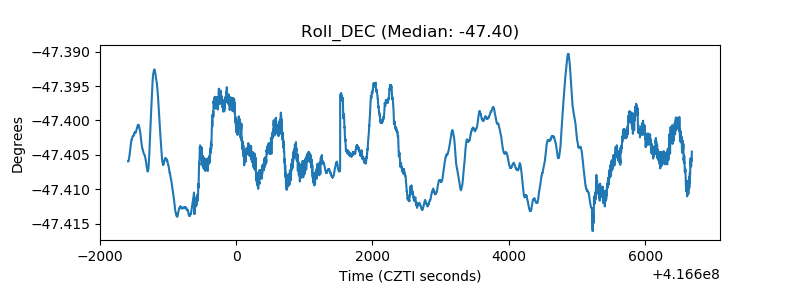 |
| _Roll_RA | 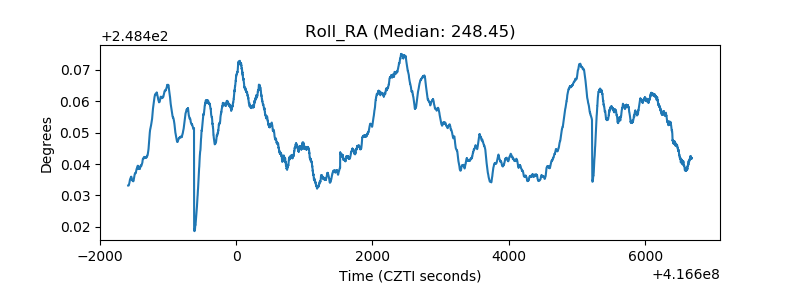 |
| Veto Counter | 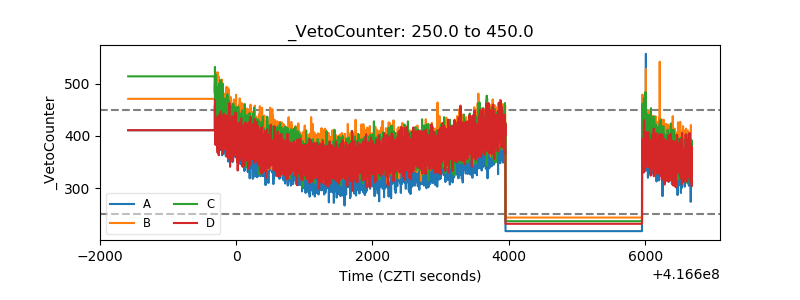 |