| Param | Original file | Final file |
|---|---|---|
| Filename | modeM0/AS1A12_056T02_9000005538_40348cztM0_level2.fits | modeM0/AS1A12_056T02_9000005538_40348cztM0_level2_quad_clean.evt |
| Size (bytes) | 347,725,440 | 95,137,920 |
| Size | 331.6 MB | 90.7 MB |
| Events in quadrant A | 3,357,611 | 649,769 |
| Events in quadrant B | 2,622,023 | 670,726 |
| Events in quadrant C | 2,837,645 | 633,835 |
| Events in quadrant D | 3,624,093 | 539,985 |
| Mode M0 | |||
|---|---|---|---|
| Quadrant | BADHDUFLAG | Total packets | Discarded packets |
| A | 0 | 13312 | 3 |
| B | 0 | 11495 | 2 |
| C | 0 | 11865 | 2 |
| D | 0 | 14567 | 2 |
| Mode M9 | |||
|---|---|---|---|
| Quadrant | BADHDUFLAG | Total packets | Discarded packets |
| A | 0 | 37 | 0 |
| B | 0 | 37 | 0 |
| C | 0 | 37 | 0 |
| D | 0 | 37 | 0 |
| Mode SS | |||
|---|---|---|---|
| Quadrant | BADHDUFLAG | Total packets | Discarded packets |
| A | 0 | 114 | 0 |
| B | 0 | 114 | 0 |
| C | 0 | 114 | 0 |
| D | 0 | 114 | 0 |
| Quadrant | Total seconds | Saturated seconds | Saturation percentage |
|---|---|---|---|
| A | 5522 | 133 | 2.408548% |
| B | 5522 | 32 | 0.579500% |
| C | 5522 | 54 | 0.977907% |
| D | 5522 | 464 | 8.402753% |
Noise dominated data is calculated using 1-second bins in cleaned event files. If a bin has >2000 counts, and if more than 50% of those come from <1% of pixels, then it is considered to be noise-dominated and hence unusable.
| Quadrant | # 1 sec bins | Bins with >0 counts | Bins with >2000 counts | High rate bins dominated by noise | Noise dominated (total time) | Noise dominated (detector-on time) | Marked lightcurve |
|---|---|---|---|---|---|---|---|
| A | 9229 | 5524 | 114 | 114 | 1.24% | 2.06% |  |
| B | 9228 | 5522 | 20 | 20 | 0.22% | 0.36% | 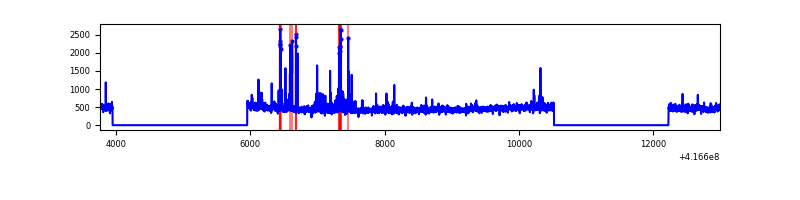 |
| C | 9229 | 5524 | 47 | 47 | 0.51% | 0.85% | 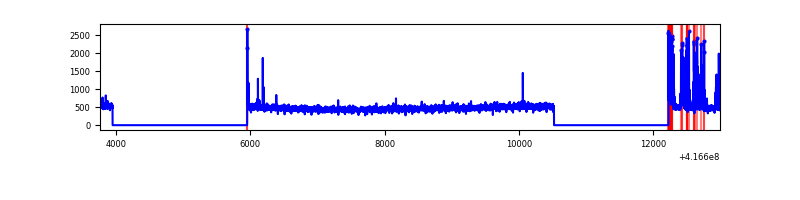 |
| D | 9229 | 5524 | 163 | 163 | 1.77% | 2.95% | 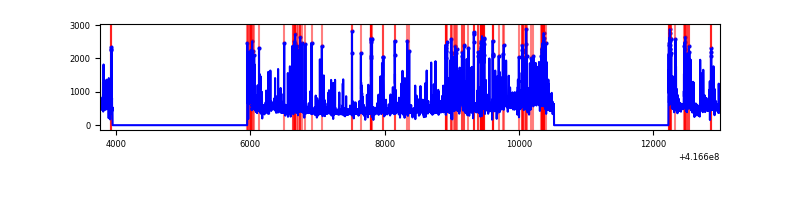 |
Top three noisy pixels from each quadrant. If the there are fewer than three noisy pixels in the level2.evt file, extra rows are filled as -1
| Pixel properties | Quadrant properties | ||||||
|---|---|---|---|---|---|---|---|
| Quadrant | DetID | PixID | Counts | Sigma | Mean | Median | Sigma |
| A | 10 | 83 | 451656 | 3646.69 | 605 | 595 | 123.7 |
| A | 13 | 248 | 349063 | 2817.26 | 605 | 595 | 123.7 |
| A | 6 | 10 | 163578 | 1317.67 | 605 | 595 | 123.7 |
| B | 4 | 170 | 118364 | 1002.38 | 607 | 591 | 117.5 |
| B | 5 | 255 | 59122 | 498.17 | 607 | 591 | 117.5 |
| B | 0 | 230 | 34928 | 292.25 | 607 | 591 | 117.5 |
| C | 15 | 214 | 252993 | 1796.53 | 596 | 602 | 140.5 |
| C | 14 | 254 | 237421 | 1685.68 | 596 | 602 | 140.5 |
| C | 0 | 10 | 13465 | 91.56 | 596 | 602 | 140.5 |
| D | 12 | 128 | 505462 | 3607.51 | 569 | 554 | 140.0 |
| D | 12 | 227 | 477788 | 3409.79 | 569 | 554 | 140.0 |
| D | 12 | 191 | 135005 | 960.64 | 569 | 554 | 140.0 |
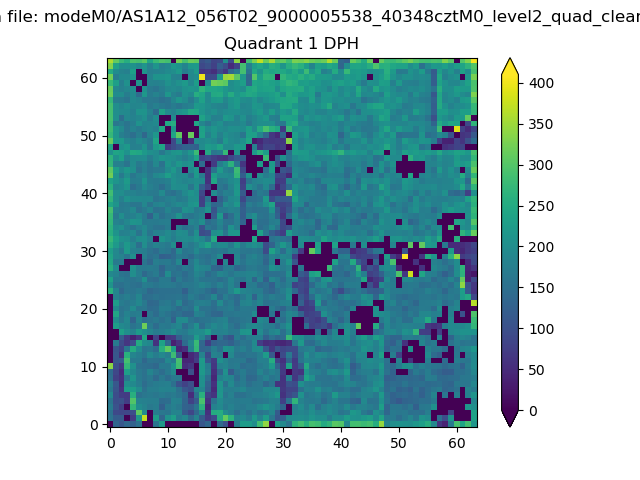
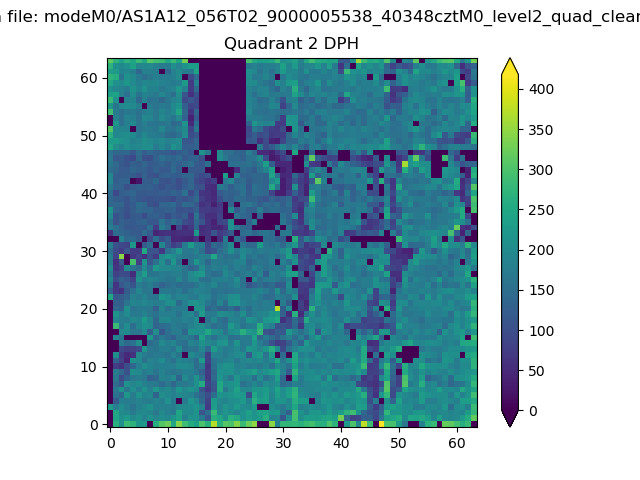
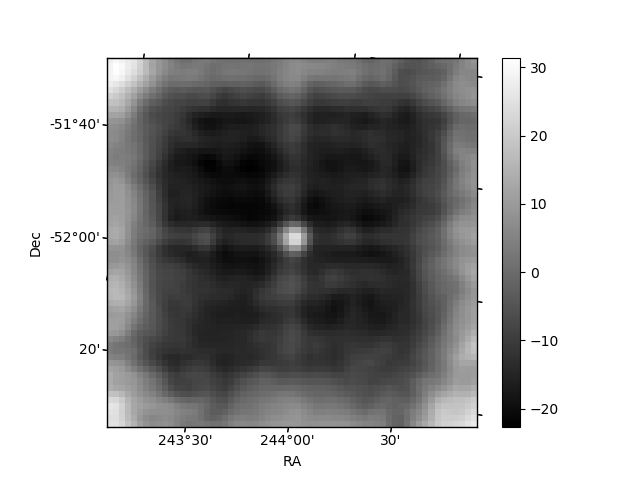
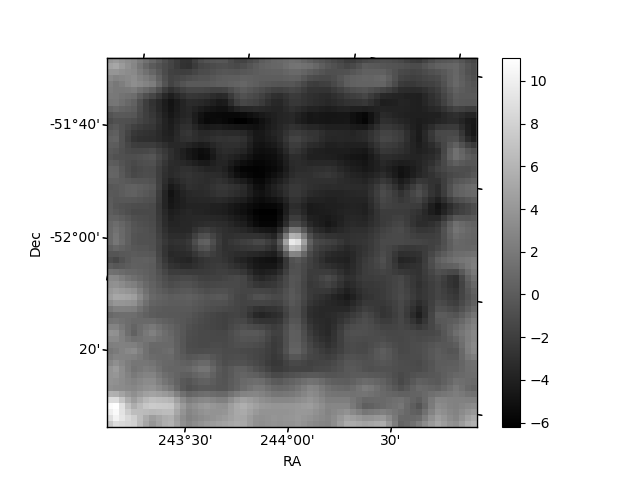
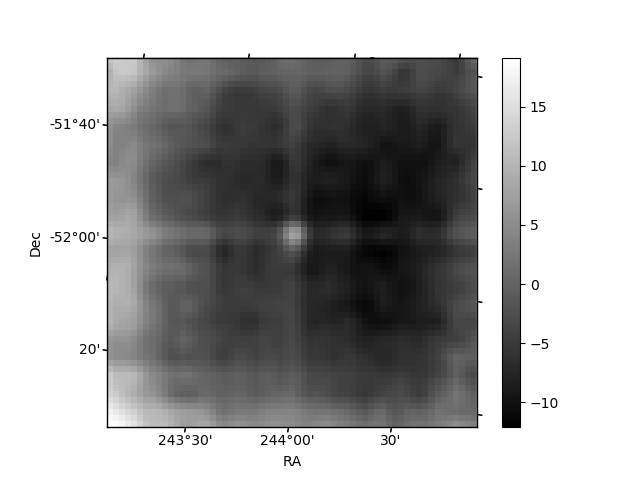
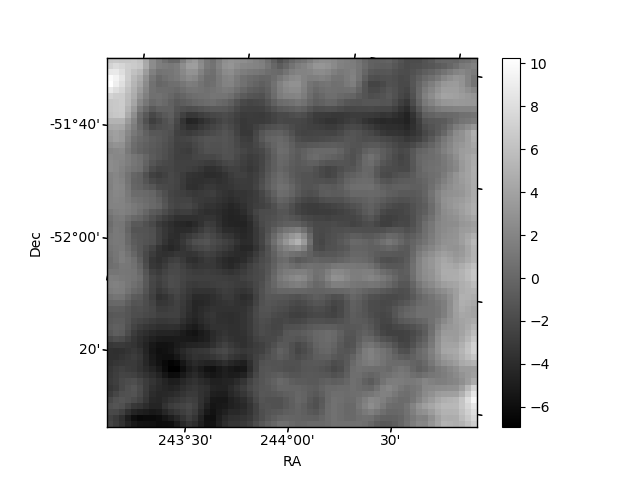
Histogram calculated using DETX and DETY for each event in the final _common_clean file
| Quadrant A | 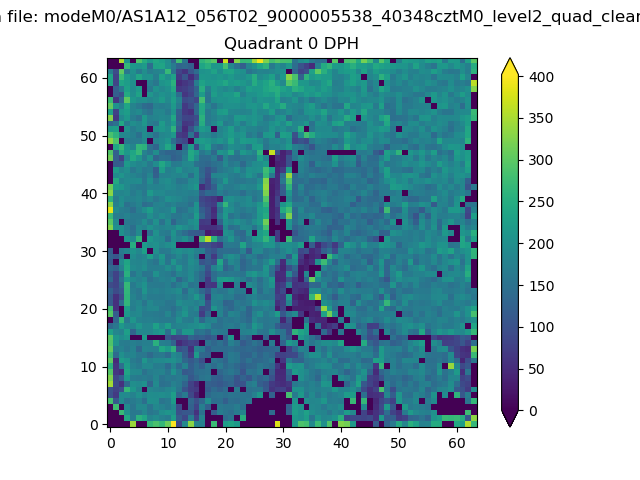 |
 |
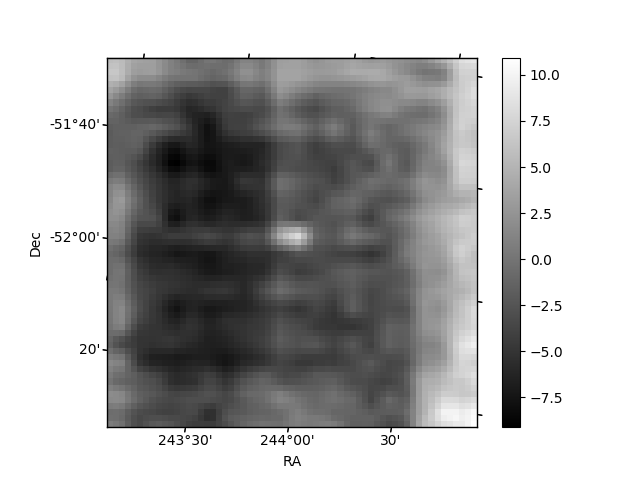
Quadrant B |
|---|---|---|---|
| Quadrant D | 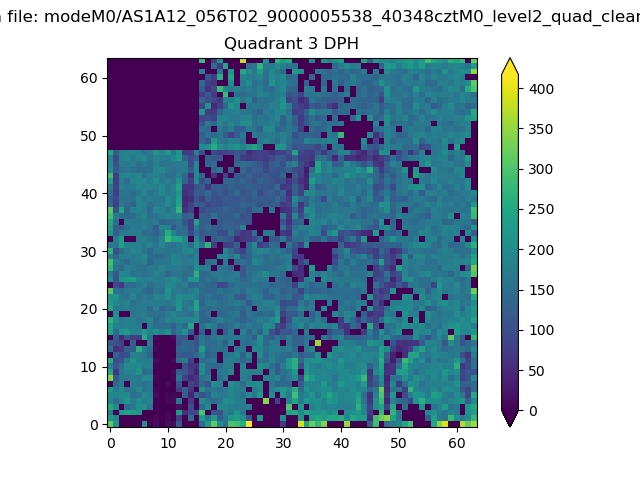 |
 |
Quadrant C |
| Plot type | Count rate plots | Images |
|---|---|---|
| Comparison with Poisson distribution Blue bars denote a histogram of data divided into 1 sec bins. Red curve is a Poisson curve with rate = median count rate of data. |
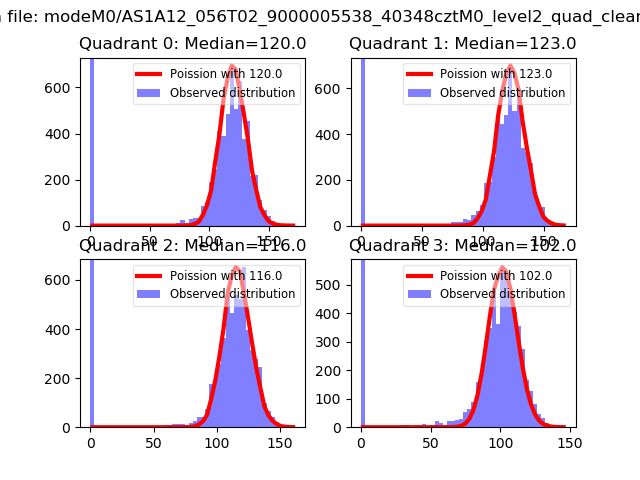 |
 |
| Quadrant-wise count rates Data is divided into 100 sec bins |
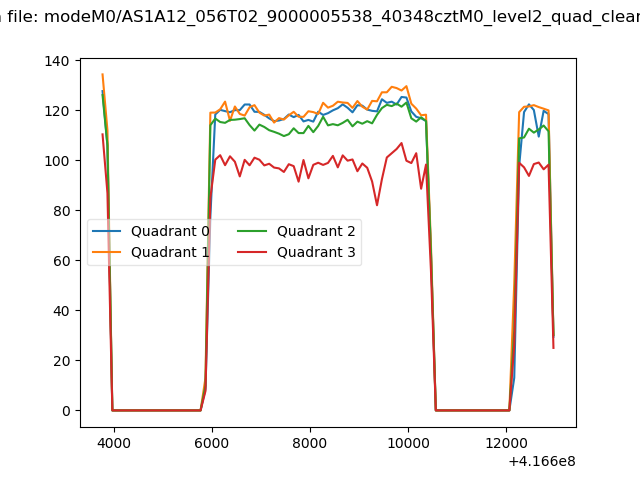 |
|
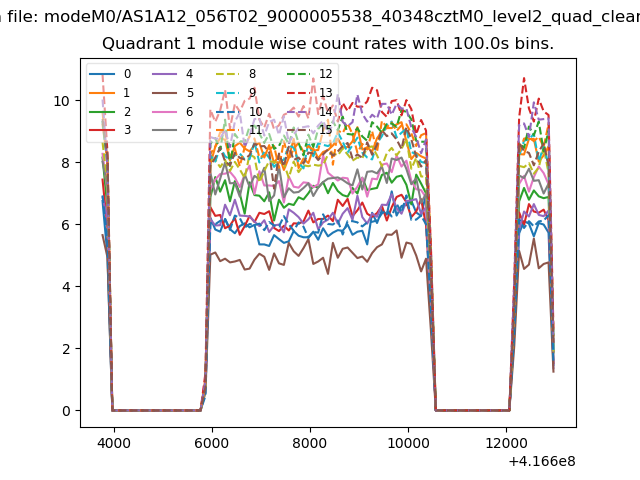
| Module-wise count rates for Quadrant A Data is divided into 100 sec bins |
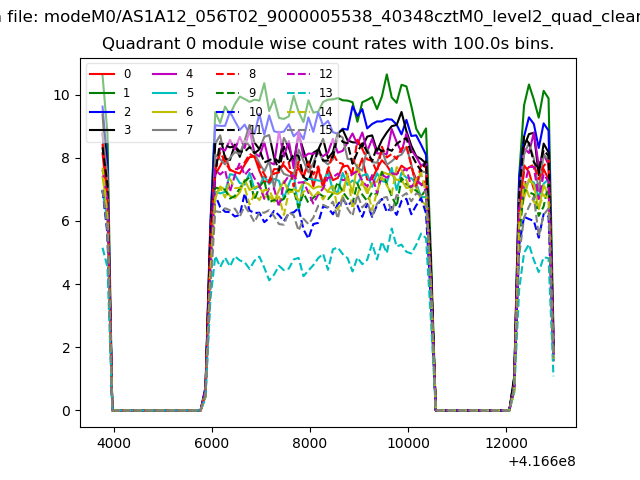 |
 |
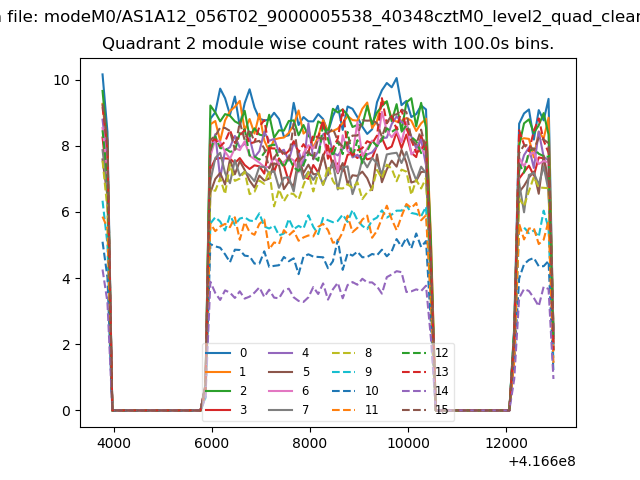
| Module-wise count rates for Quadrant B Data is divided into 100 sec bins |
 |
 |
| Module-wise count rates for Quadrant C Data is divided into 100 sec bins |
 |
 |
| Module-wise count rates for Quadrant D Data is divided into 100 sec bins |
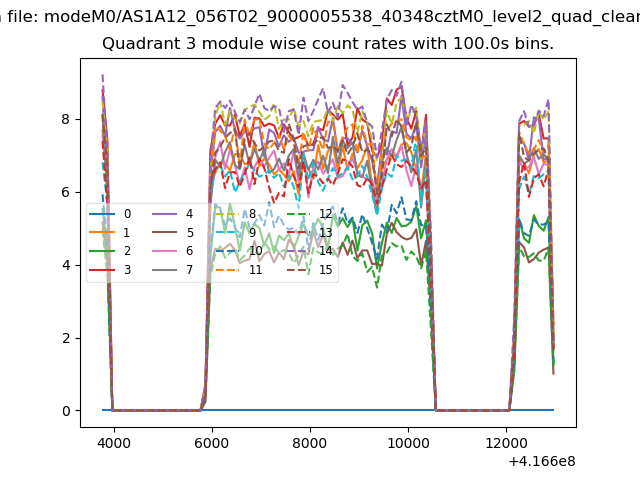 |
 |
| Parameter | Plot |
|---|---|
| CZT HV Monitor |  |
| D_VDD | 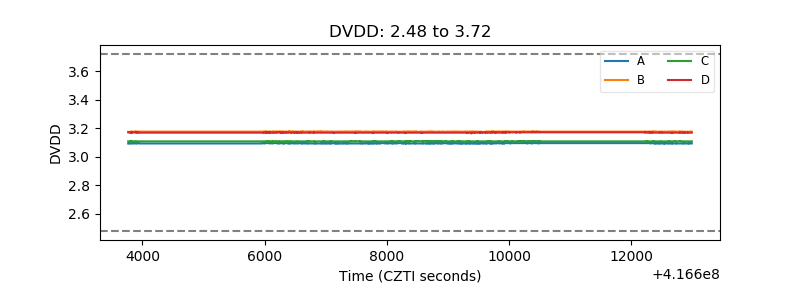 |
| Temperature 1 | 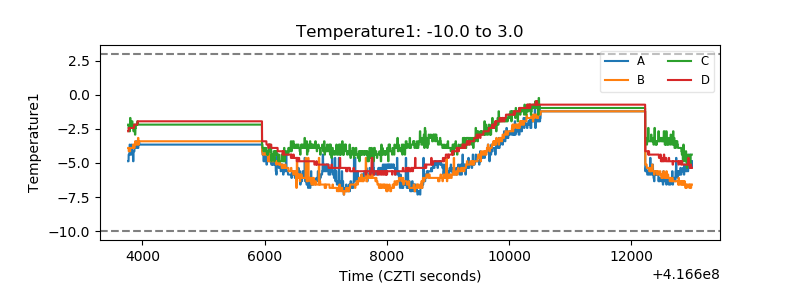 |
| Veto HV Monitor | 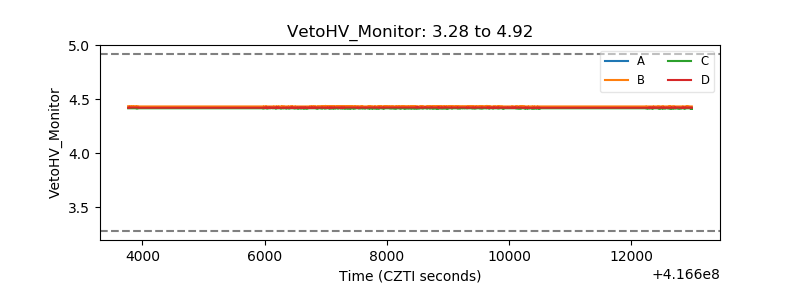 |
| Veto LLD | 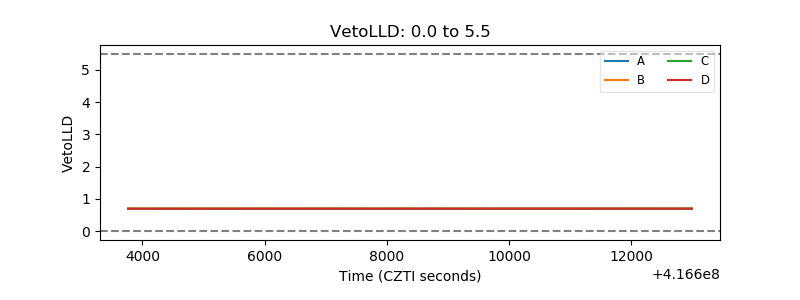 |
| Alpha Counter | 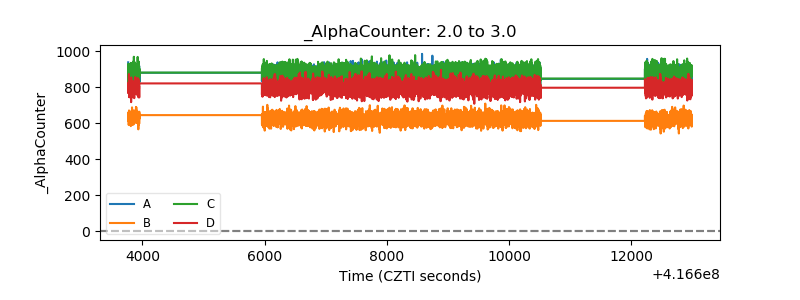 |
| _CPM_Rate | 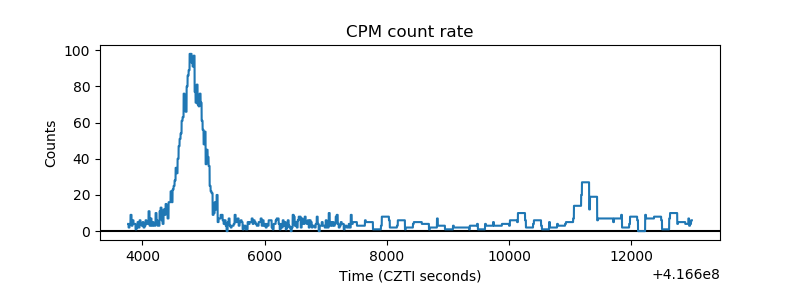 |
| CZT Counter | 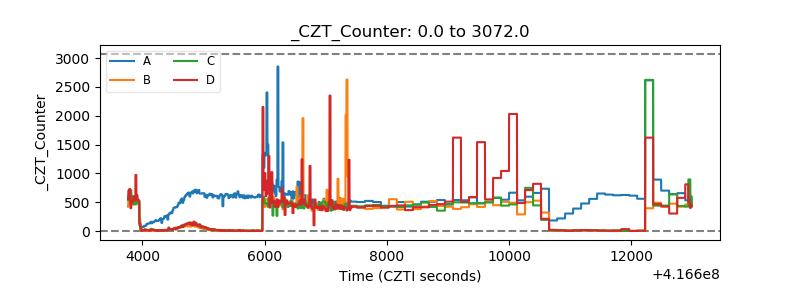 |
| +2.5 Volts monitor |  |
| +5 Volts monitor | 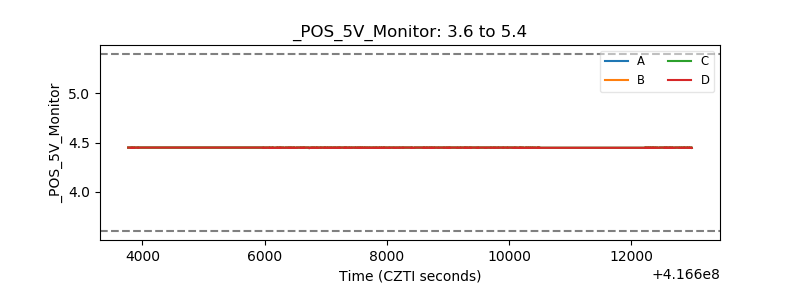 |
| _ROLL_ROT | 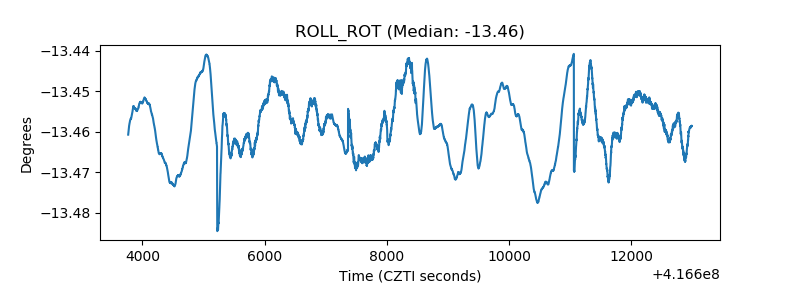 |
| _Roll_DEC | 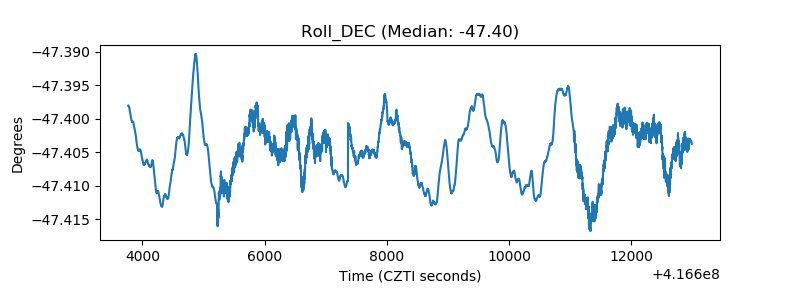 |
| _Roll_RA | 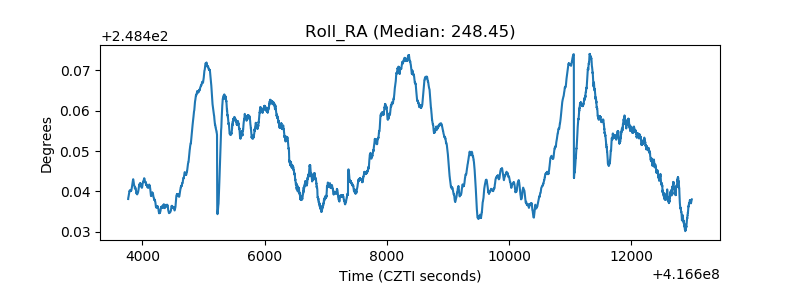 |
| Veto Counter | 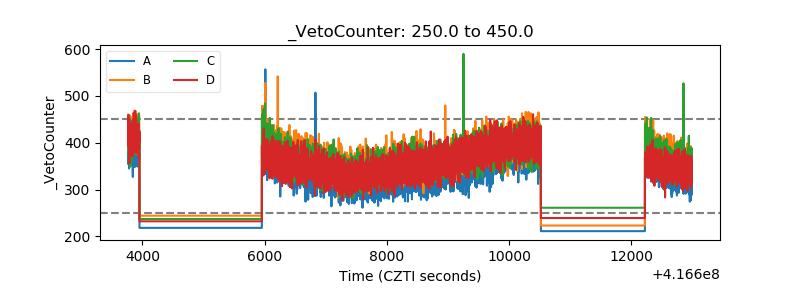 |