| Param | Original file | Final file |
|---|---|---|
| Filename | modeM0/AS1A12_056T02_9000005538_40356cztM0_level2.fits | modeM0/AS1A12_056T02_9000005538_40356cztM0_level2_quad_clean.evt |
| Size (bytes) | 1,548,184,320 | 381,297,600 |
| Size | 1.4 GB | 363.6 MB |
| Events in quadrant A | 14,348,733 | 2,597,695 |
| Events in quadrant B | 10,862,840 | 2,679,190 |
| Events in quadrant C | 12,152,294 | 2,574,726 |
| Events in quadrant D | 18,147,385 | 2,095,181 |
| Mode M0 | |||
|---|---|---|---|
| Quadrant | BADHDUFLAG | Total packets | Discarded packets |
| A | 0 | 57198 | 6 |
| B | 0 | 48222 | 5 |
| C | 0 | 50580 | 5 |
| D | 0 | 69703 | 5 |
| Mode M9 | |||
|---|---|---|---|
| Quadrant | BADHDUFLAG | Total packets | Discarded packets |
| A | 0 | 72 | 0 |
| B | 0 | 72 | 0 |
| C | 0 | 72 | 0 |
| D | 0 | 72 | 0 |
| Mode SS | |||
|---|---|---|---|
| Quadrant | BADHDUFLAG | Total packets | Discarded packets |
| A | 0 | 472 | 0 |
| B | 0 | 472 | 0 |
| C | 0 | 472 | 0 |
| D | 0 | 472 | 0 |
| Quadrant | Total seconds | Saturated seconds | Saturation percentage |
|---|---|---|---|
| A | 23224 | 314 | 1.352050% |
| B | 23224 | 107 | 0.460730% |
| C | 23224 | 164 | 0.706166% |
| D | 23224 | 3069 | 13.214778% |
Noise dominated data is calculated using 1-second bins in cleaned event files. If a bin has >2000 counts, and if more than 50% of those come from <1% of pixels, then it is considered to be noise-dominated and hence unusable.
| Quadrant | # 1 sec bins | Bins with >0 counts | Bins with >2000 counts | High rate bins dominated by noise | Noise dominated (total time) | Noise dominated (detector-on time) | Marked lightcurve |
|---|---|---|---|---|---|---|---|
| A | 30328 | 23228 | 257 | 257 | 0.85% | 1.11% | 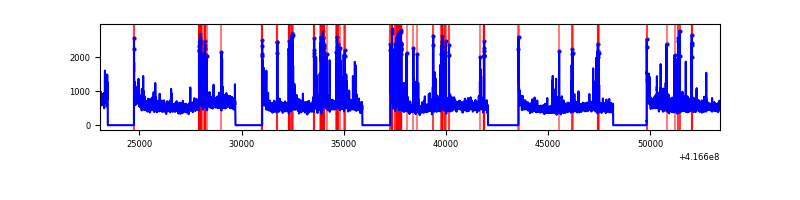 |
| B | 30327 | 23225 | 58 | 58 | 0.19% | 0.25% | 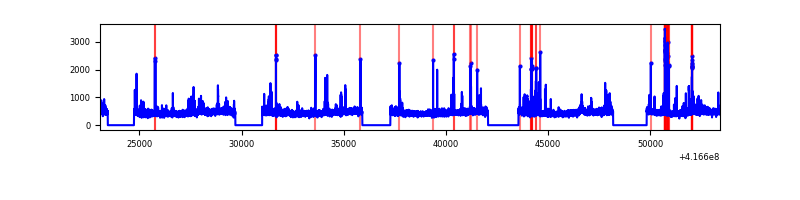 |
| C | 30327 | 23225 | 136 | 136 | 0.45% | 0.59% | 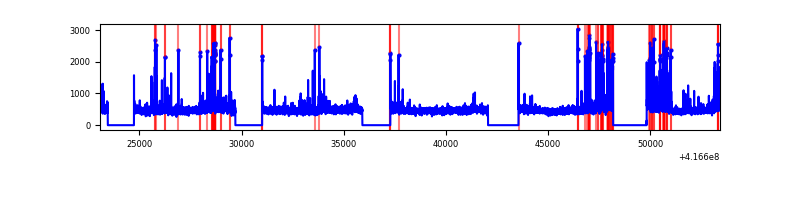 |
| D | 30327 | 23226 | 1587 | 1587 | 5.23% | 6.83% | 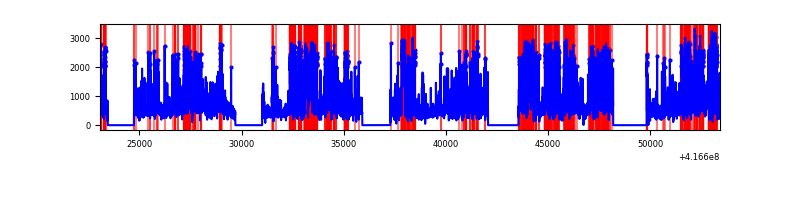 |
Top three noisy pixels from each quadrant. If the there are fewer than three noisy pixels in the level2.evt file, extra rows are filled as -1
| Pixel properties | Quadrant properties | ||||||
|---|---|---|---|---|---|---|---|
| Quadrant | DetID | PixID | Counts | Sigma | Mean | Median | Sigma |
| A | 10 | 83 | 1798279 | 3462.36 | 2568 | 2525 | 518.7 |
| A | 13 | 248 | 1127936 | 2169.88 | 2568 | 2525 | 518.7 |
| A | 6 | 10 | 1067392 | 2053.15 | 2568 | 2525 | 518.7 |
| B | 5 | 255 | 279379 | 568.37 | 2550 | 2480 | 487.2 |
| B | 4 | 170 | 218541 | 443.49 | 2550 | 2480 | 487.2 |
| B | 0 | 230 | 116122 | 233.26 | 2550 | 2480 | 487.2 |
| C | 14 | 254 | 1230492 | 2103.14 | 2509 | 2533 | 583.9 |
| C | 15 | 214 | 1038404 | 1774.15 | 2509 | 2533 | 583.9 |
| C | 12 | 249 | 44156 | 71.29 | 2509 | 2533 | 583.9 |
| D | 12 | 227 | 6114827 | 10428.91 | 2362 | 2301 | 586.1 |
| D | 12 | 128 | 1122815 | 1911.77 | 2362 | 2301 | 586.1 |
| D | 12 | 191 | 555306 | 943.51 | 2362 | 2301 | 586.1 |
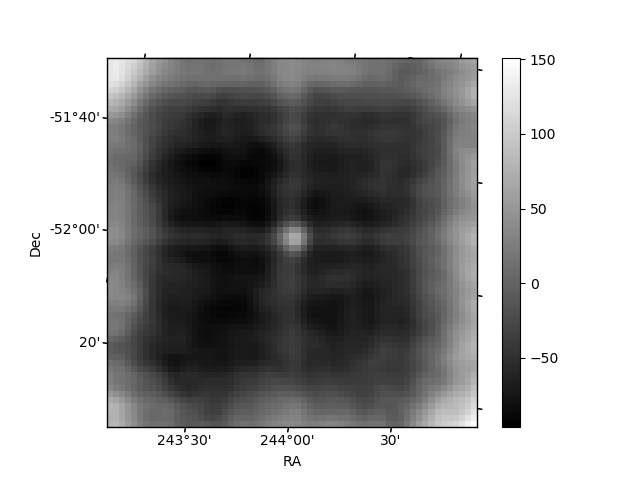
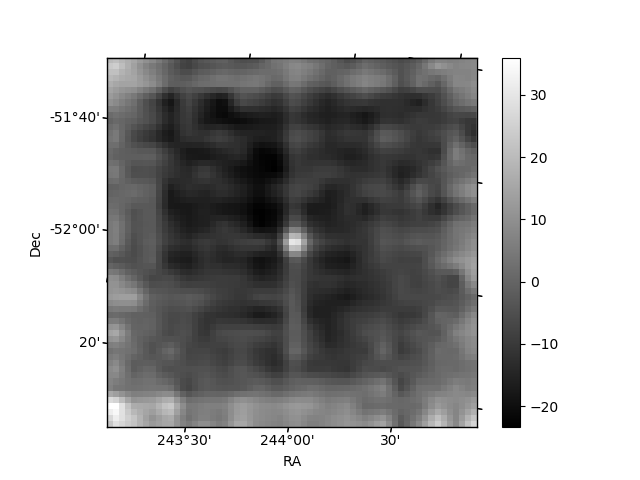
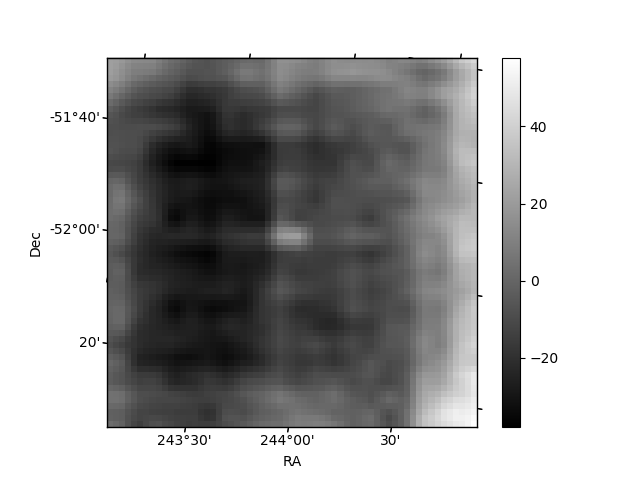
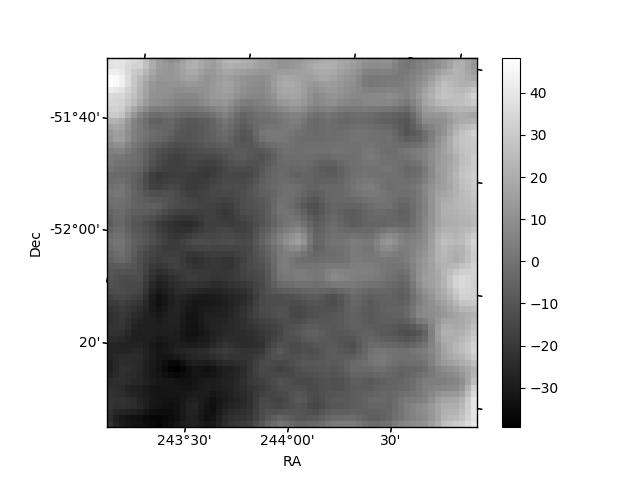
Histogram calculated using DETX and DETY for each event in the final _common_clean file
| Quadrant A | 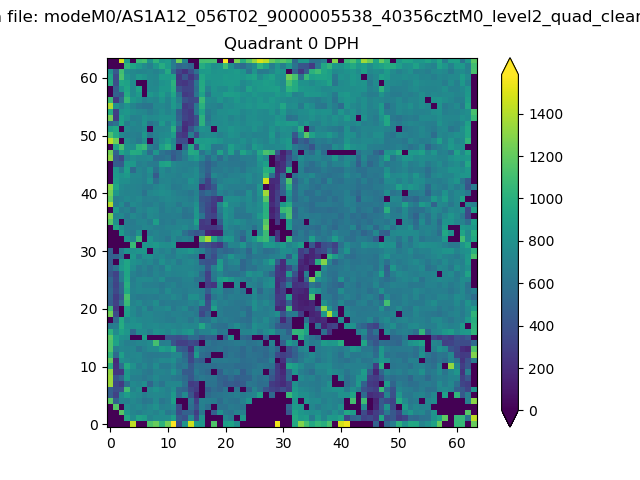 |
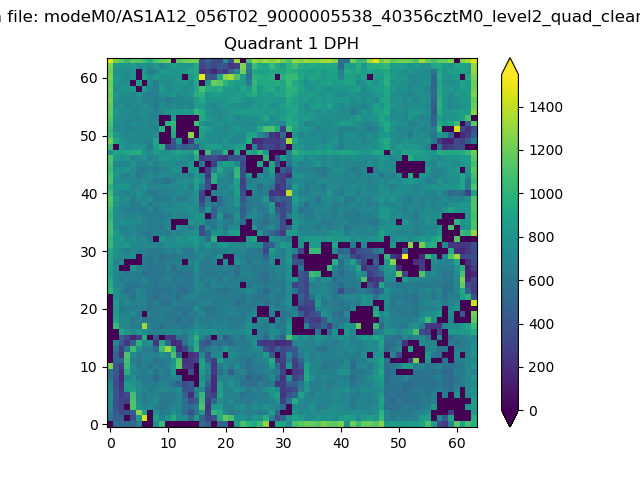 |
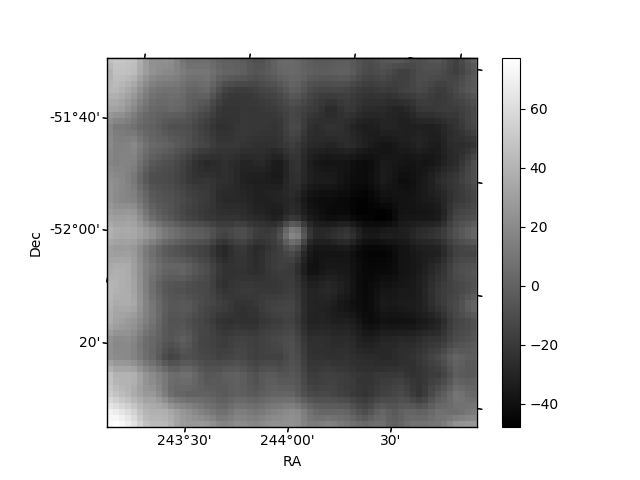
Quadrant B |
|---|---|---|---|
| Quadrant D | 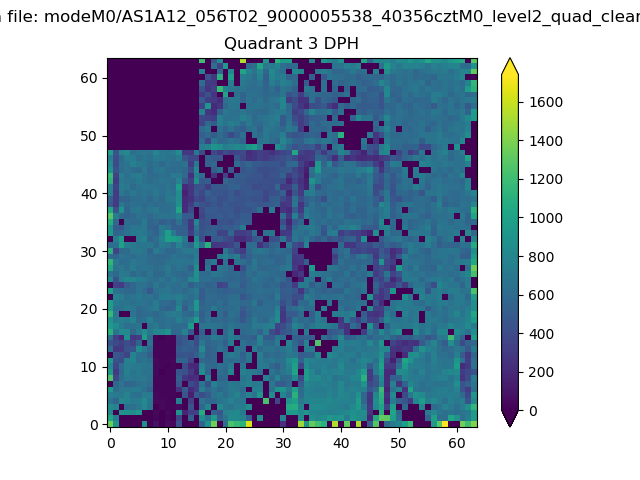 |
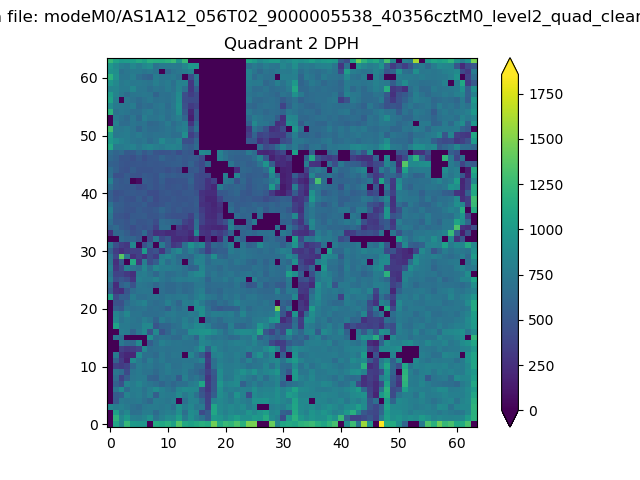 |
Quadrant C |
| Plot type | Count rate plots | Images |
|---|---|---|
| Comparison with Poisson distribution Blue bars denote a histogram of data divided into 1 sec bins. Red curve is a Poisson curve with rate = median count rate of data. |
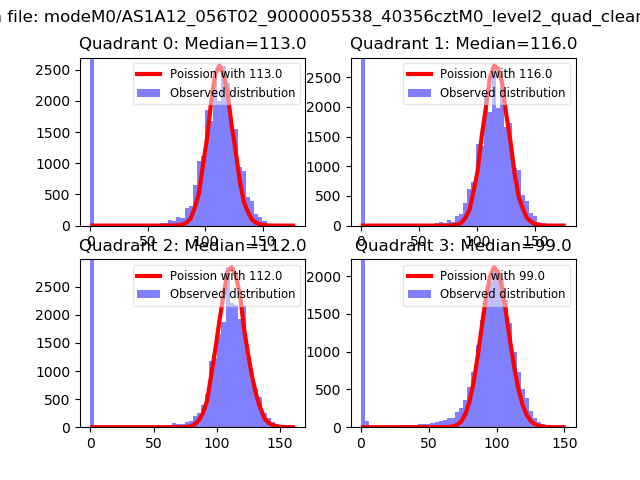 |
 |
| Quadrant-wise count rates Data is divided into 100 sec bins |
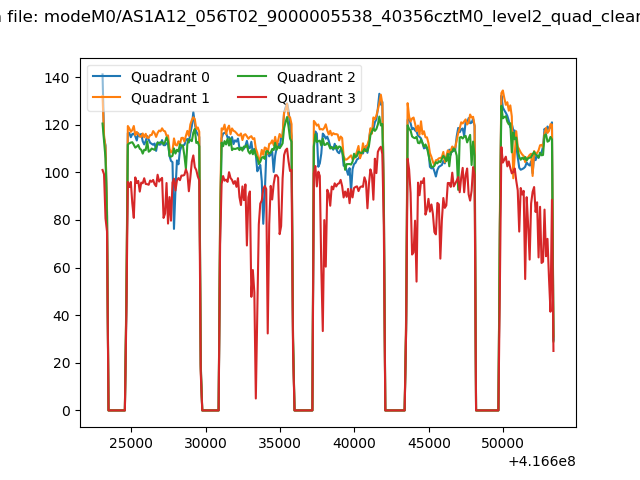 |
|
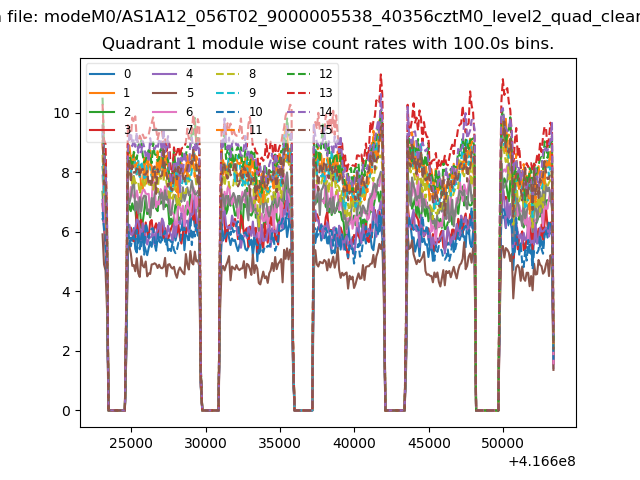
| Module-wise count rates for Quadrant A Data is divided into 100 sec bins |
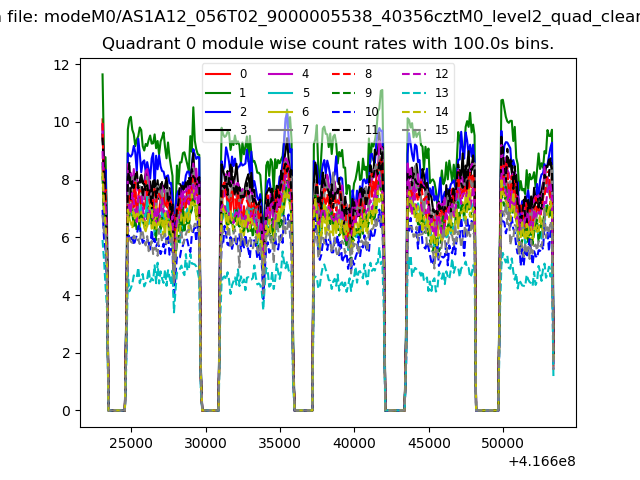 |
 |
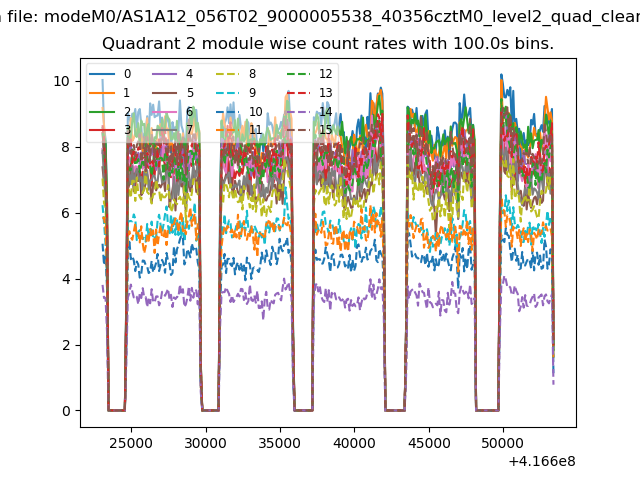
| Module-wise count rates for Quadrant B Data is divided into 100 sec bins |
 |
 |
| Module-wise count rates for Quadrant C Data is divided into 100 sec bins |
 |
 |
| Module-wise count rates for Quadrant D Data is divided into 100 sec bins |
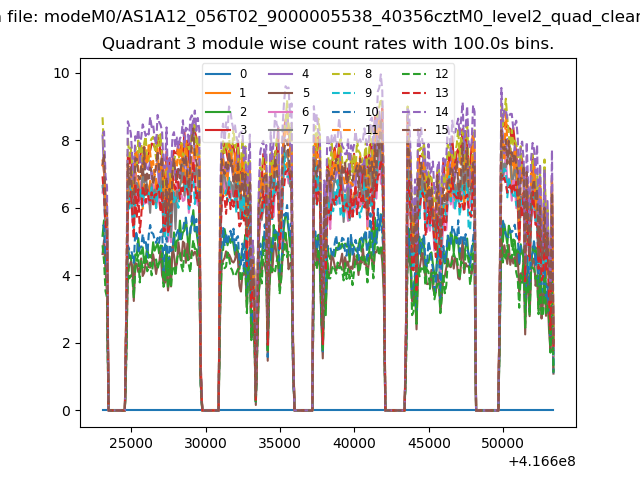 |
 |
| Parameter | Plot |
|---|---|
| CZT HV Monitor | 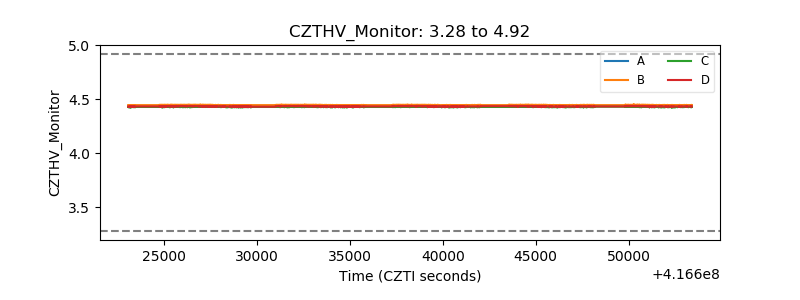 |
| D_VDD | 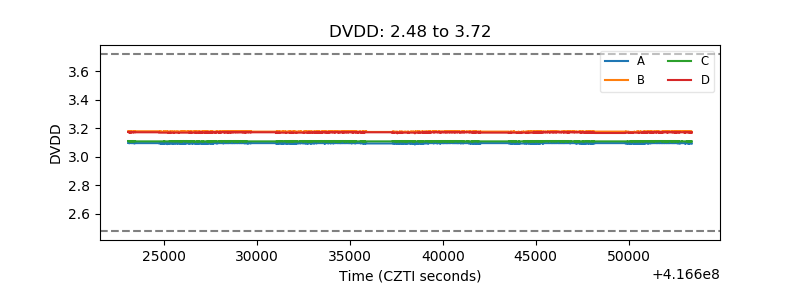 |
| Temperature 1 |  |
| Veto HV Monitor | 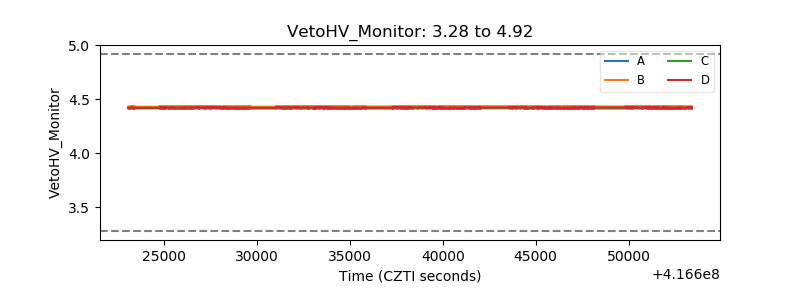 |
| Veto LLD | 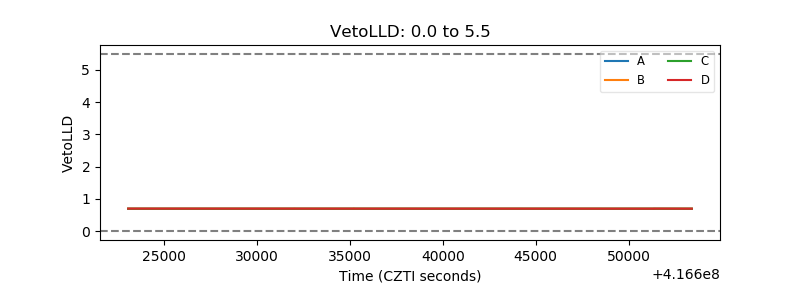 |
| Alpha Counter |  |
| _CPM_Rate | 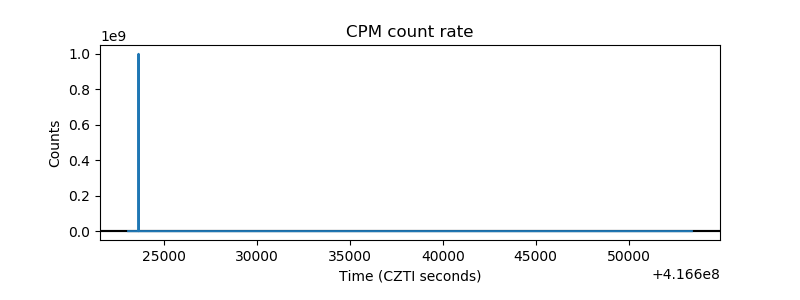 |
| CZT Counter | 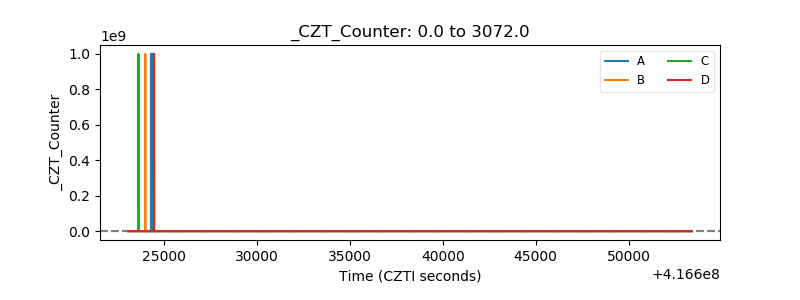 |
| +2.5 Volts monitor | 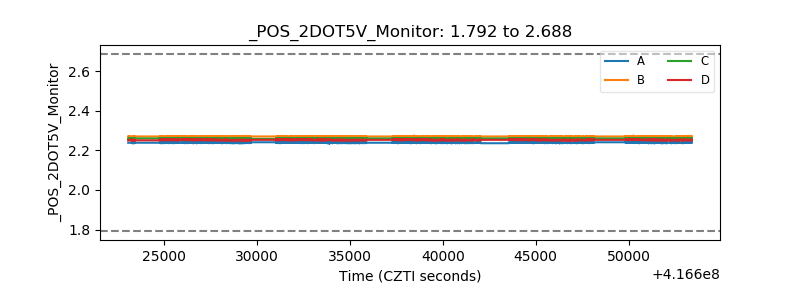 |
| +5 Volts monitor | 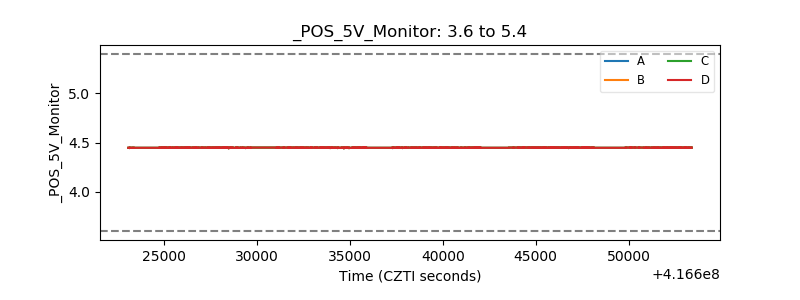 |
| _ROLL_ROT | 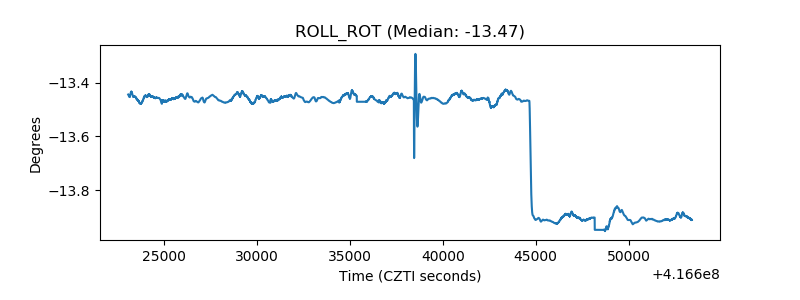 |
| _Roll_DEC | 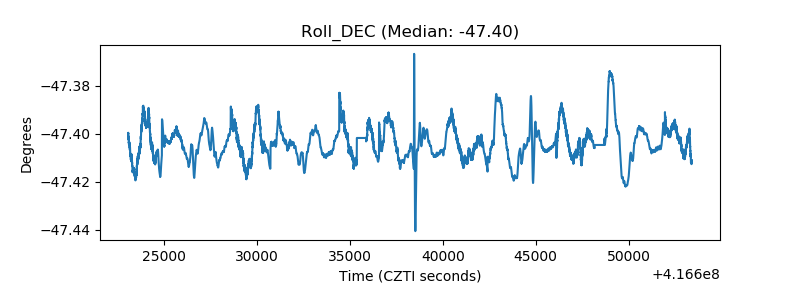 |
| _Roll_RA | 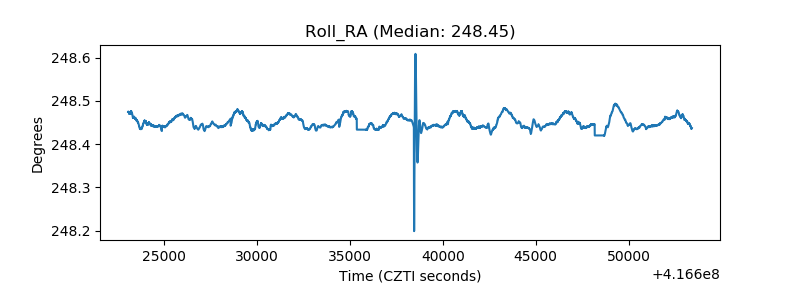 |
| Veto Counter | 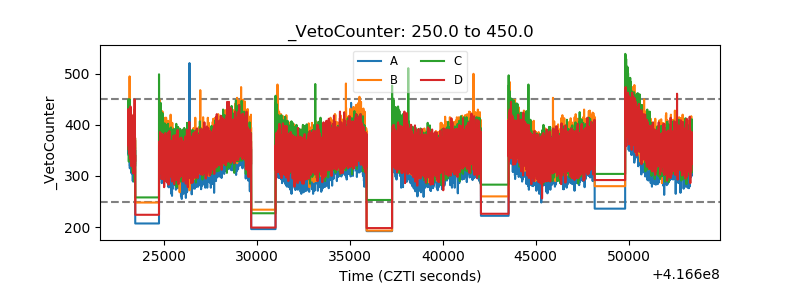 |