| Param | Original file | Final file |
|---|---|---|
| Filename | modeM0/AS1A12_056T02_9000005538_40357cztM0_level2.fits | modeM0/AS1A12_056T02_9000005538_40357cztM0_level2_quad_clean.evt |
| Size (bytes) | 465,701,760 | 120,332,160 |
| Size | 444.1 MB | 114.8 MB |
| Events in quadrant A | 4,135,321 | 842,645 |
| Events in quadrant B | 3,564,296 | 848,260 |
| Events in quadrant C | 3,952,994 | 815,074 |
| Events in quadrant D | 5,055,920 | 662,275 |
| Mode M0 | |||
|---|---|---|---|
| Quadrant | BADHDUFLAG | Total packets | Discarded packets |
| A | 0 | 16259 | 3 |
| B | 0 | 14965 | 2 |
| C | 0 | 15835 | 2 |
| D | 0 | 19524 | 2 |
| Mode M9 | |||
|---|---|---|---|
| Quadrant | BADHDUFLAG | Total packets | Discarded packets |
| A | 0 | 36 | 0 |
| B | 0 | 36 | 0 |
| C | 0 | 36 | 0 |
| D | 0 | 36 | 0 |
| Mode SS | |||
|---|---|---|---|
| Quadrant | BADHDUFLAG | Total packets | Discarded packets |
| A | 0 | 142 | 0 |
| B | 0 | 142 | 0 |
| C | 0 | 142 | 0 |
| D | 0 | 142 | 0 |
| Quadrant | Total seconds | Saturated seconds | Saturation percentage |
|---|---|---|---|
| A | 6817 | 45 | 0.660114% |
| B | 6817 | 128 | 1.877659% |
| C | 6817 | 90 | 1.320229% |
| D | 6817 | 993 | 14.566525% |
Noise dominated data is calculated using 1-second bins in cleaned event files. If a bin has >2000 counts, and if more than 50% of those come from <1% of pixels, then it is considered to be noise-dominated and hence unusable.
| Quadrant | # 1 sec bins | Bins with >0 counts | Bins with >2000 counts | High rate bins dominated by noise | Noise dominated (total time) | Noise dominated (detector-on time) | Marked lightcurve |
|---|---|---|---|---|---|---|---|
| A | 10491 | 6819 | 30 | 30 | 0.29% | 0.44% | 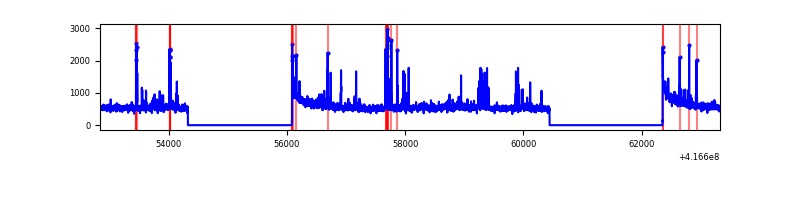 |
| B | 10491 | 6819 | 91 | 91 | 0.87% | 1.33% | 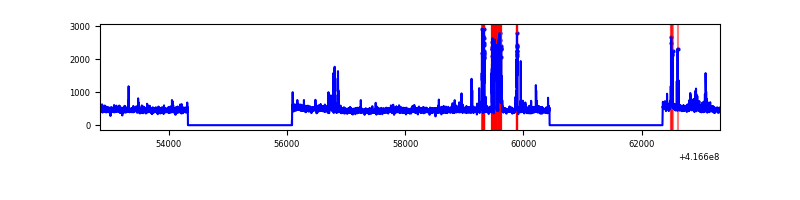 |
| C | 10491 | 6819 | 78 | 78 | 0.74% | 1.14% | 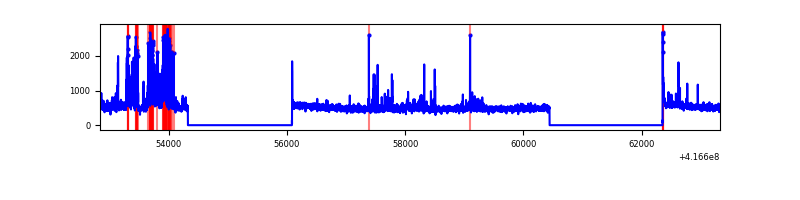 |
| D | 10491 | 6819 | 367 | 367 | 3.50% | 5.38% | 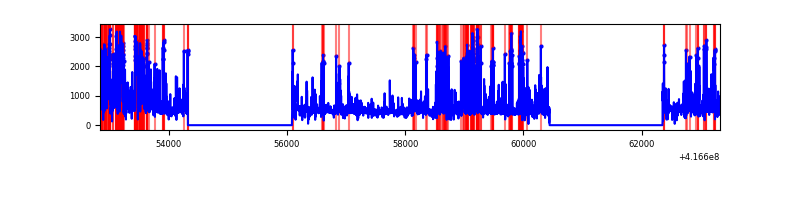 |
Top three noisy pixels from each quadrant. If the there are fewer than three noisy pixels in the level2.evt file, extra rows are filled as -1
| Pixel properties | Quadrant properties | ||||||
|---|---|---|---|---|---|---|---|
| Quadrant | DetID | PixID | Counts | Sigma | Mean | Median | Sigma |
| A | 10 | 83 | 575567 | 3558.66 | 792 | 780 | 161.5 |
| A | 13 | 248 | 174408 | 1074.98 | 792 | 780 | 161.5 |
| A | 6 | 10 | 82698 | 507.18 | 792 | 780 | 161.5 |
| B | 4 | 170 | 356202 | 2403.77 | 781 | 762 | 147.9 |
| B | 5 | 255 | 69401 | 464.19 | 781 | 762 | 147.9 |
| B | 0 | 230 | 31557 | 208.26 | 781 | 762 | 147.9 |
| C | 14 | 254 | 645621 | 3648.55 | 766 | 775 | 176.7 |
| C | 15 | 214 | 288032 | 1625.31 | 766 | 775 | 176.7 |
| C | 0 | 10 | 24286 | 133.03 | 766 | 775 | 176.7 |
| D | 12 | 227 | 1518422 | 8578.7 | 713 | 694 | 176.9 |
| D | 12 | 128 | 225276 | 1269.41 | 713 | 694 | 176.9 |
| D | 12 | 191 | 200446 | 1129.06 | 713 | 694 | 176.9 |
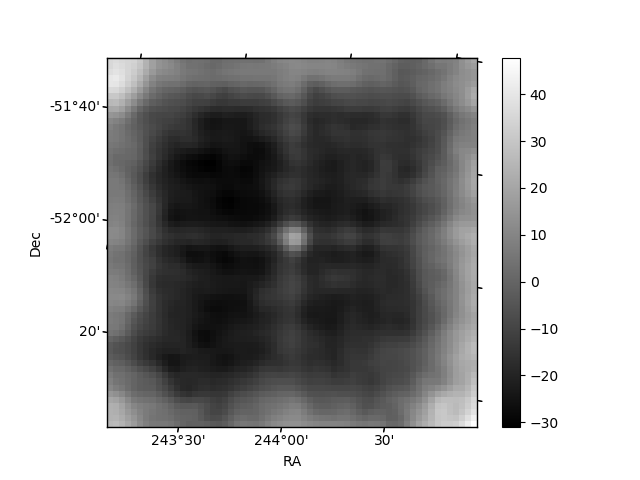
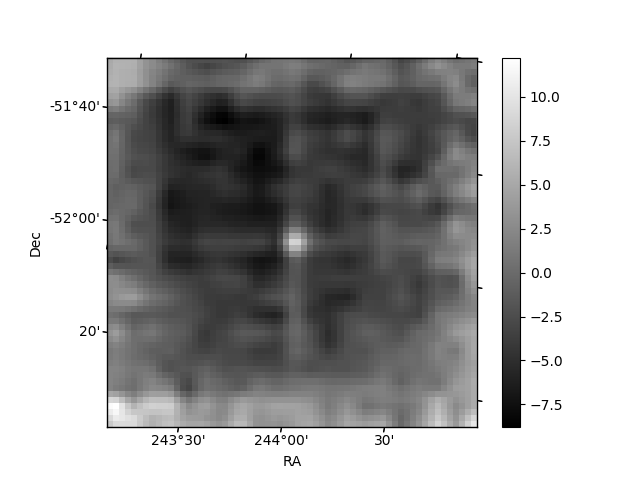
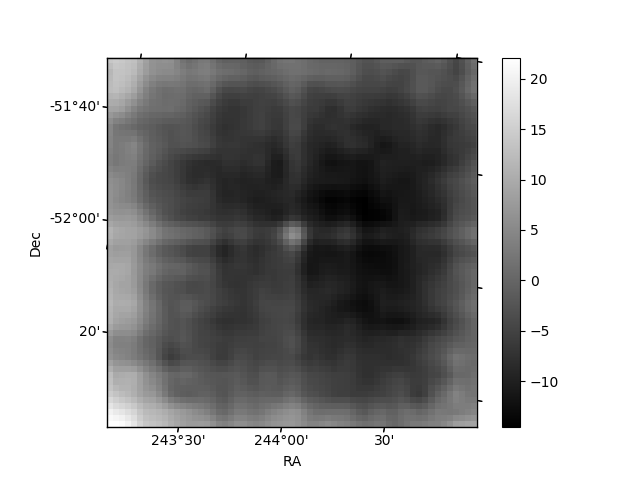
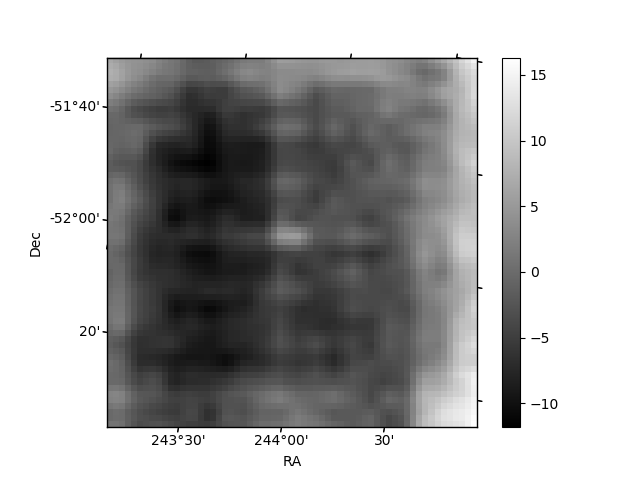
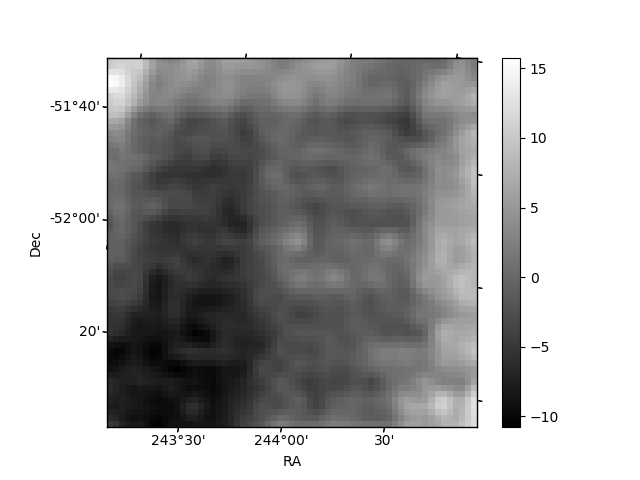
Histogram calculated using DETX and DETY for each event in the final _common_clean file
| Quadrant A | 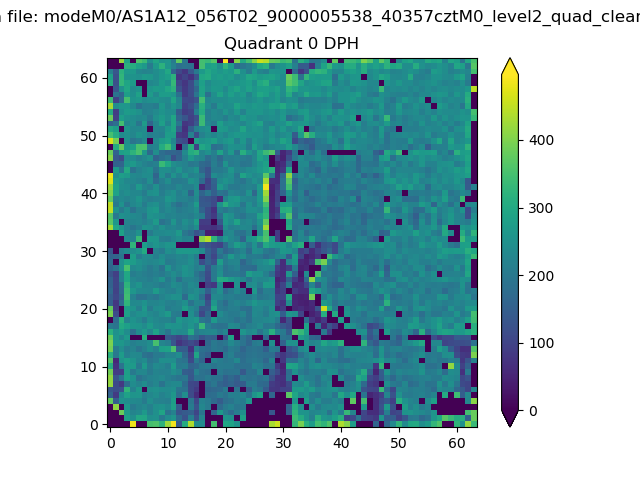 |
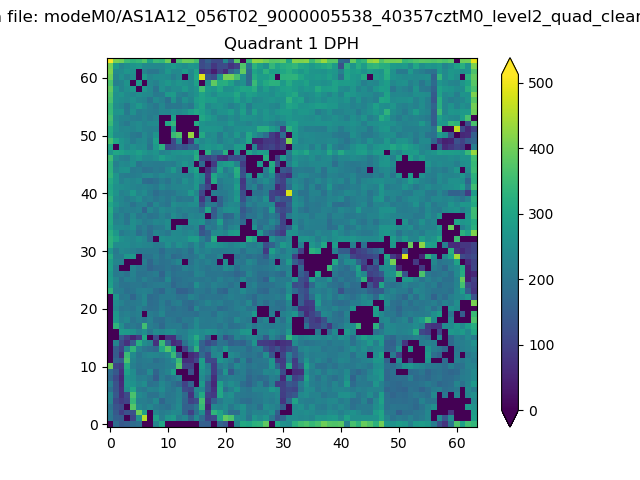 |
Quadrant B |
|---|---|---|---|
| Quadrant D | 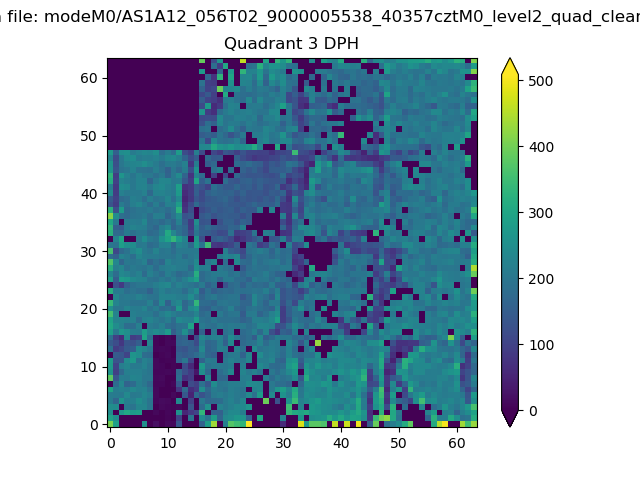 |
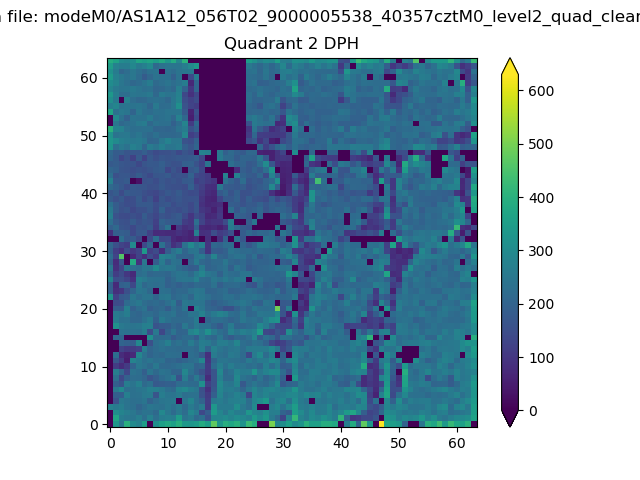 |
Quadrant C |
| Plot type | Count rate plots | Images |
|---|---|---|
| Comparison with Poisson distribution Blue bars denote a histogram of data divided into 1 sec bins. Red curve is a Poisson curve with rate = median count rate of data. |
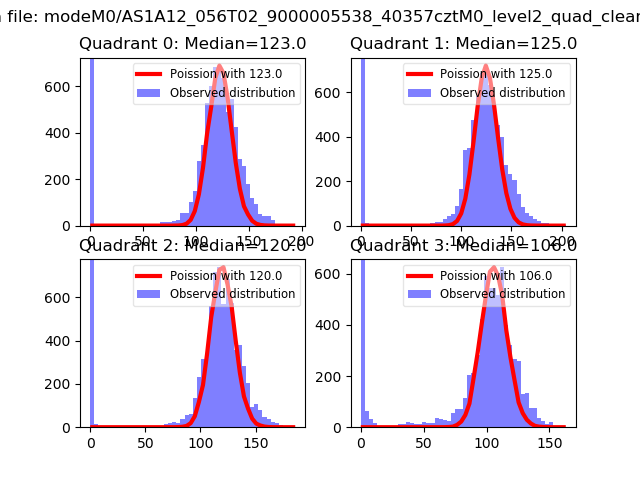 |
 |
| Quadrant-wise count rates Data is divided into 100 sec bins |
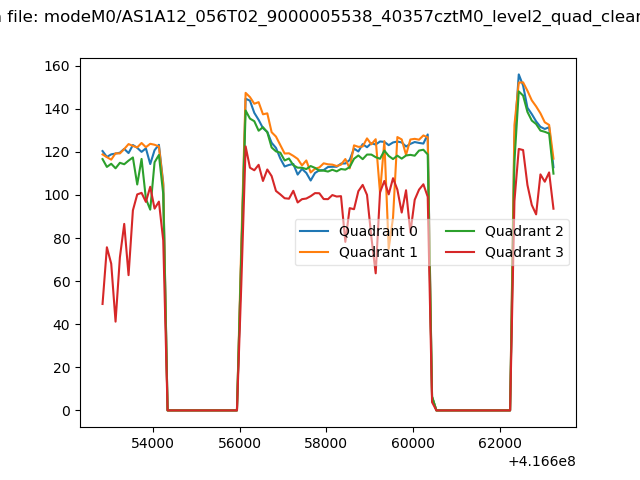 |
|
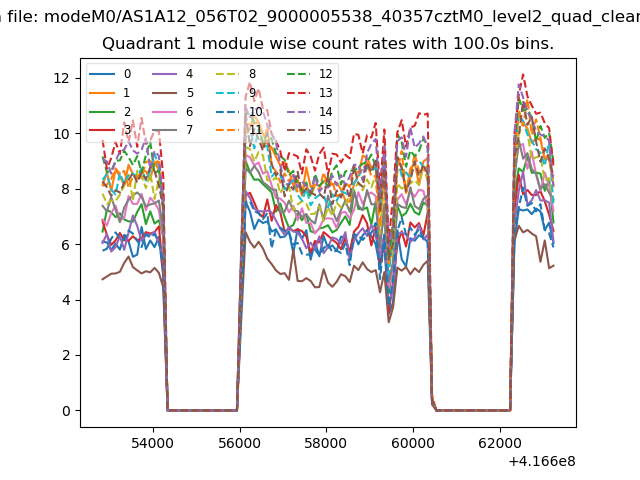
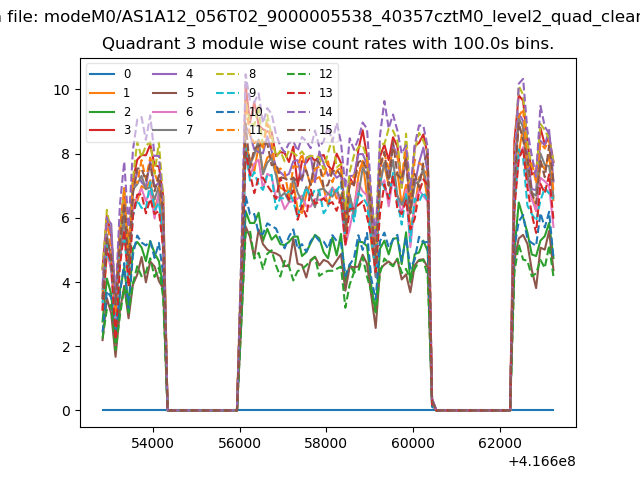
| Module-wise count rates for Quadrant A Data is divided into 100 sec bins |
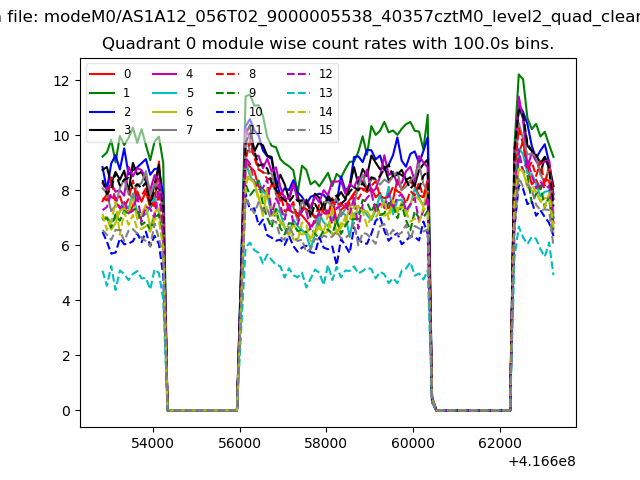 |
 |
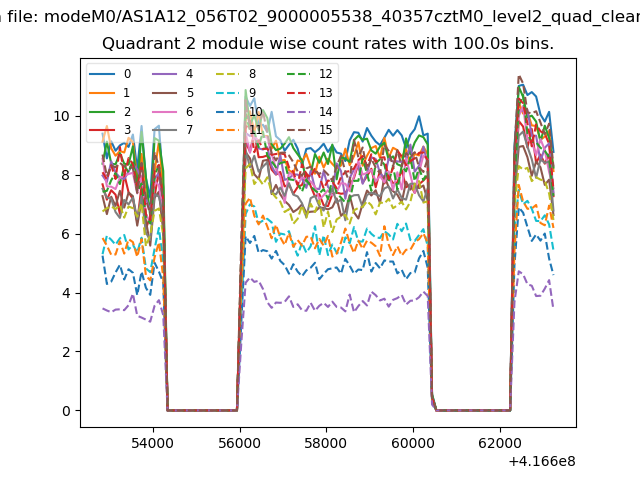
| Module-wise count rates for Quadrant B Data is divided into 100 sec bins |
 |
 |
| Module-wise count rates for Quadrant C Data is divided into 100 sec bins |
 |
 |
| Module-wise count rates for Quadrant D Data is divided into 100 sec bins |
 |
 |
| Parameter | Plot |
|---|---|
| CZT HV Monitor | 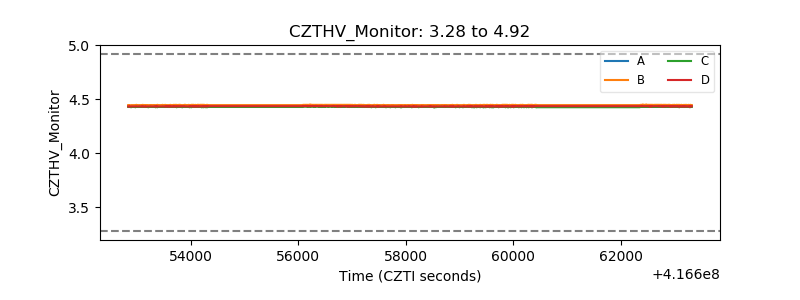 |
| D_VDD | 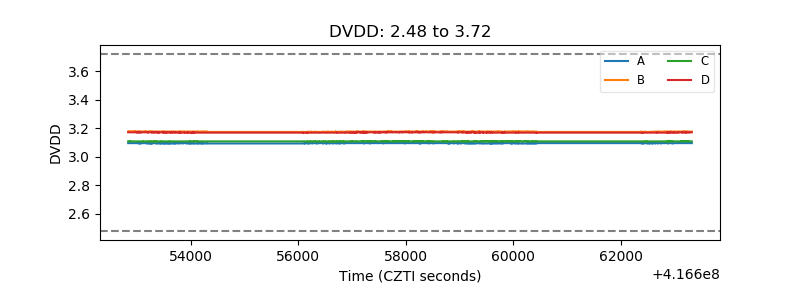 |
| Temperature 1 | 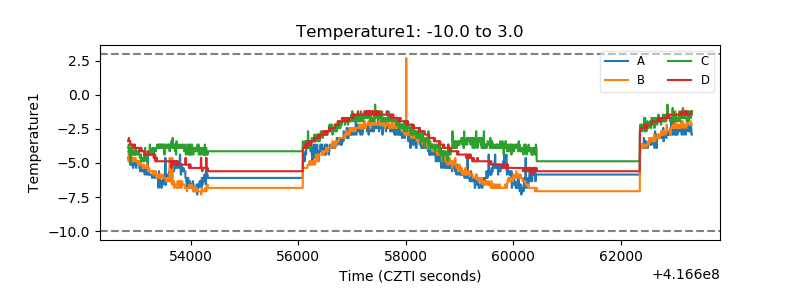 |
| Veto HV Monitor |  |
| Veto LLD | 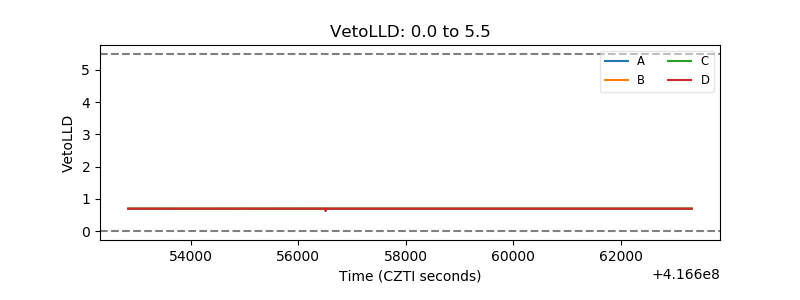 |
| Alpha Counter | 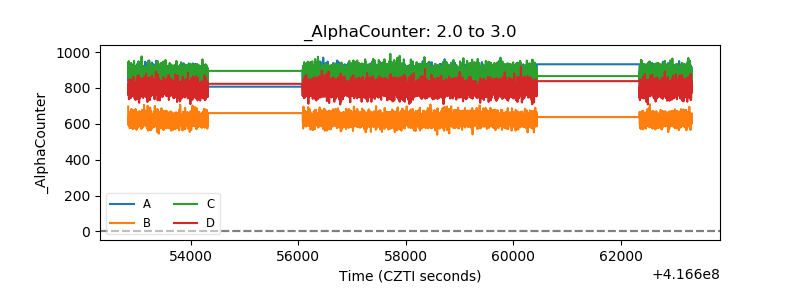 |
| _CPM_Rate | 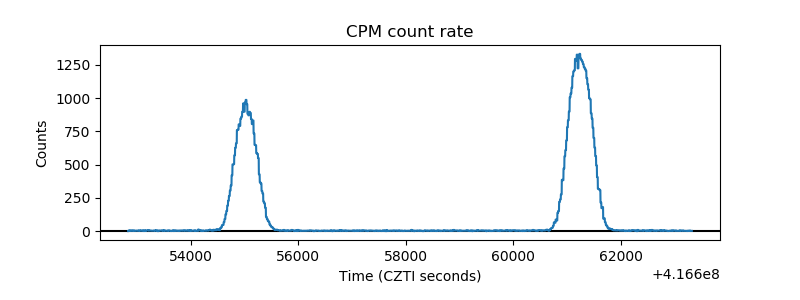 |
| CZT Counter | 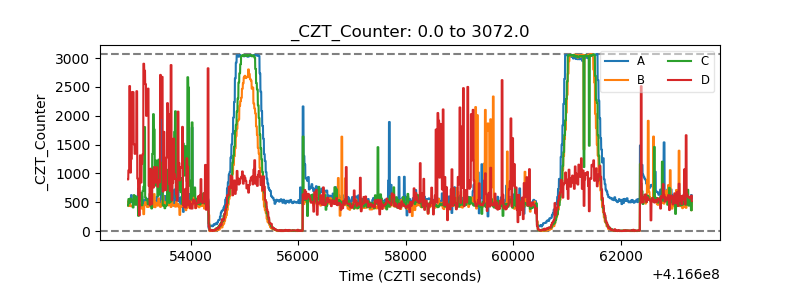 |
| +2.5 Volts monitor | 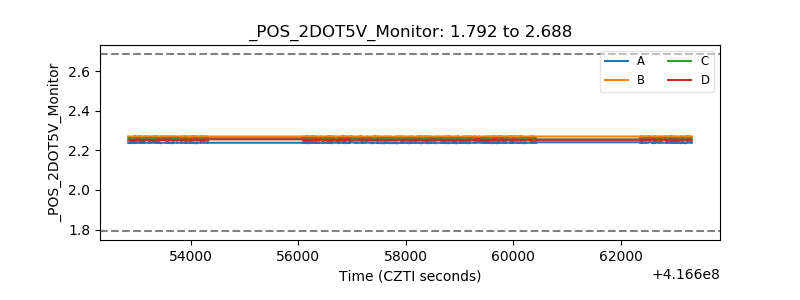 |
| +5 Volts monitor | 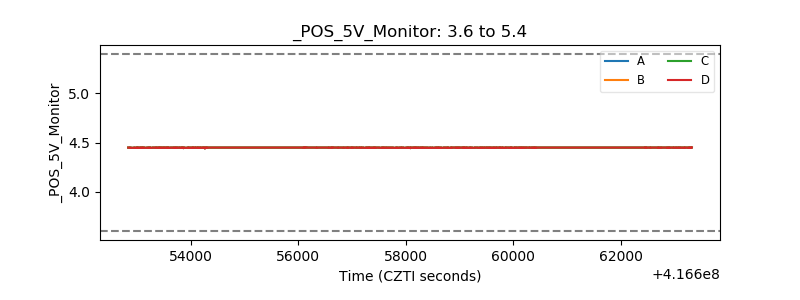 |
| _ROLL_ROT | 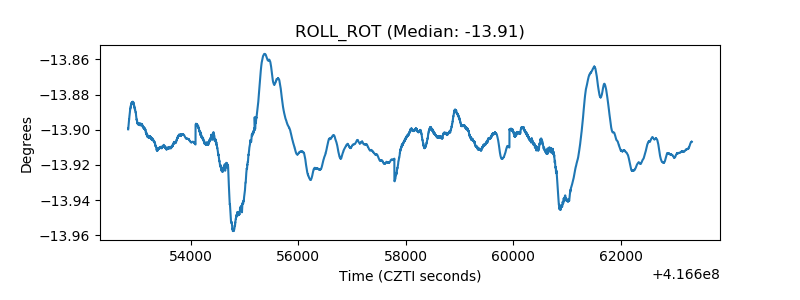 |
| _Roll_DEC | 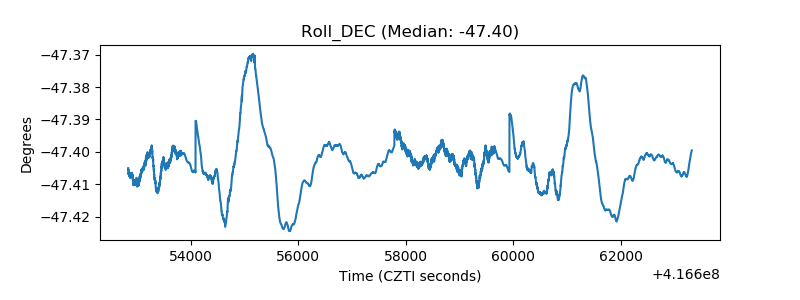 |
| _Roll_RA | 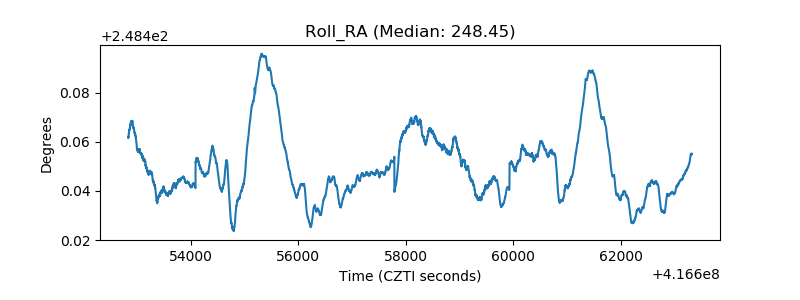 |
| Veto Counter | 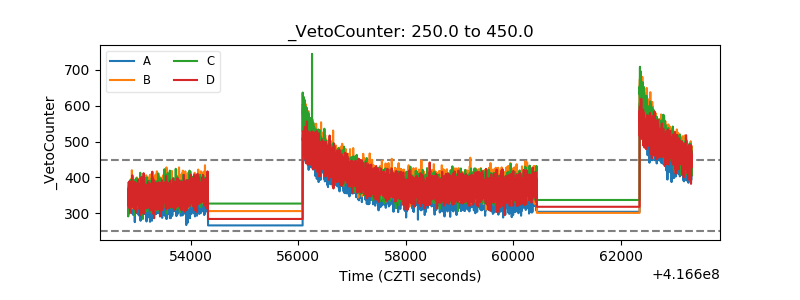 |