| Param | Original file | Final file |
|---|---|---|
| Filename | modeM0/AS1A12_056T02_9000005538_40362cztM0_level2.fits | modeM0/AS1A12_056T02_9000005538_40362cztM0_level2_quad_clean.evt |
| Size (bytes) | 323,988,480 | 87,393,600 |
| Size | 309.0 MB | 83.3 MB |
| Events in quadrant A | 3,092,872 | 602,805 |
| Events in quadrant B | 2,299,710 | 627,941 |
| Events in quadrant C | 2,489,350 | 593,485 |
| Events in quadrant D | 3,712,460 | 464,270 |
| Mode M0 | |||
|---|---|---|---|
| Quadrant | BADHDUFLAG | Total packets | Discarded packets |
| A | 0 | 12287 | 3 |
| B | 0 | 10301 | 2 |
| C | 0 | 10557 | 2 |
| D | 0 | 14526 | 2 |
| Mode M9 | |||
|---|---|---|---|
| Quadrant | BADHDUFLAG | Total packets | Discarded packets |
| A | 0 | 35 | 0 |
| B | 0 | 35 | 0 |
| C | 0 | 35 | 0 |
| D | 0 | 36 | 0 |
| Mode SS | |||
|---|---|---|---|
| Quadrant | BADHDUFLAG | Total packets | Discarded packets |
| A | 0 | 104 | 0 |
| B | 0 | 104 | 0 |
| C | 0 | 104 | 0 |
| D | 0 | 104 | 0 |
| Quadrant | Total seconds | Saturated seconds | Saturation percentage |
|---|---|---|---|
| A | 5105 | 163 | 3.192948% |
| B | 5105 | 6 | 0.117532% |
| C | 5105 | 24 | 0.470127% |
| D | 5105 | 870 | 17.042116% |
Noise dominated data is calculated using 1-second bins in cleaned event files. If a bin has >2000 counts, and if more than 50% of those come from <1% of pixels, then it is considered to be noise-dominated and hence unusable.
| Quadrant | # 1 sec bins | Bins with >0 counts | Bins with >2000 counts | High rate bins dominated by noise | Noise dominated (total time) | Noise dominated (detector-on time) | Marked lightcurve |
|---|---|---|---|---|---|---|---|
| A | 6988 | 5106 | 126 | 126 | 1.80% | 2.47% | 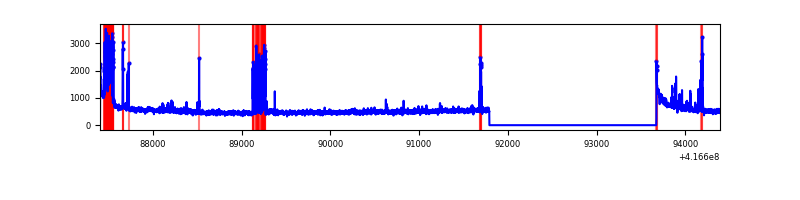 |
| B | 6988 | 5106 | 1 | 1 | 0.01% | 0.02% | 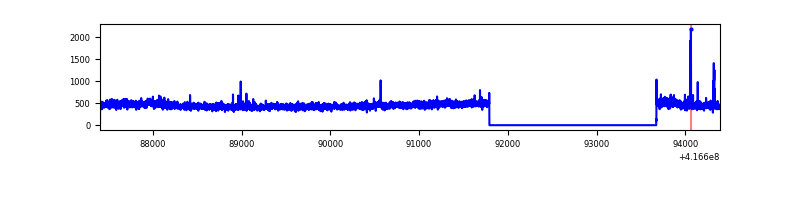 |
| C | 6988 | 5106 | 18 | 18 | 0.26% | 0.35% | 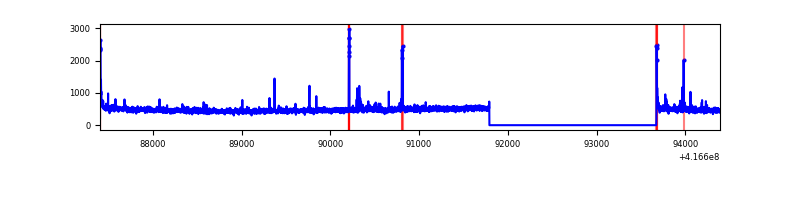 |
| D | 6988 | 5106 | 344 | 344 | 4.92% | 6.74% | 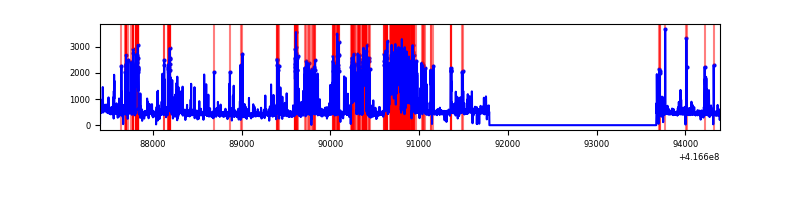 |
Top three noisy pixels from each quadrant. If the there are fewer than three noisy pixels in the level2.evt file, extra rows are filled as -1
| Pixel properties | Quadrant properties | ||||||
|---|---|---|---|---|---|---|---|
| Quadrant | DetID | PixID | Counts | Sigma | Mean | Median | Sigma |
| A | 10 | 83 | 444882 | 3934.04 | 556 | 548 | 112.9 |
| A | 13 | 248 | 414653 | 3666.4 | 556 | 548 | 112.9 |
| A | 2 | 79 | 28373 | 246.35 | 556 | 548 | 112.9 |
| B | 3 | 112 | 35700 | 321.72 | 565 | 550 | 109.3 |
| B | 0 | 230 | 24459 | 218.83 | 565 | 550 | 109.3 |
| B | 12 | 111 | 13366 | 117.3 | 565 | 550 | 109.3 |
| C | 15 | 214 | 219760 | 1698.2 | 552 | 557 | 129.1 |
| C | 14 | 254 | 80448 | 618.93 | 552 | 557 | 129.1 |
| C | 0 | 10 | 35953 | 274.22 | 552 | 557 | 129.1 |
| D | 2 | 250 | 1350154 | 10641.4 | 504 | 490 | 126.8 |
| D | 12 | 191 | 150919 | 1186.05 | 504 | 490 | 126.8 |
| D | 12 | 227 | 104627 | 821.07 | 504 | 490 | 126.8 |
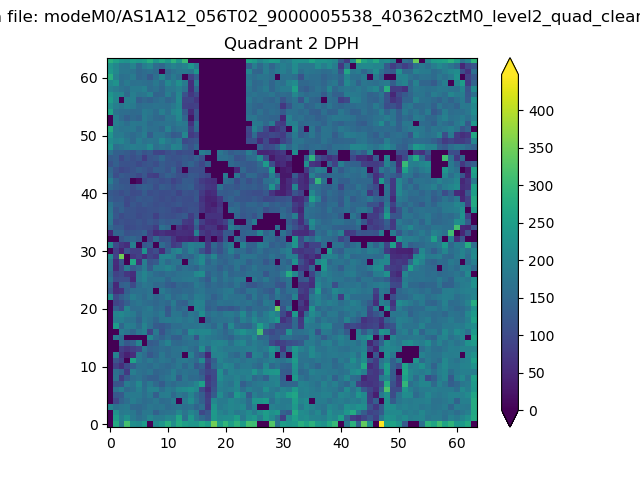
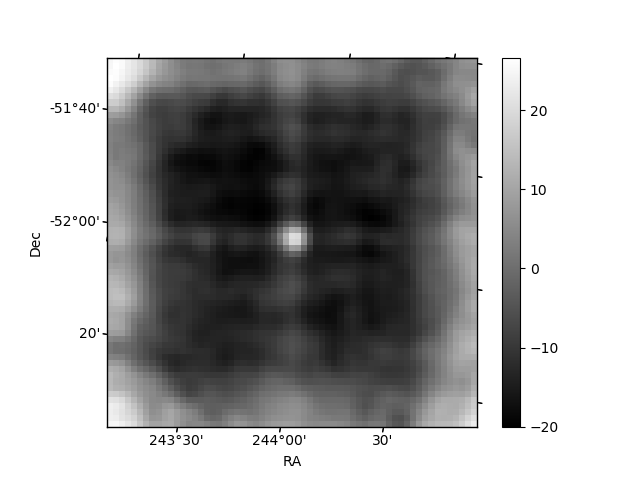
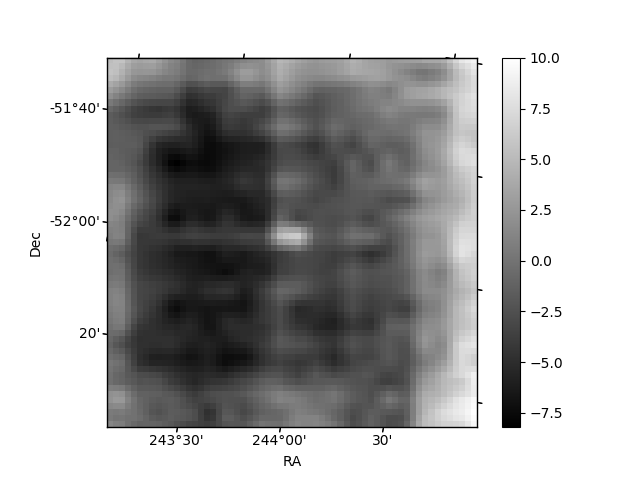
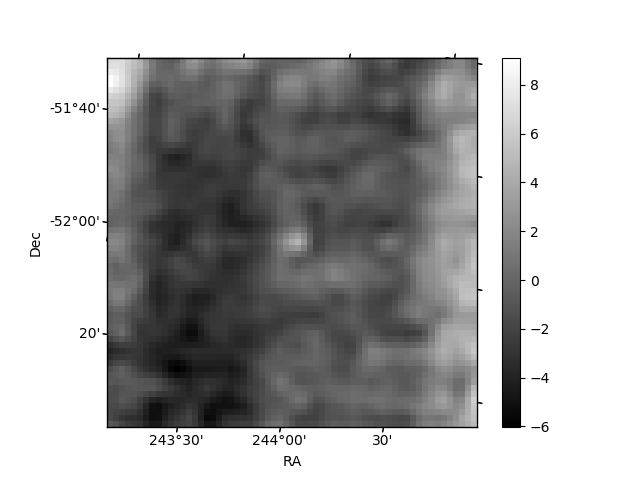
Histogram calculated using DETX and DETY for each event in the final _common_clean file
| Quadrant A | 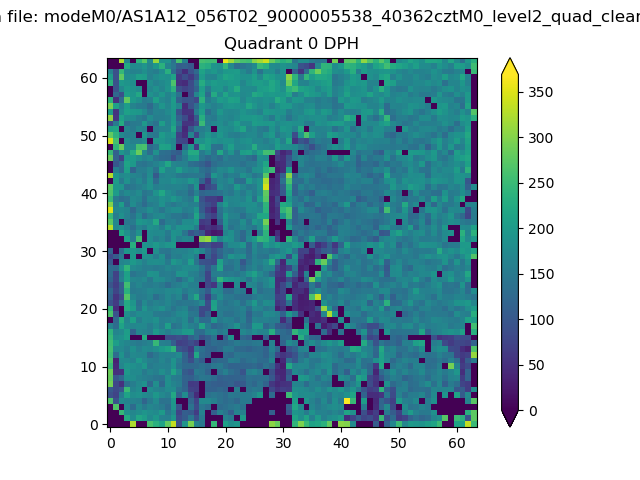 |
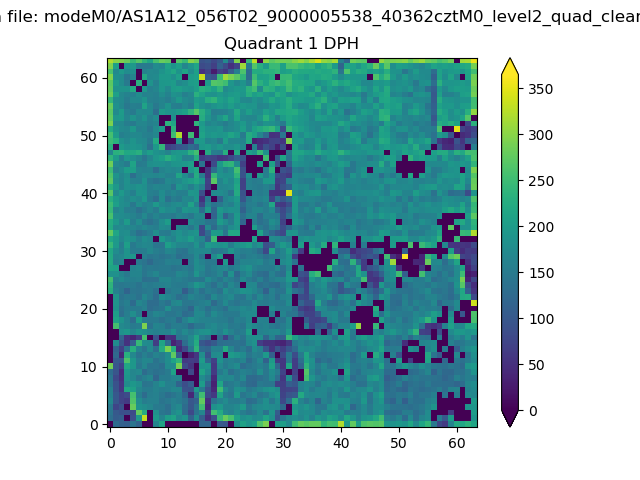 |
Quadrant B |
|---|---|---|---|
| Quadrant D | 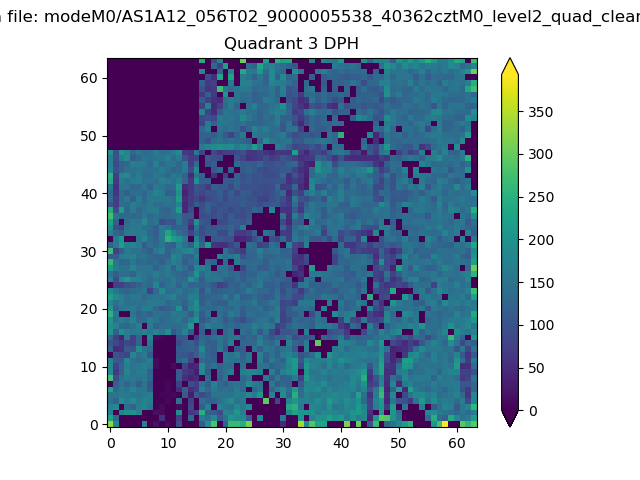 |
 |
Quadrant C |
| Plot type | Count rate plots | Images |
|---|---|---|
| Comparison with Poisson distribution Blue bars denote a histogram of data divided into 1 sec bins. Red curve is a Poisson curve with rate = median count rate of data. |
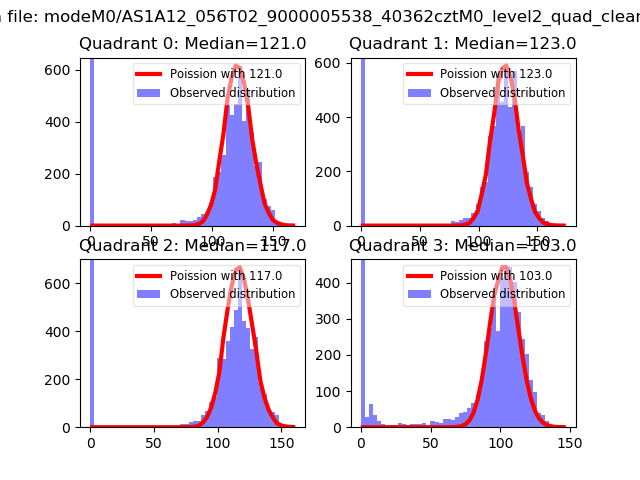 |
 |
| Quadrant-wise count rates Data is divided into 100 sec bins |
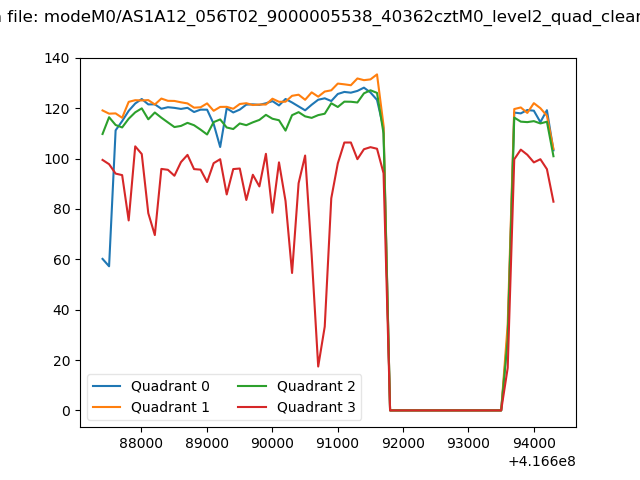 |
|
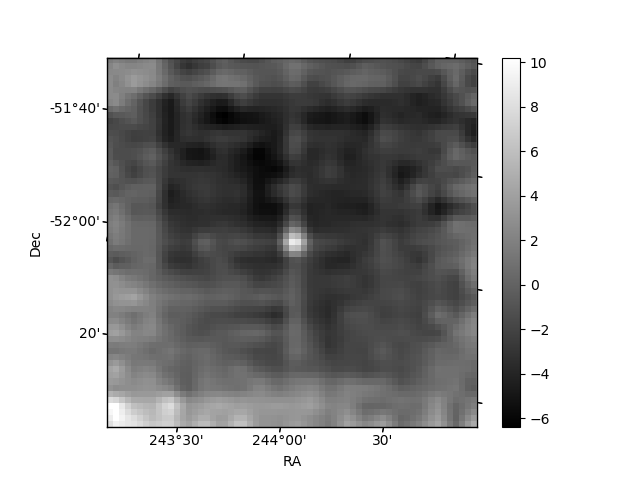
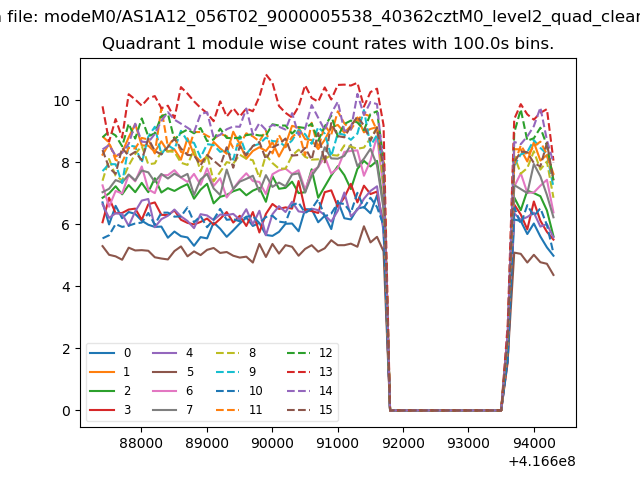
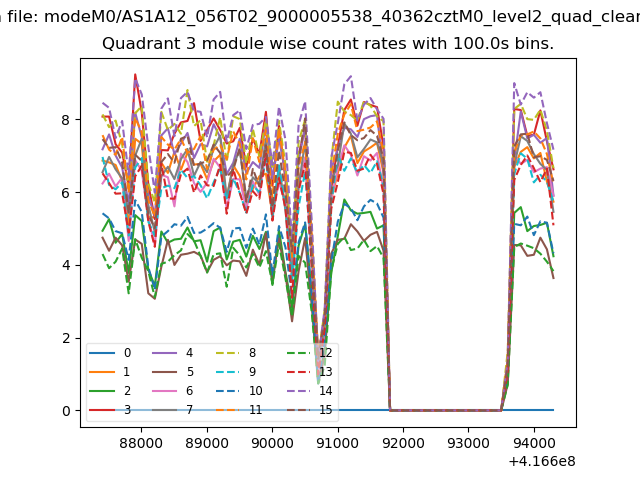
| Module-wise count rates for Quadrant A Data is divided into 100 sec bins |
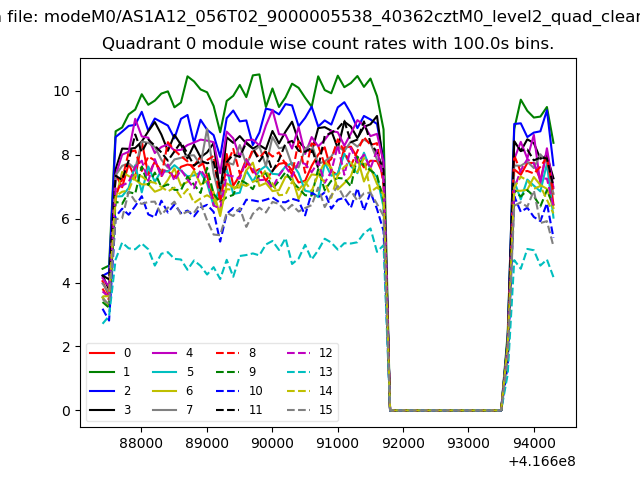 |
 |
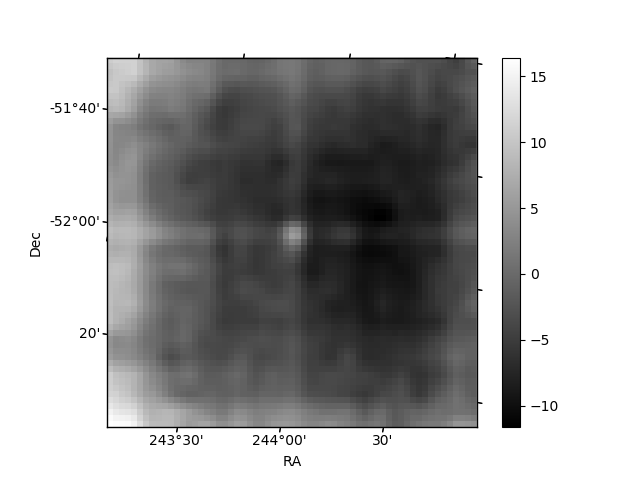
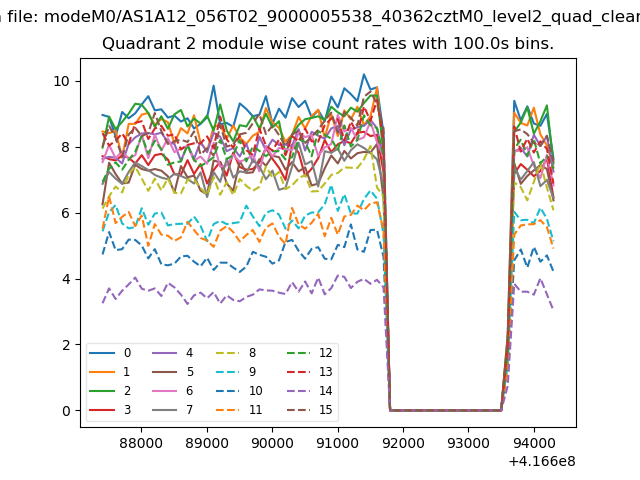
| Module-wise count rates for Quadrant B Data is divided into 100 sec bins |
 |
 |
| Module-wise count rates for Quadrant C Data is divided into 100 sec bins |
 |
 |
| Module-wise count rates for Quadrant D Data is divided into 100 sec bins |
 |
 |
| Parameter | Plot |
|---|---|
| CZT HV Monitor | 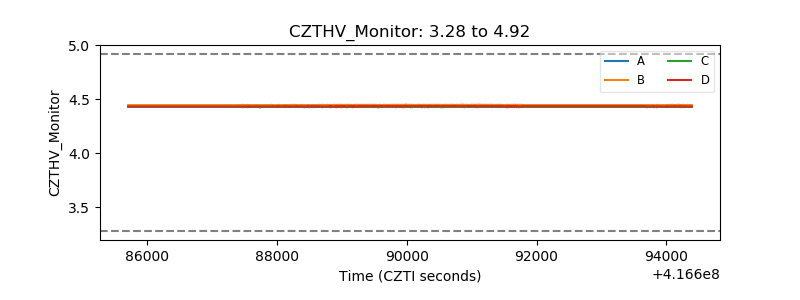 |
| D_VDD | 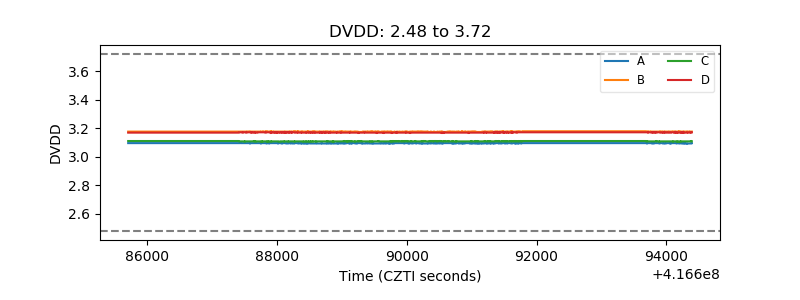 |
| Temperature 1 | 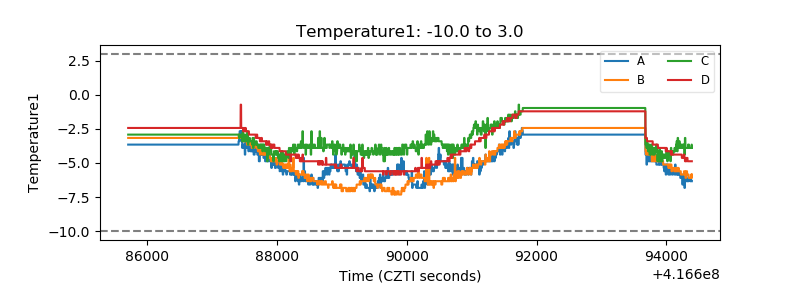 |
| Veto HV Monitor | 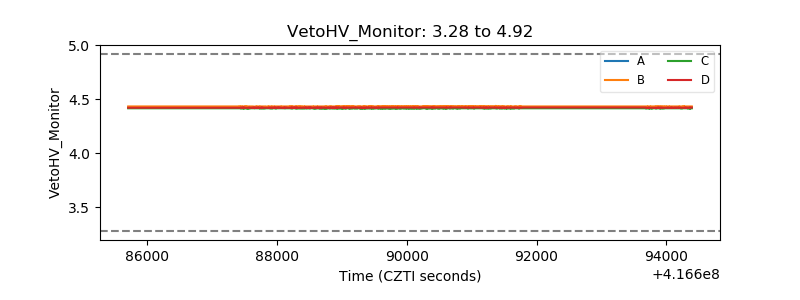 |
| Veto LLD | 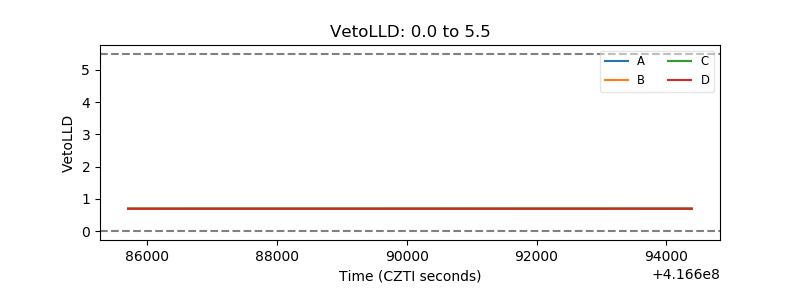 |
| Alpha Counter | 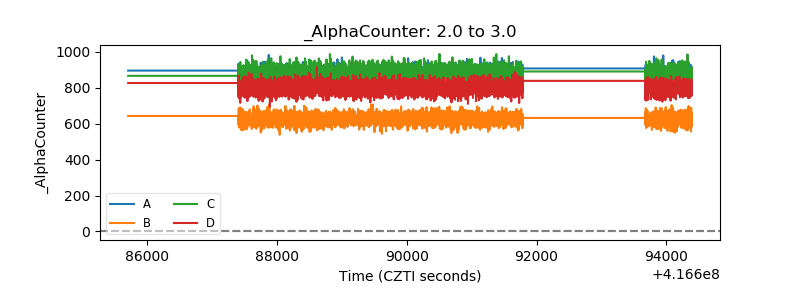 |
| _CPM_Rate | 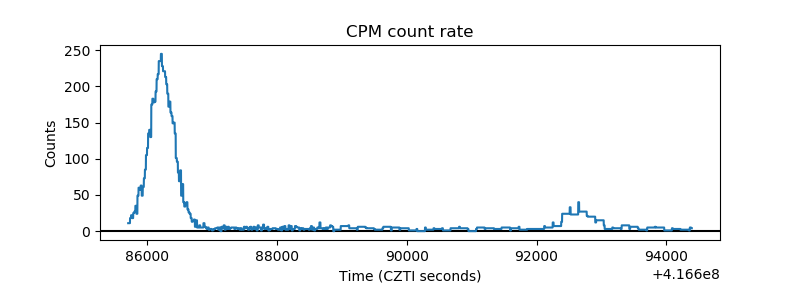 |
| CZT Counter | 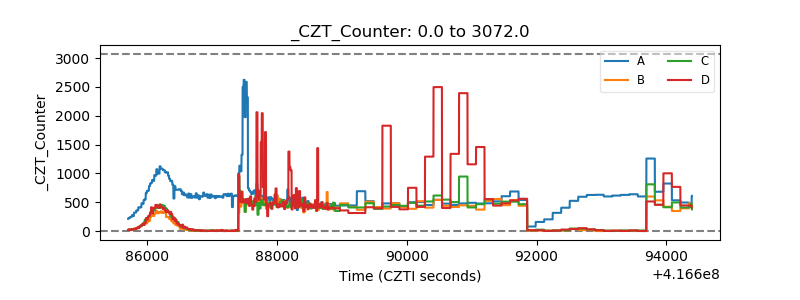 |
| +2.5 Volts monitor | 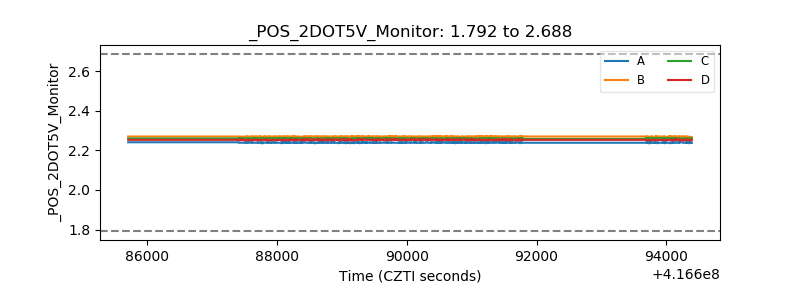 |
| +5 Volts monitor | 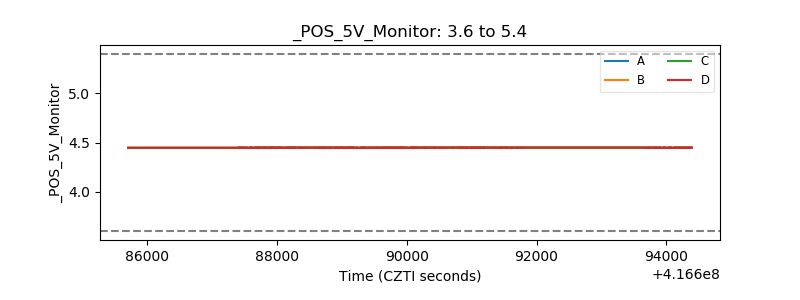 |
| _ROLL_ROT |  |
| _Roll_DEC | 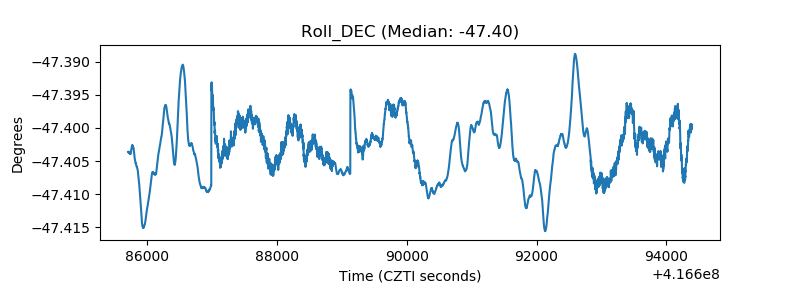 |
| _Roll_RA | 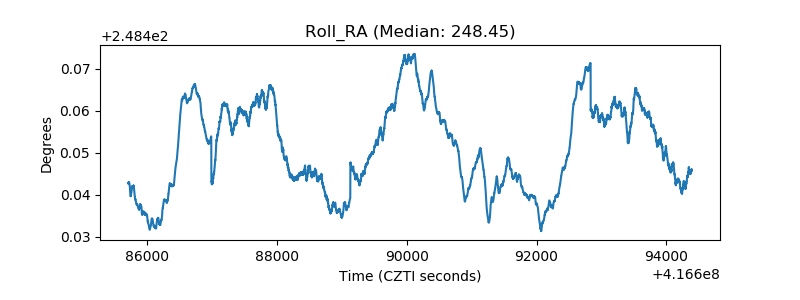 |
| Veto Counter | 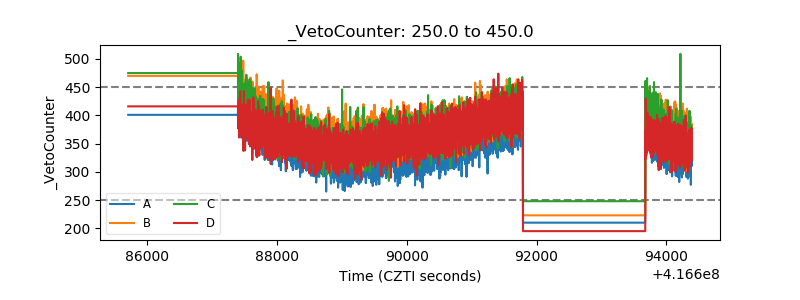 |