| Param | Original file | Final file |
|---|---|---|
| Filename | modeM0/AS1A12_056T02_9000005538_40363cztM0_level2.fits | modeM0/AS1A12_056T02_9000005538_40363cztM0_level2_quad_clean.evt |
| Size (bytes) | 349,574,400 | 94,919,040 |
| Size | 333.4 MB | 90.5 MB |
| Events in quadrant A | 3,272,912 | 654,754 |
| Events in quadrant B | 2,602,748 | 665,817 |
| Events in quadrant C | 3,273,984 | 630,490 |
| Events in quadrant D | 3,354,786 | 531,793 |
| Mode M0 | |||
|---|---|---|---|
| Quadrant | BADHDUFLAG | Total packets | Discarded packets |
| A | 0 | 13201 | 3 |
| B | 0 | 11654 | 2 |
| C | 0 | 13217 | 2 |
| D | 0 | 13859 | 2 |
| Mode M9 | |||
|---|---|---|---|
| Quadrant | BADHDUFLAG | Total packets | Discarded packets |
| A | 0 | 34 | 0 |
| B | 0 | 34 | 0 |
| C | 0 | 34 | 0 |
| D | 0 | 34 | 0 |
| Mode SS | |||
|---|---|---|---|
| Quadrant | BADHDUFLAG | Total packets | Discarded packets |
| A | 0 | 116 | 0 |
| B | 0 | 116 | 0 |
| C | 0 | 116 | 0 |
| D | 0 | 116 | 0 |
| Quadrant | Total seconds | Saturated seconds | Saturation percentage |
|---|---|---|---|
| A | 5591 | 43 | 0.769093% |
| B | 5591 | 20 | 0.357718% |
| C | 5591 | 69 | 1.234126% |
| D | 5591 | 532 | 9.515292% |
Noise dominated data is calculated using 1-second bins in cleaned event files. If a bin has >2000 counts, and if more than 50% of those come from <1% of pixels, then it is considered to be noise-dominated and hence unusable.
| Quadrant | # 1 sec bins | Bins with >0 counts | Bins with >2000 counts | High rate bins dominated by noise | Noise dominated (total time) | Noise dominated (detector-on time) | Marked lightcurve |
|---|---|---|---|---|---|---|---|
| A | 8997 | 5593 | 25 | 25 | 0.28% | 0.45% | 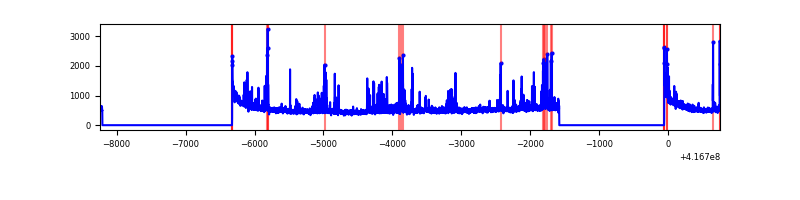 |
| B | 8997 | 5593 | 11 | 11 | 0.12% | 0.20% | 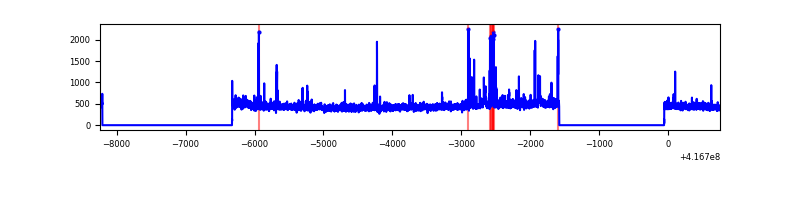 |
| C | 8997 | 5593 | 72 | 72 | 0.80% | 1.29% | 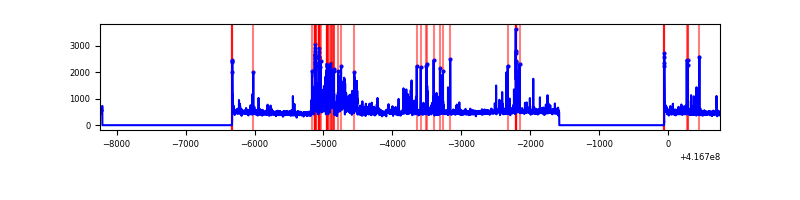 |
| D | 8997 | 5593 | 165 | 165 | 1.83% | 2.95% | 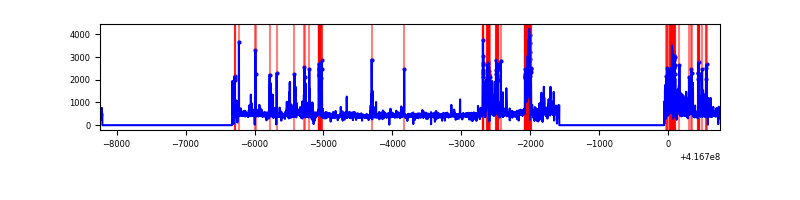 |
Top three noisy pixels from each quadrant. If the there are fewer than three noisy pixels in the level2.evt file, extra rows are filled as -1
| Pixel properties | Quadrant properties | ||||||
|---|---|---|---|---|---|---|---|
| Quadrant | DetID | PixID | Counts | Sigma | Mean | Median | Sigma |
| A | 10 | 83 | 489872 | 3908.8 | 614 | 604 | 125.2 |
| A | 13 | 248 | 241271 | 1922.71 | 614 | 604 | 125.2 |
| A | 6 | 10 | 54231 | 428.43 | 614 | 604 | 125.2 |
| B | 0 | 229 | 95179 | 794.14 | 613 | 596 | 119.1 |
| B | 5 | 255 | 35995 | 297.22 | 613 | 596 | 119.1 |
| B | 0 | 230 | 18751 | 152.43 | 613 | 596 | 119.1 |
| C | 14 | 254 | 665096 | 4715.92 | 600 | 605 | 140.9 |
| C | 15 | 214 | 236212 | 1672.11 | 600 | 605 | 140.9 |
| C | 0 | 10 | 28497 | 197.95 | 600 | 605 | 140.9 |
| D | 12 | 227 | 455011 | 3206.74 | 568 | 554 | 141.7 |
| D | 12 | 128 | 275942 | 1943.19 | 568 | 554 | 141.7 |
| D | 12 | 191 | 146850 | 1032.29 | 568 | 554 | 141.7 |
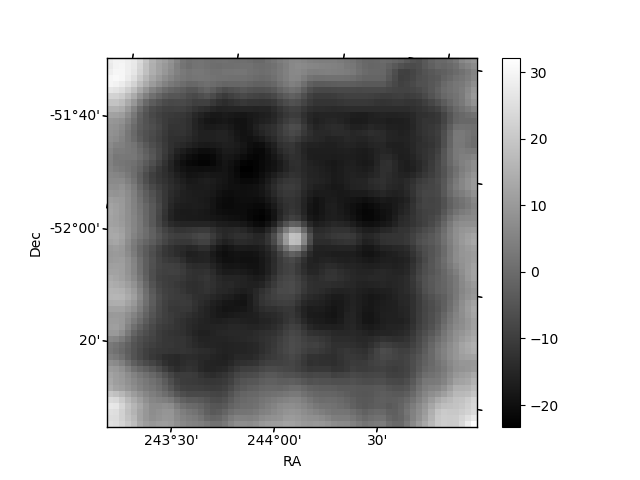
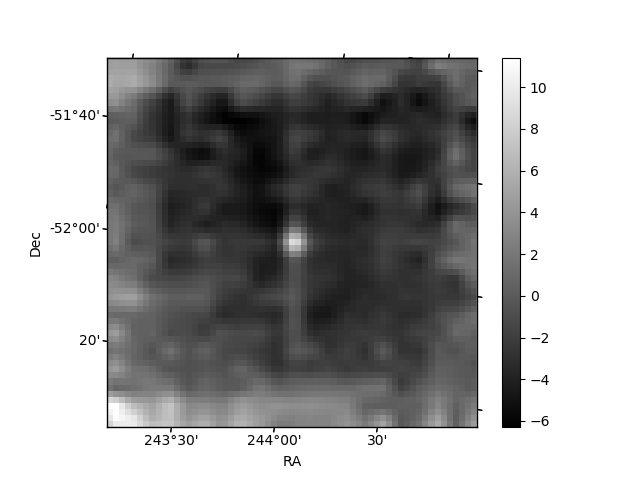
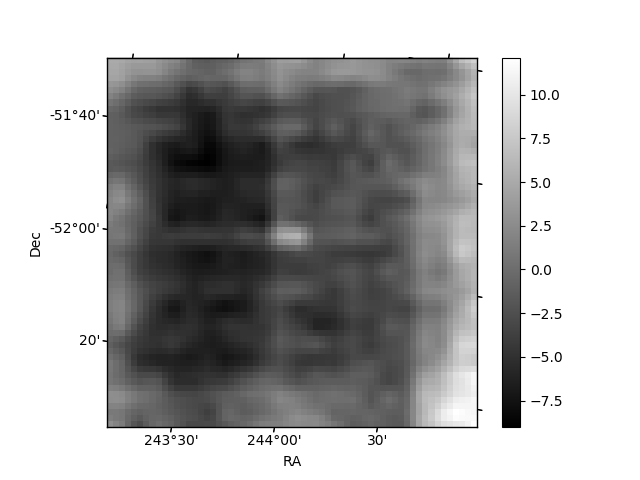
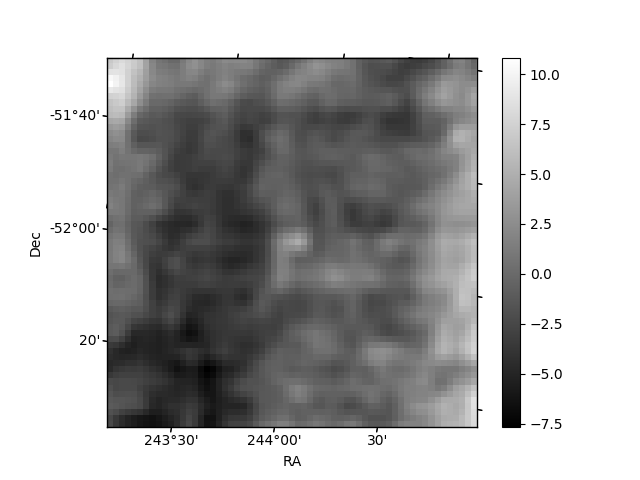
Histogram calculated using DETX and DETY for each event in the final _common_clean file
| Quadrant A | 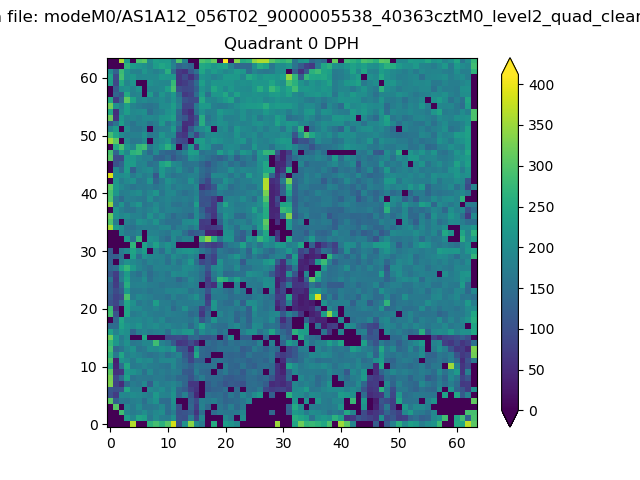 |
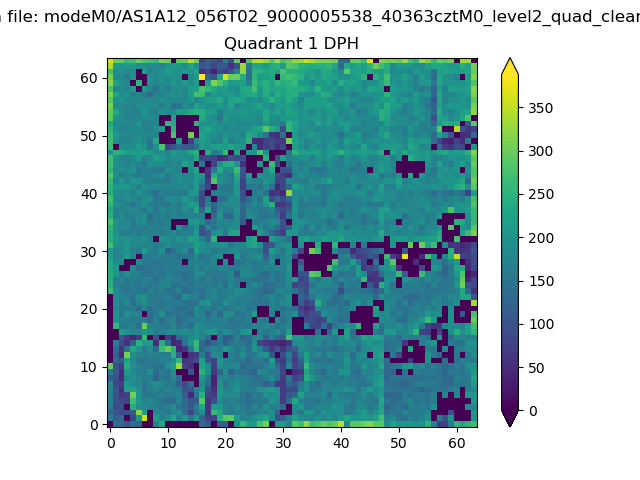 |
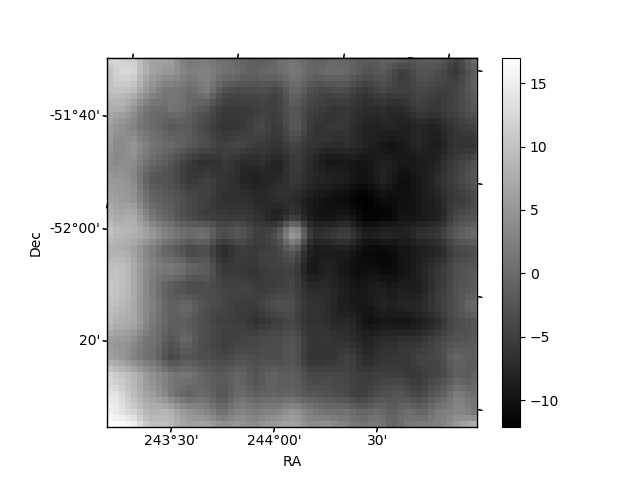
Quadrant B |
|---|---|---|---|
| Quadrant D | 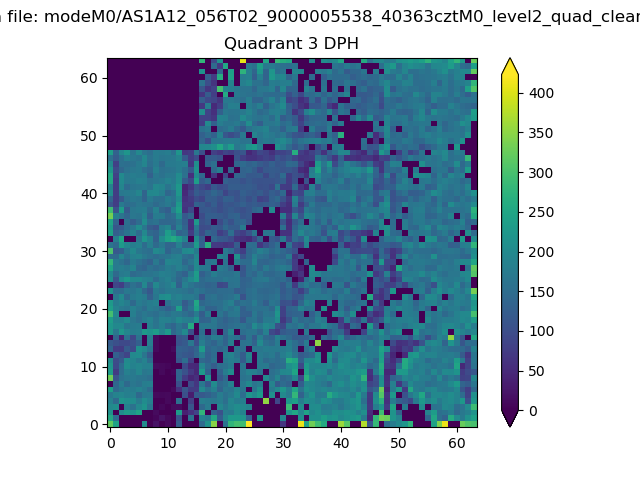 |
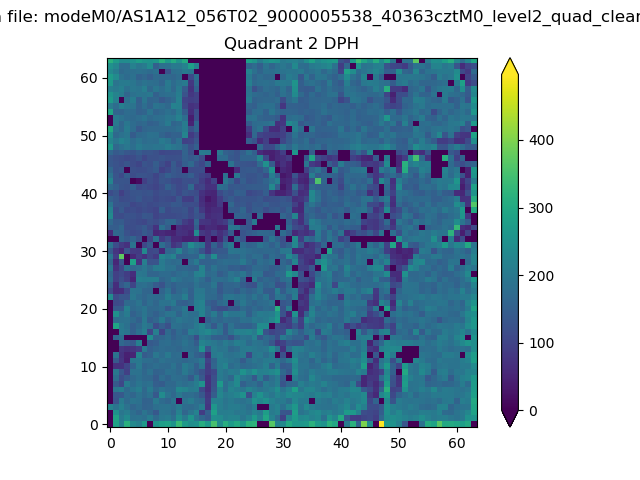 |
Quadrant C |
| Plot type | Count rate plots | Images |
|---|---|---|
| Comparison with Poisson distribution Blue bars denote a histogram of data divided into 1 sec bins. Red curve is a Poisson curve with rate = median count rate of data. |
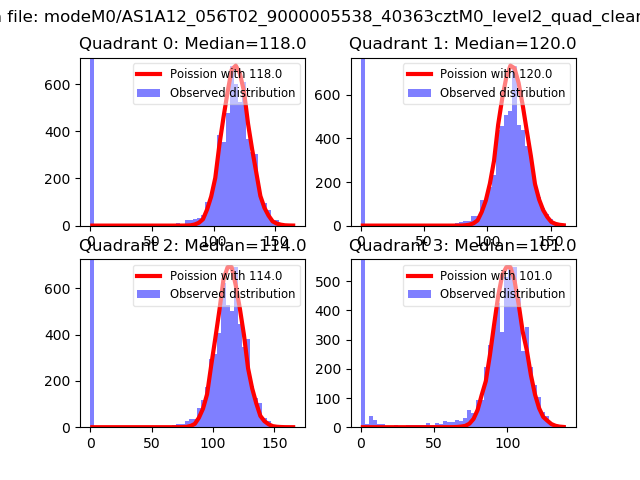 |
 |
| Quadrant-wise count rates Data is divided into 100 sec bins |
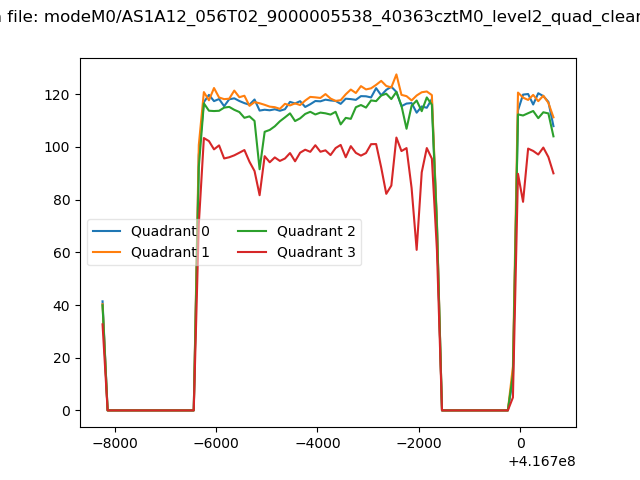 |
|
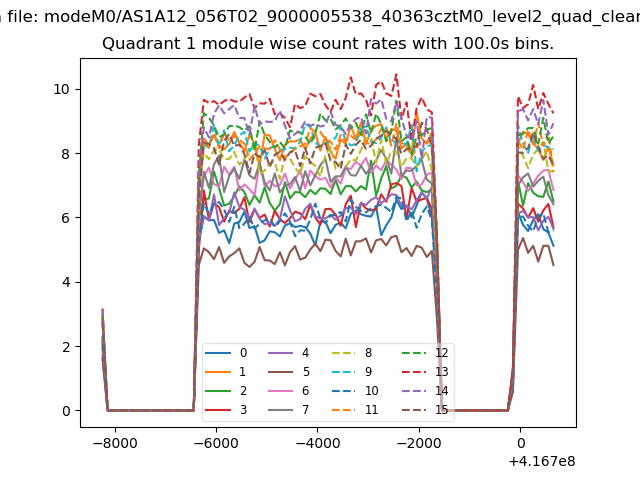
| Module-wise count rates for Quadrant A Data is divided into 100 sec bins |
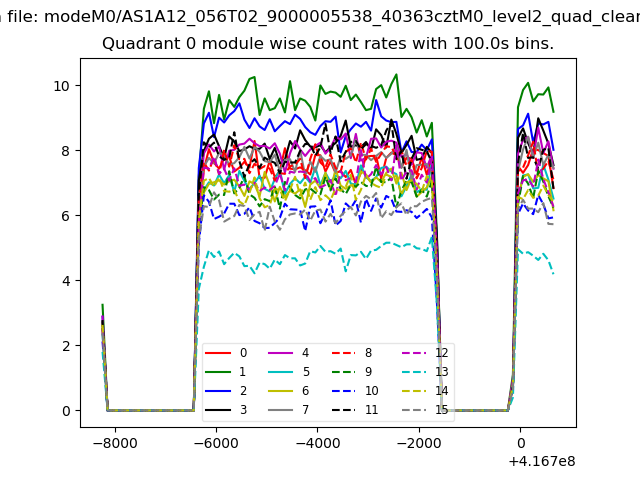 |
 |
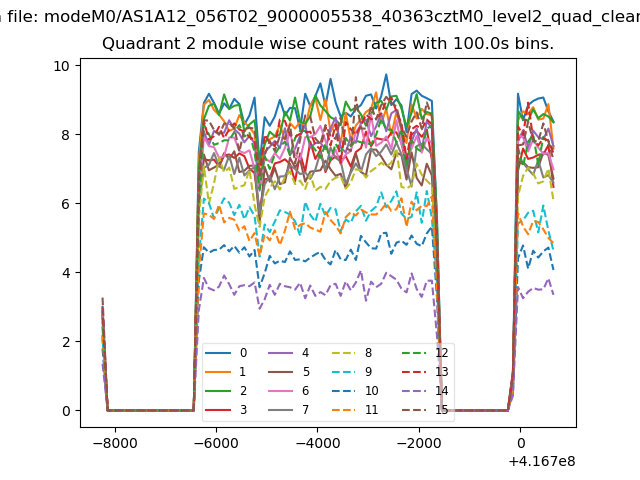
| Module-wise count rates for Quadrant B Data is divided into 100 sec bins |
 |
 |
| Module-wise count rates for Quadrant C Data is divided into 100 sec bins |
 |
 |
| Module-wise count rates for Quadrant D Data is divided into 100 sec bins |
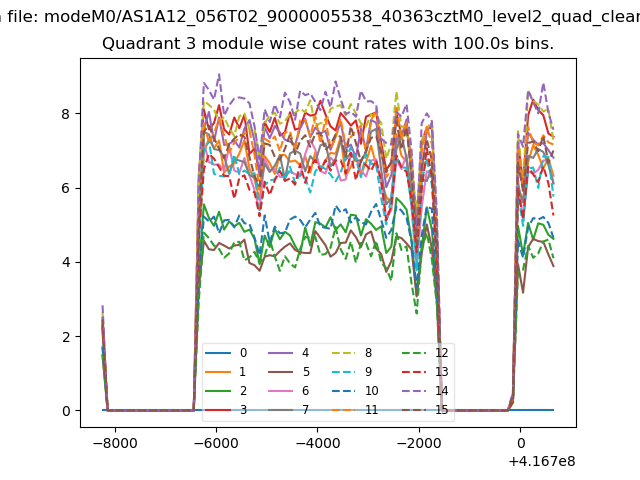 |
 |
| Parameter | Plot |
|---|---|
| CZT HV Monitor | 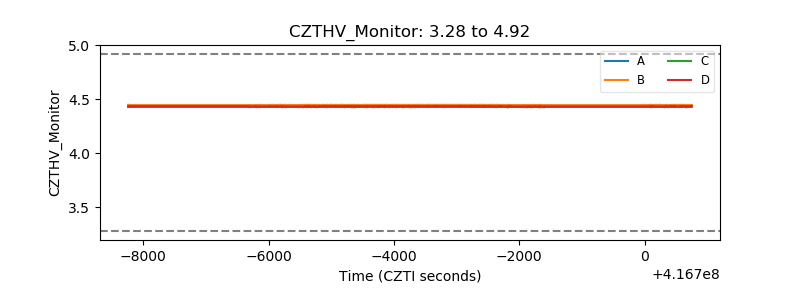 |
| D_VDD | 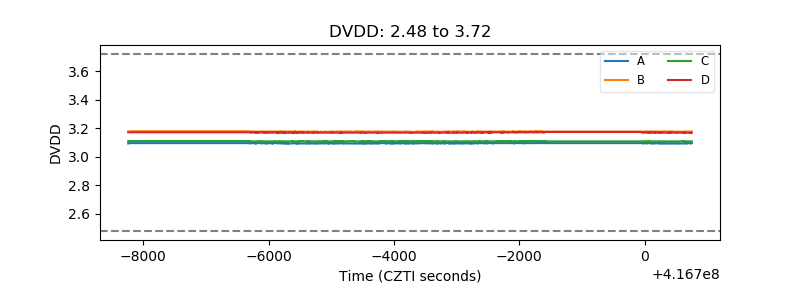 |
| Temperature 1 | 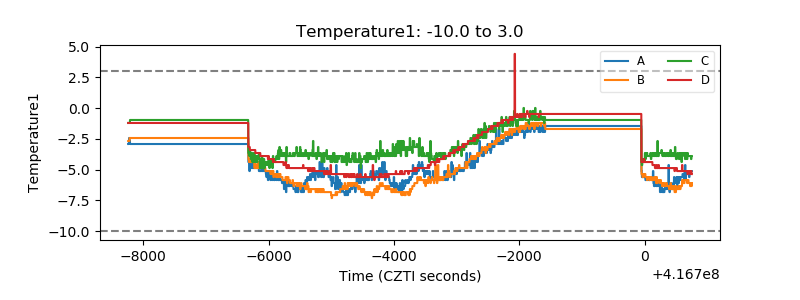 |
| Veto HV Monitor | 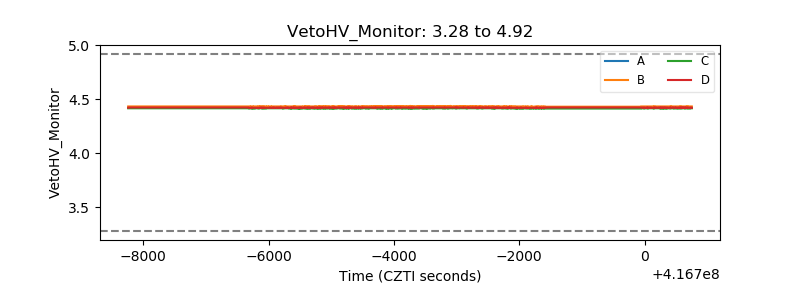 |
| Veto LLD | 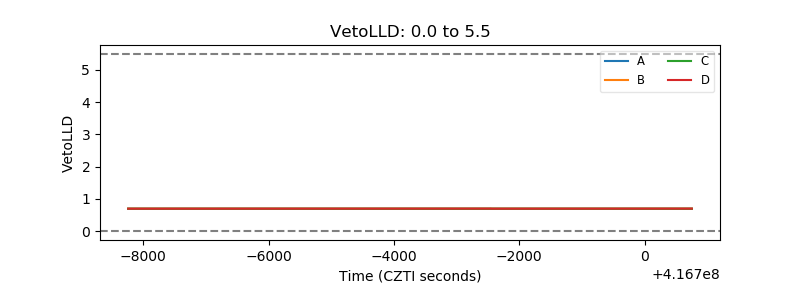 |
| Alpha Counter | 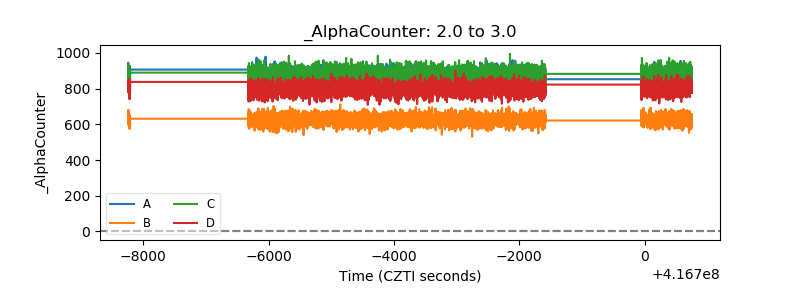 |
| _CPM_Rate | 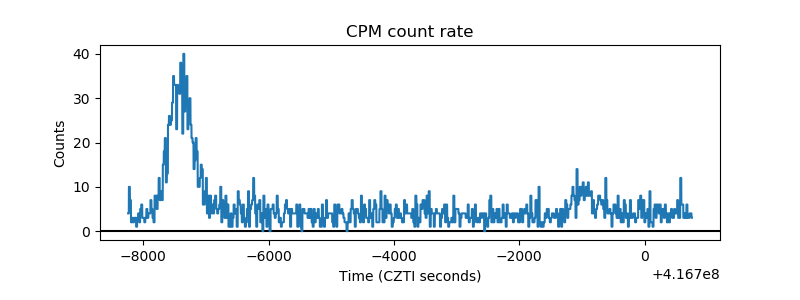 |
| CZT Counter | 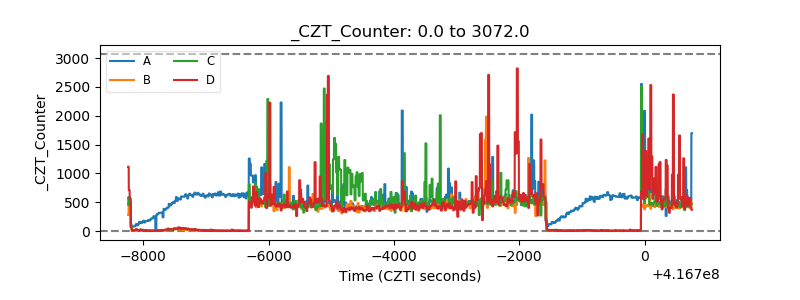 |
| +2.5 Volts monitor | 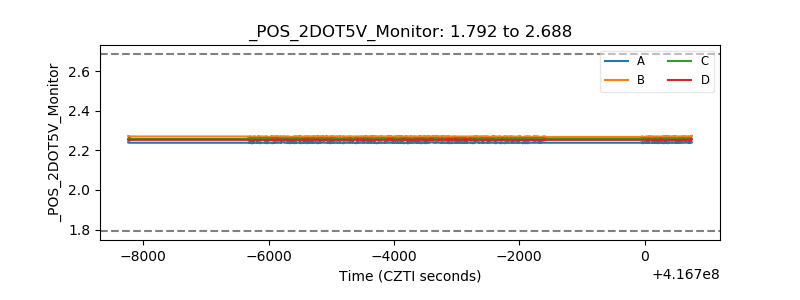 |
| +5 Volts monitor |  |
| _ROLL_ROT | 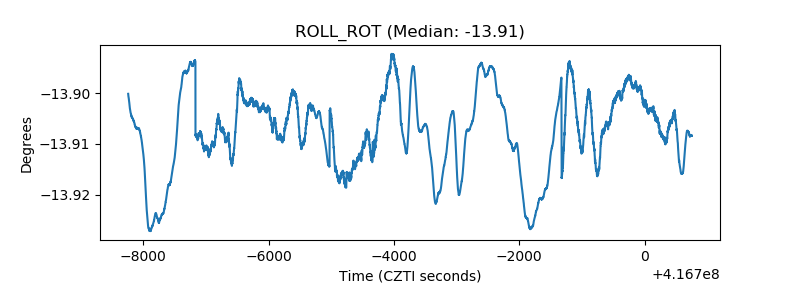 |
| _Roll_DEC | 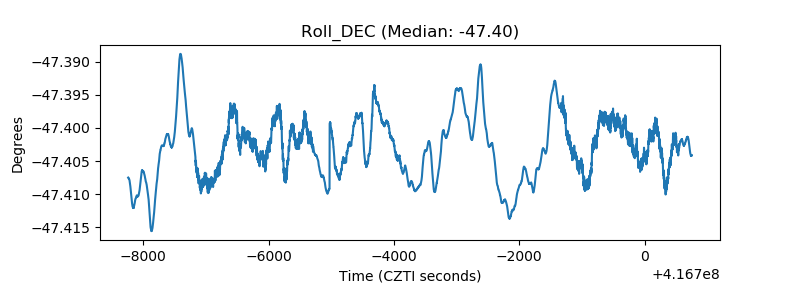 |
| _Roll_RA | 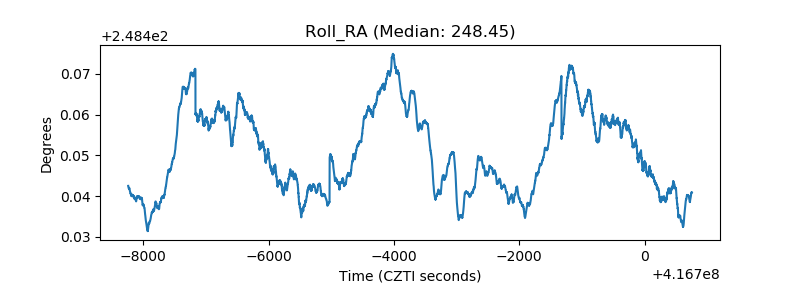 |
| Veto Counter | 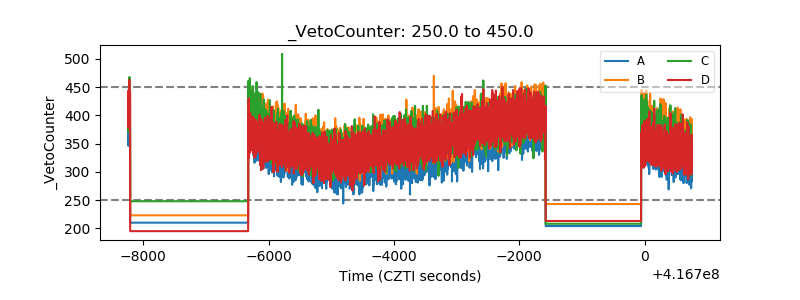 |