| Param | Original file | Final file |
|---|---|---|
| Filename | modeM0/AS1A12_056T02_9000005538_40364cztM0_level2.fits | modeM0/AS1A12_056T02_9000005538_40364cztM0_level2_quad_clean.evt |
| Size (bytes) | 393,252,480 | 94,999,680 |
| Size | 375.0 MB | 90.6 MB |
| Events in quadrant A | 3,810,275 | 657,455 |
| Events in quadrant B | 2,641,062 | 674,762 |
| Events in quadrant C | 3,007,841 | 637,700 |
| Events in quadrant D | 4,648,733 | 503,388 |
| Mode M0 | |||
|---|---|---|---|
| Quadrant | BADHDUFLAG | Total packets | Discarded packets |
| A | 0 | 15066 | 3 |
| B | 0 | 11811 | 2 |
| C | 0 | 12556 | 2 |
| D | 0 | 17812 | 2 |
| Mode M9 | |||
|---|---|---|---|
| Quadrant | BADHDUFLAG | Total packets | Discarded packets |
| A | 0 | 27 | 0 |
| B | 0 | 27 | 0 |
| C | 0 | 27 | 0 |
| D | 0 | 27 | 0 |
| Mode SS | |||
|---|---|---|---|
| Quadrant | BADHDUFLAG | Total packets | Discarded packets |
| A | 0 | 118 | 0 |
| B | 0 | 118 | 0 |
| C | 0 | 118 | 0 |
| D | 0 | 118 | 0 |
| Quadrant | Total seconds | Saturated seconds | Saturation percentage |
|---|---|---|---|
| A | 5766 | 85 | 1.474159% |
| B | 5766 | 8 | 0.138744% |
| C | 5766 | 73 | 1.266042% |
| D | 5766 | 944 | 16.371835% |
Noise dominated data is calculated using 1-second bins in cleaned event files. If a bin has >2000 counts, and if more than 50% of those come from <1% of pixels, then it is considered to be noise-dominated and hence unusable.
| Quadrant | # 1 sec bins | Bins with >0 counts | Bins with >2000 counts | High rate bins dominated by noise | Noise dominated (total time) | Noise dominated (detector-on time) | Marked lightcurve |
|---|---|---|---|---|---|---|---|
| A | 7080 | 5767 | 67 | 67 | 0.95% | 1.16% | 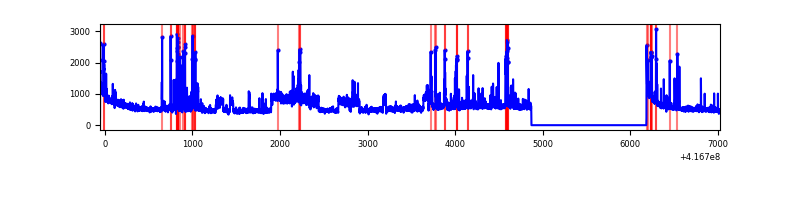 |
| B | 7080 | 5767 | 2 | 2 | 0.03% | 0.03% | 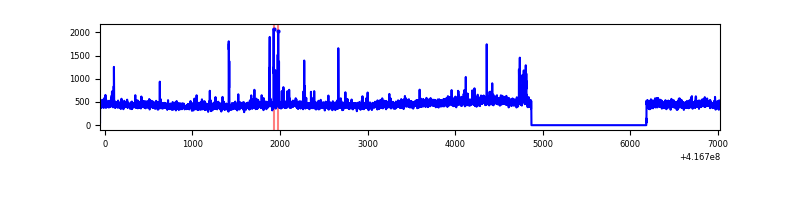 |
| C | 7080 | 5767 | 68 | 68 | 0.96% | 1.18% | 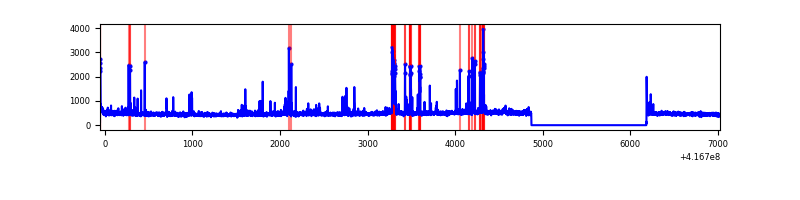 |
| D | 7080 | 5767 | 396 | 396 | 5.59% | 6.87% | 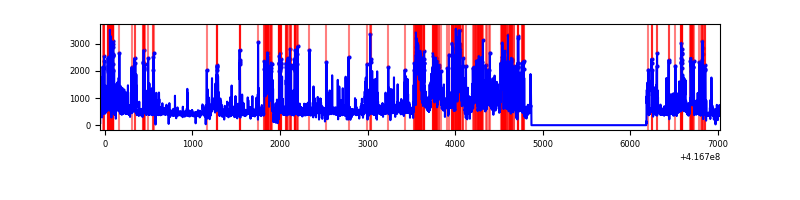 |
Top three noisy pixels from each quadrant. If the there are fewer than three noisy pixels in the level2.evt file, extra rows are filled as -1
| Pixel properties | Quadrant properties | ||||||
|---|---|---|---|---|---|---|---|
| Quadrant | DetID | PixID | Counts | Sigma | Mean | Median | Sigma |
| A | 10 | 83 | 497856 | 3829.05 | 631 | 620 | 129.9 |
| A | 6 | 10 | 427190 | 3284.88 | 631 | 620 | 129.9 |
| A | 13 | 248 | 314825 | 2419.59 | 631 | 620 | 129.9 |
| B | 4 | 170 | 40898 | 328.01 | 633 | 616 | 122.8 |
| B | 0 | 230 | 38143 | 305.57 | 633 | 616 | 122.8 |
| B | 5 | 255 | 33044 | 264.05 | 633 | 616 | 122.8 |
| C | 14 | 254 | 329414 | 2270.17 | 618 | 623 | 144.8 |
| C | 15 | 214 | 242546 | 1670.38 | 618 | 623 | 144.8 |
| C | 0 | 10 | 22282 | 149.54 | 618 | 623 | 144.8 |
| D | 12 | 227 | 1715576 | 12095.7 | 570 | 556 | 141.8 |
| D | 13 | 171 | 181357 | 1275.15 | 570 | 556 | 141.8 |
| D | 12 | 191 | 149474 | 1050.29 | 570 | 556 | 141.8 |
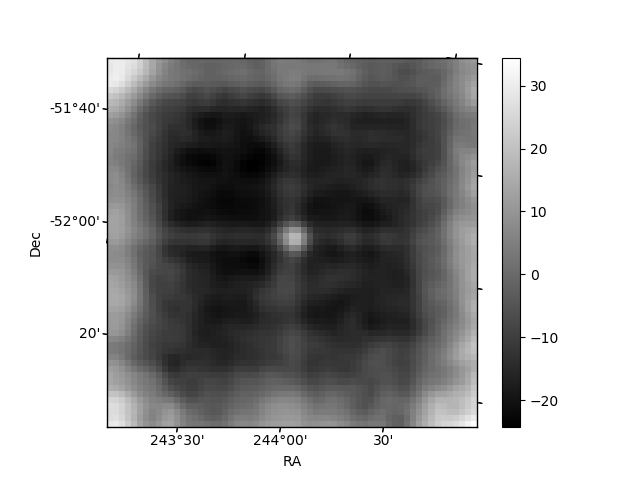
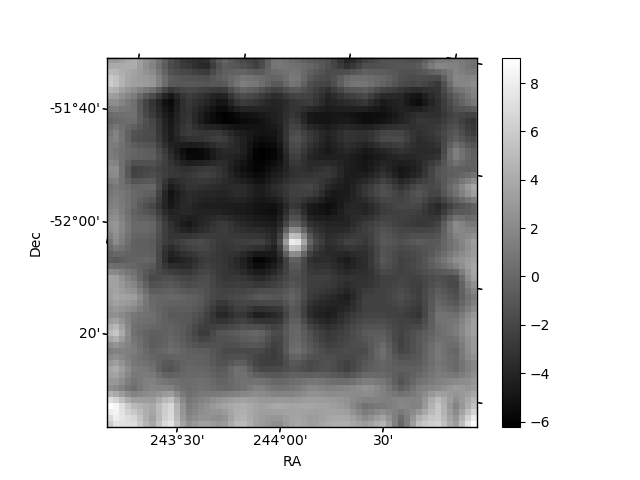
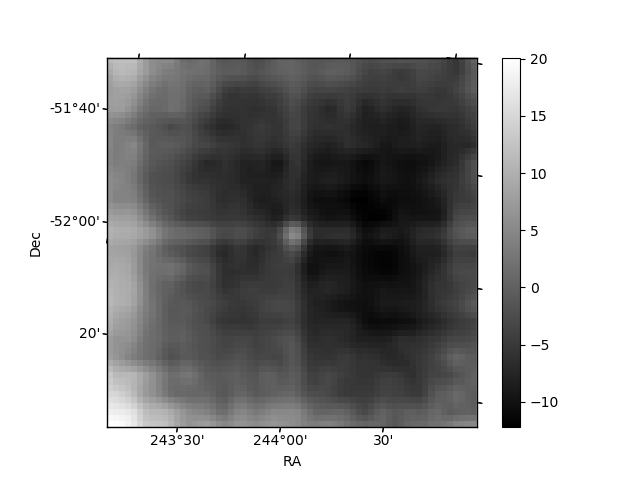
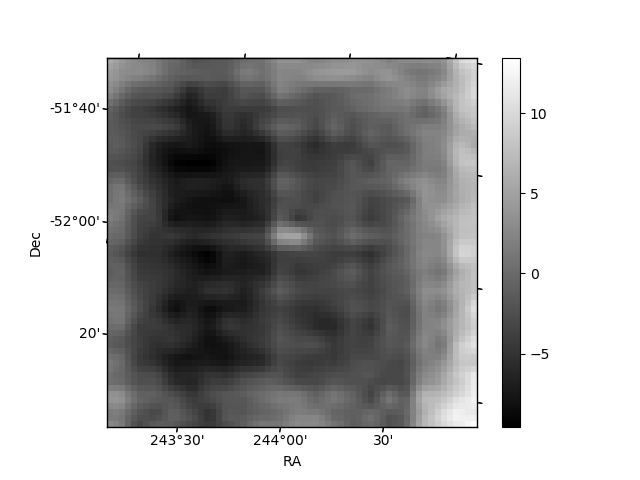
Histogram calculated using DETX and DETY for each event in the final _common_clean file
| Quadrant A | 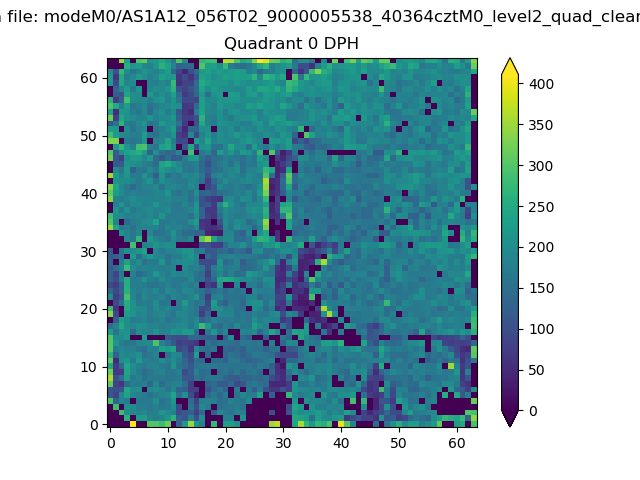 |
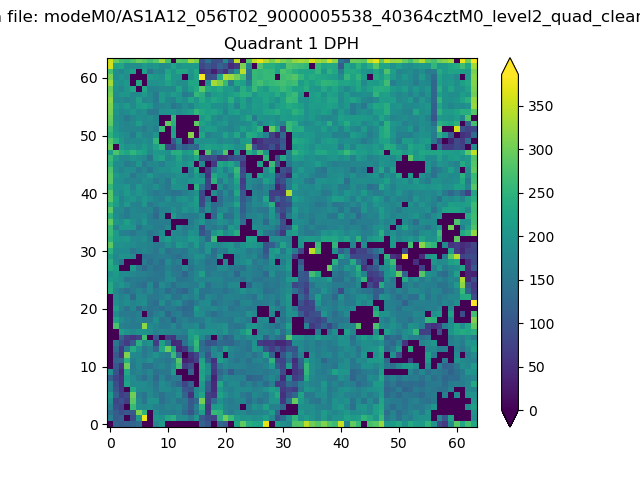 |
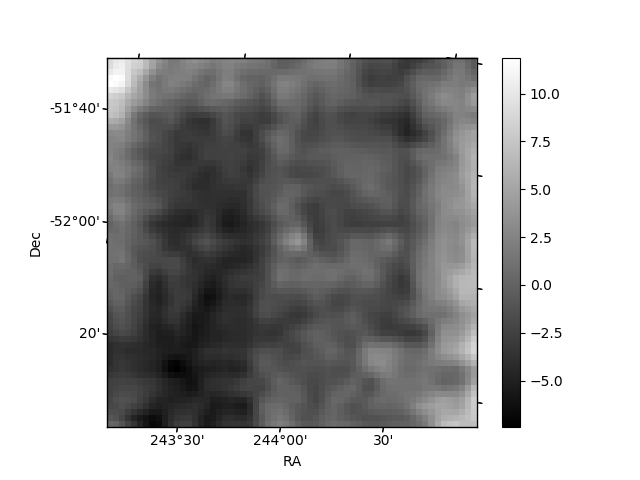
Quadrant B |
|---|---|---|---|
| Quadrant D | 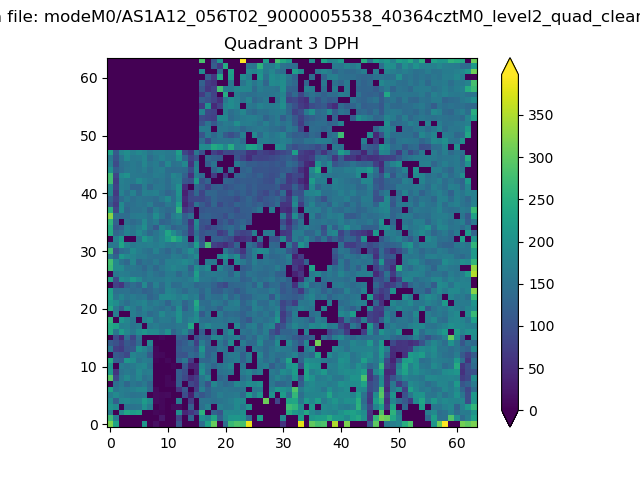 |
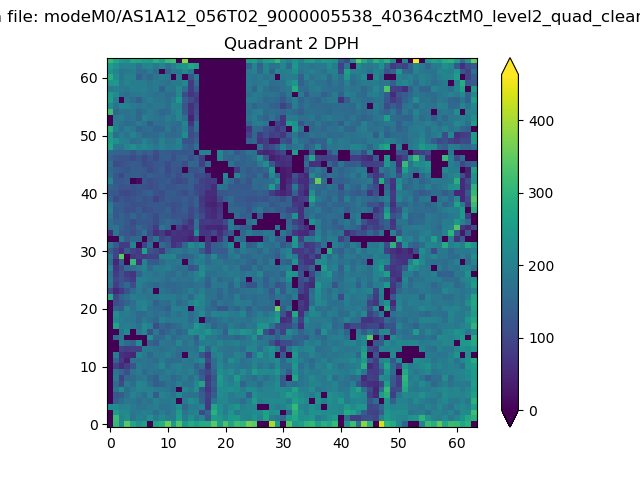 |
Quadrant C |
| Plot type | Count rate plots | Images |
|---|---|---|
| Comparison with Poisson distribution Blue bars denote a histogram of data divided into 1 sec bins. Red curve is a Poisson curve with rate = median count rate of data. |
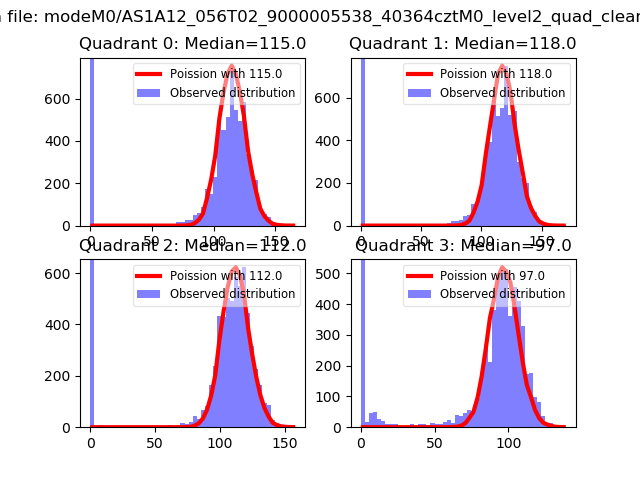 |
 |
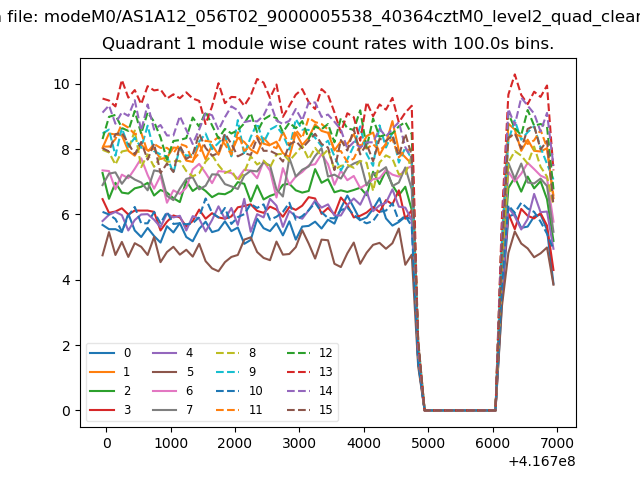
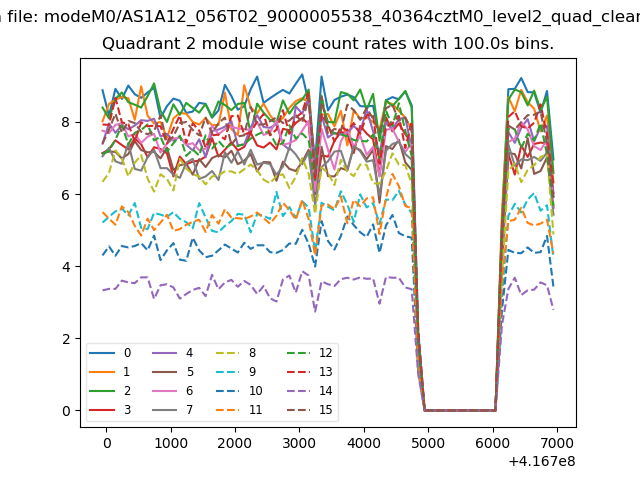
| Quadrant-wise count rates Data is divided into 100 sec bins |
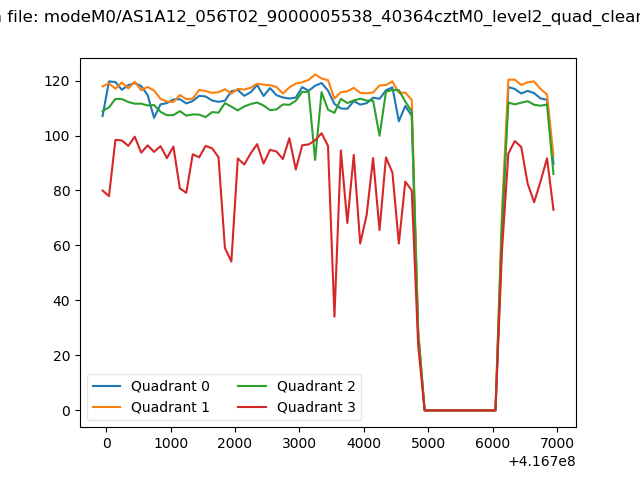 |
|
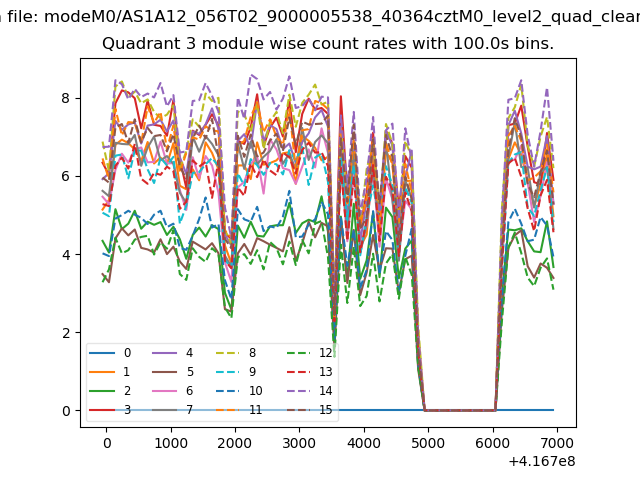
| Module-wise count rates for Quadrant A Data is divided into 100 sec bins |
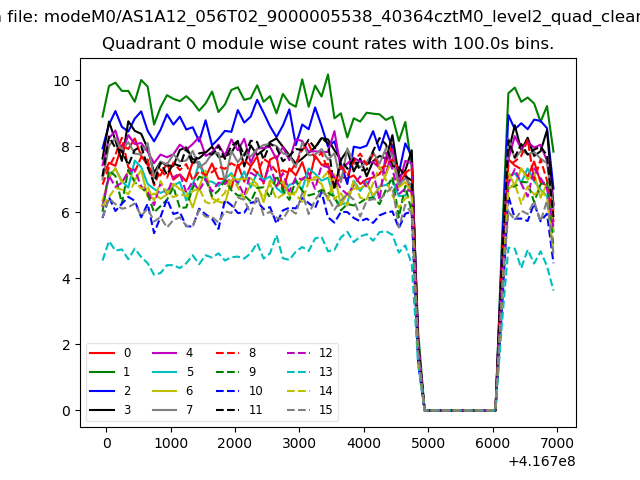 |
 |
| Module-wise count rates for Quadrant B Data is divided into 100 sec bins |
 |
 |
| Module-wise count rates for Quadrant C Data is divided into 100 sec bins |
 |
 |
| Module-wise count rates for Quadrant D Data is divided into 100 sec bins |
 |
 |
| Parameter | Plot |
|---|---|
| CZT HV Monitor | 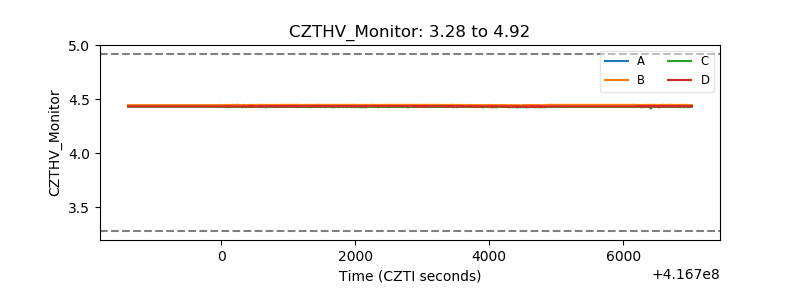 |
| D_VDD | 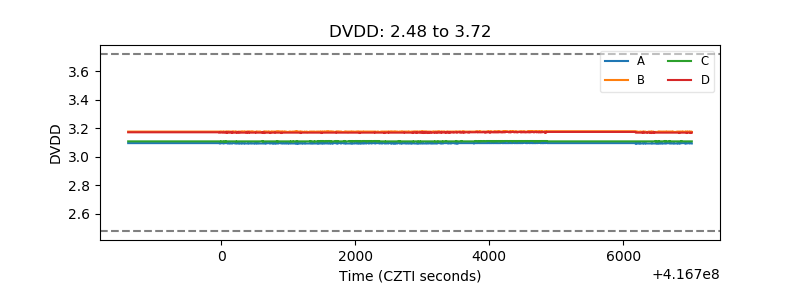 |
| Temperature 1 | 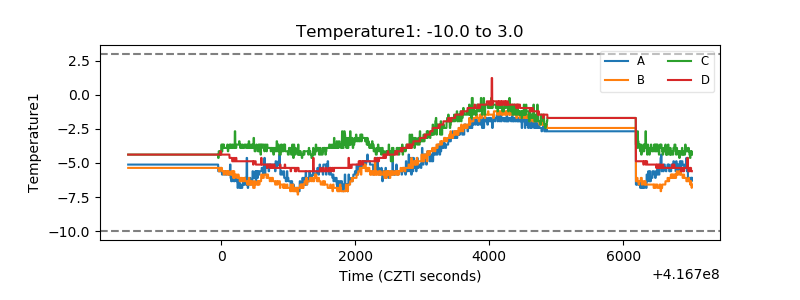 |
| Veto HV Monitor | 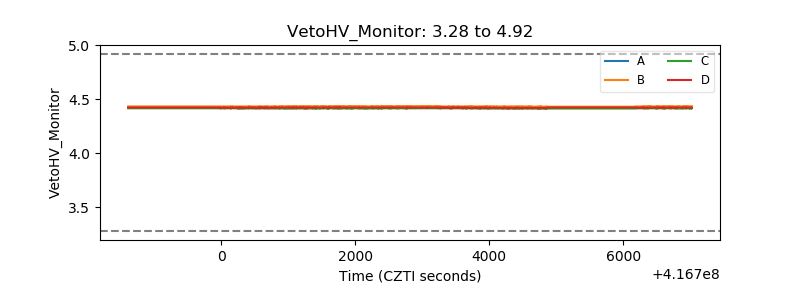 |
| Veto LLD | 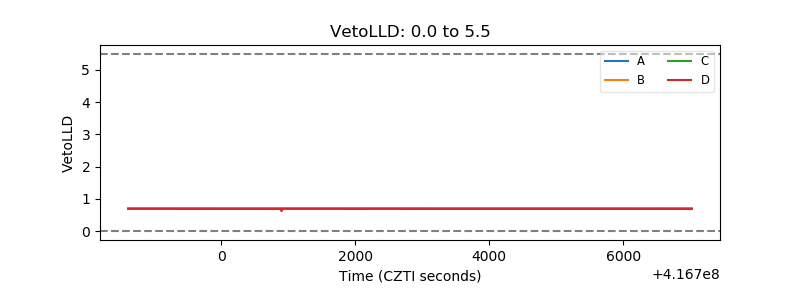 |
| Alpha Counter | 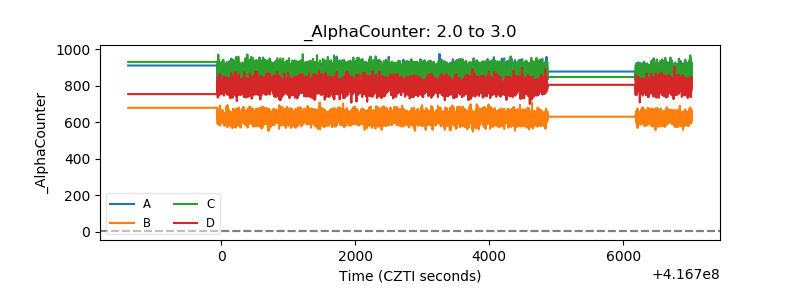 |
| _CPM_Rate | 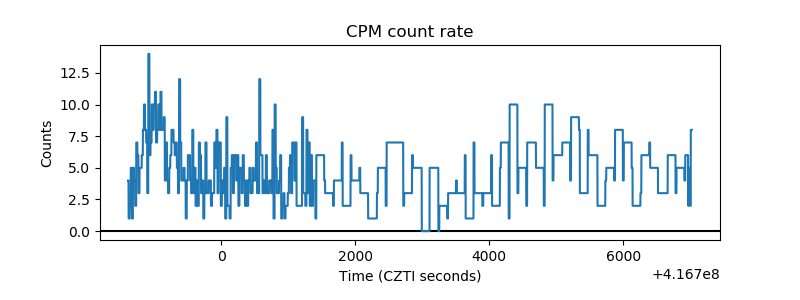 |
| CZT Counter | 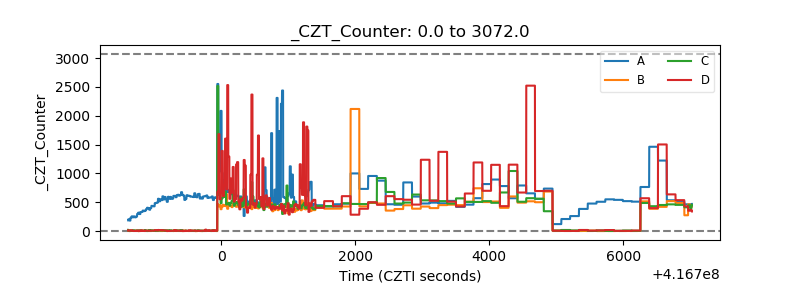 |
| +2.5 Volts monitor | 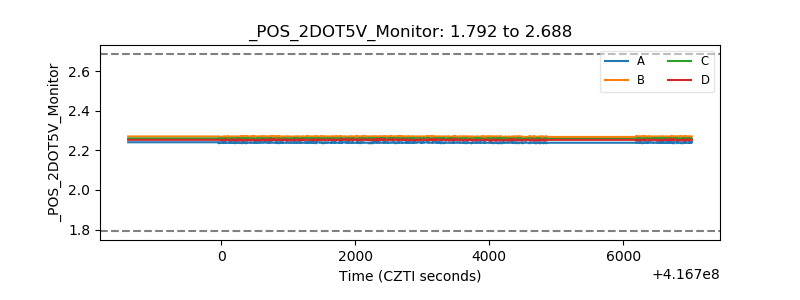 |
| +5 Volts monitor | 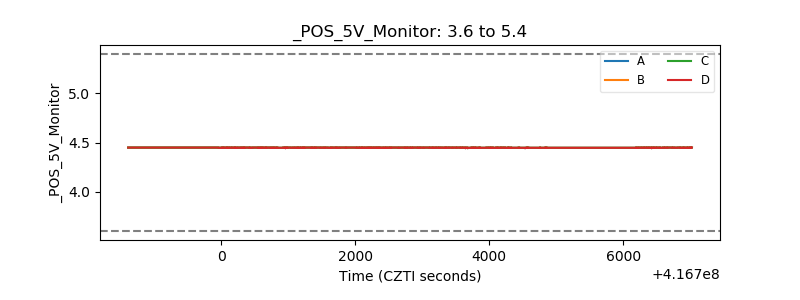 |
| _ROLL_ROT |  |
| _Roll_DEC | 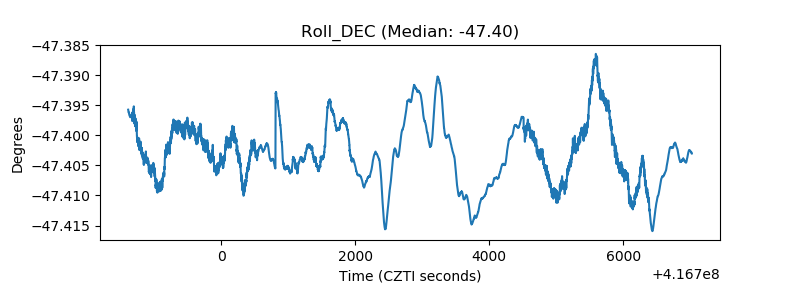 |
| _Roll_RA | 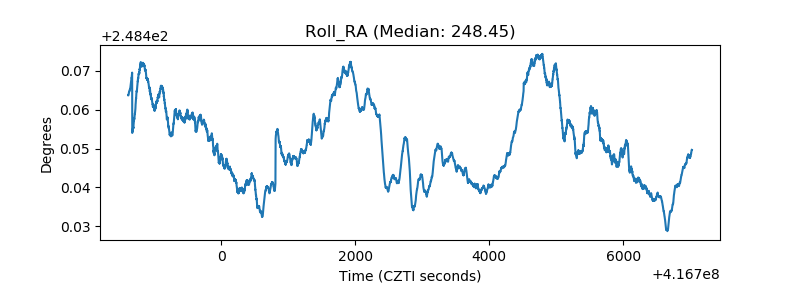 |
| Veto Counter | 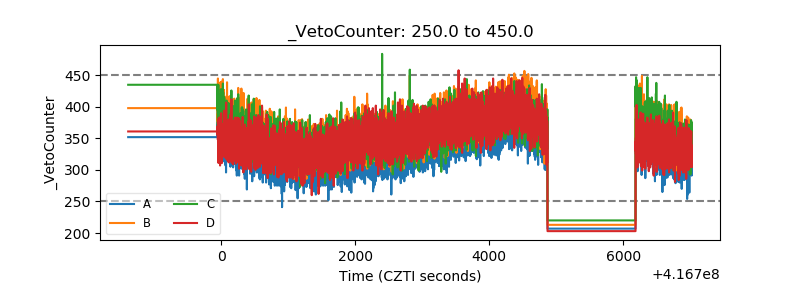 |