| Param | Original file | Final file |
|---|---|---|
| Filename | modeM0/AS1A12_056T02_9000005538_40371cztM0_level2.fits | modeM0/AS1A12_056T02_9000005538_40371cztM0_level2_quad_clean.evt |
| Size (bytes) | 1,941,177,600 | 457,430,400 |
| Size | 1.8 GB | 436.2 MB |
| Events in quadrant A | 17,398,690 | 3,095,863 |
| Events in quadrant B | 15,082,637 | 3,221,231 |
| Events in quadrant C | 16,995,723 | 3,069,576 |
| Events in quadrant D | 20,221,282 | 2,543,963 |
| Mode M0 | |||
|---|---|---|---|
| Quadrant | BADHDUFLAG | Total packets | Discarded packets |
| A | 0 | 70209 | 1407 |
| B | 0 | 64544 | 1464 |
| C | 0 | 69260 | 1155 |
| D | 0 | 80627 | 1752 |
| Mode M9 | |||
|---|---|---|---|
| Quadrant | BADHDUFLAG | Total packets | Discarded packets |
| A | 0 | 90 | 2 |
| B | 0 | 89 | 3 |
| C | 0 | 88 | 0 |
| D | 0 | 90 | 3 |
| Mode SS | |||
|---|---|---|---|
| Quadrant | BADHDUFLAG | Total packets | Discarded packets |
| A | 0 | 583 | 12 |
| B | 0 | 583 | 9 |
| C | 0 | 584 | 13 |
| D | 0 | 581 | 14 |
| Quadrant | Total seconds | Saturated seconds | Saturation percentage |
|---|---|---|---|
| A | 27909 | 715 | 2.561898% |
| B | 27904 | 170 | 0.609232% |
| C | 27916 | 516 | 1.848402% |
| D | 27875 | 3459 | 12.408969% |
Noise dominated data is calculated using 1-second bins in cleaned event files. If a bin has >2000 counts, and if more than 50% of those come from <1% of pixels, then it is considered to be noise-dominated and hence unusable.
| Quadrant | # 1 sec bins | Bins with >0 counts | Bins with >2000 counts | High rate bins dominated by noise | Noise dominated (total time) | Noise dominated (detector-on time) | Marked lightcurve |
|---|---|---|---|---|---|---|---|
| A | 37281 | 28114 | 523 | 523 | 1.40% | 1.86% | 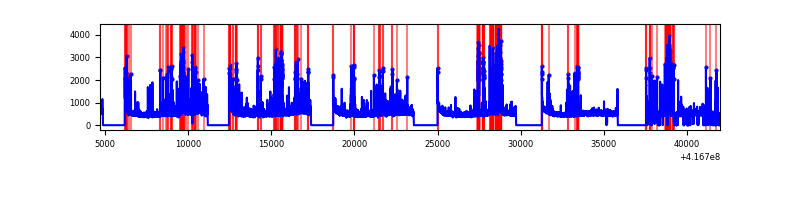 |
| B | 37276 | 28093 | 98 | 98 | 0.26% | 0.35% | 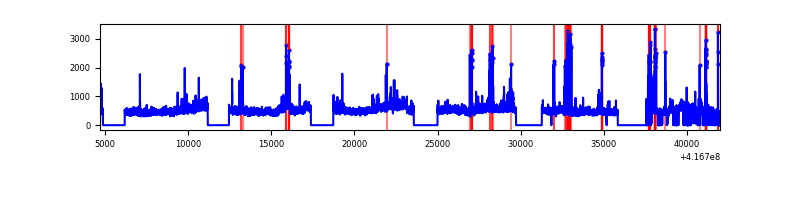 |
| C | 37279 | 28125 | 521 | 521 | 1.40% | 1.85% | 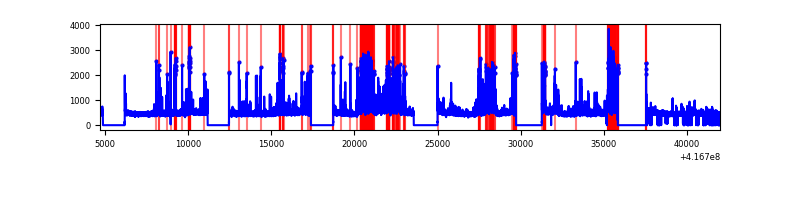 |
| D | 37264 | 28084 | 1136 | 1136 | 3.05% | 4.05% | 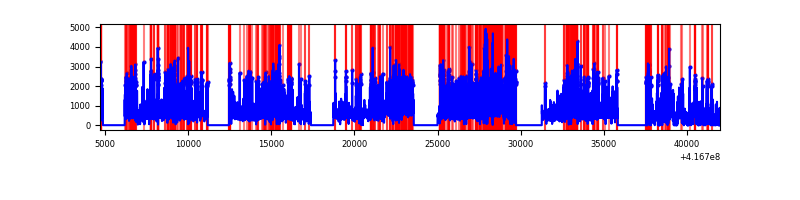 |
Top three noisy pixels from each quadrant. If the there are fewer than three noisy pixels in the level2.evt file, extra rows are filled as -1
| Pixel properties | Quadrant properties | ||||||
|---|---|---|---|---|---|---|---|
| Quadrant | DetID | PixID | Counts | Sigma | Mean | Median | Sigma |
| A | 13 | 248 | 2542070 | 4101.5 | 3071 | 3016 | 619.1 |
| A | 10 | 83 | 2161824 | 3487.27 | 3071 | 3016 | 619.1 |
| A | 6 | 10 | 440043 | 705.96 | 3071 | 3016 | 619.1 |
| B | 7 | 202 | 1865787 | 3170.27 | 3073 | 2993 | 587.6 |
| B | 5 | 255 | 496858 | 840.5 | 3073 | 2993 | 587.6 |
| B | 0 | 230 | 199402 | 334.27 | 3073 | 2993 | 587.6 |
| C | 14 | 254 | 3946433 | 5645.79 | 3016 | 3044 | 698.5 |
| C | 15 | 214 | 1175349 | 1678.4 | 3016 | 3044 | 698.5 |
| C | 0 | 10 | 58778 | 79.79 | 3016 | 3044 | 698.5 |
| D | 12 | 227 | 4507690 | 6441.06 | 2851 | 2777 | 699.4 |
| D | 2 | 250 | 1144942 | 1633.05 | 2851 | 2777 | 699.4 |
| D | 12 | 128 | 975181 | 1390.33 | 2851 | 2777 | 699.4 |
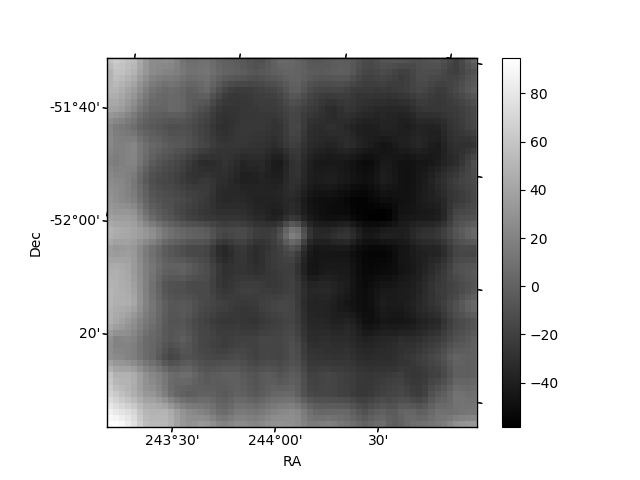
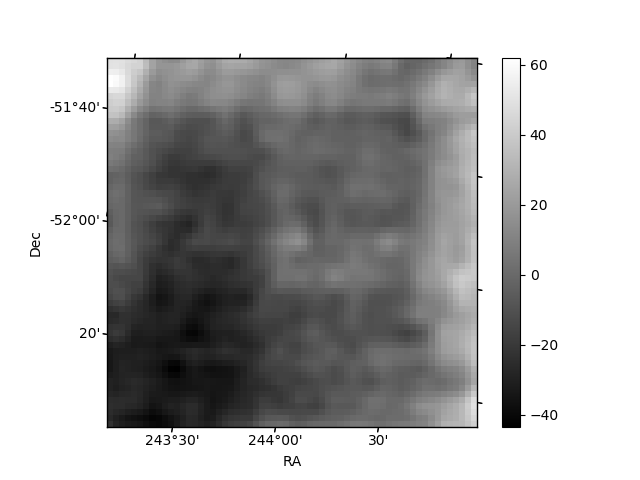
Histogram calculated using DETX and DETY for each event in the final _common_clean file
| Quadrant A | 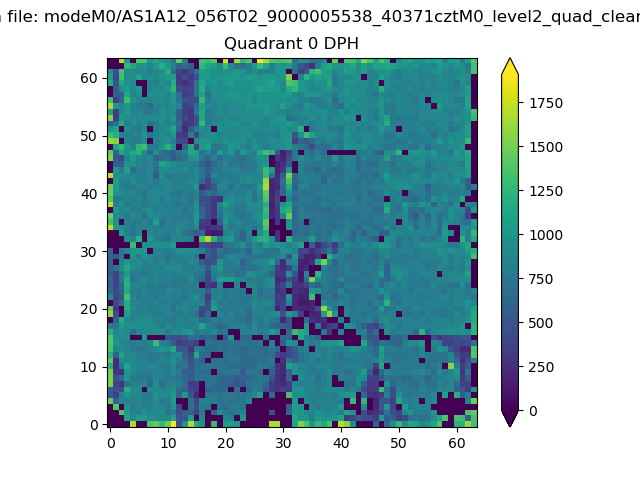 |
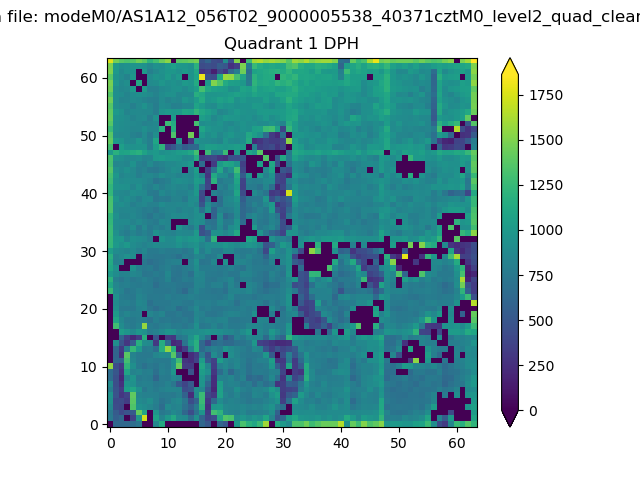 |
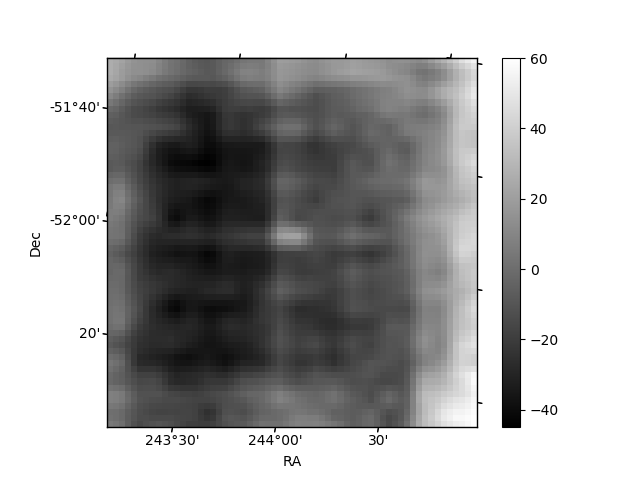
Quadrant B |
|---|---|---|---|
| Quadrant D | 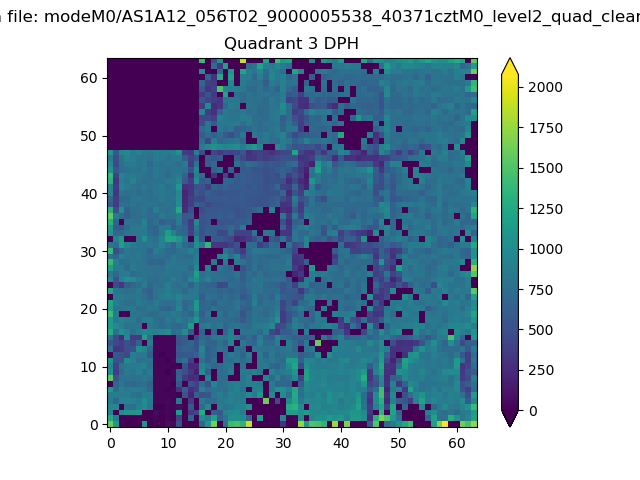 |
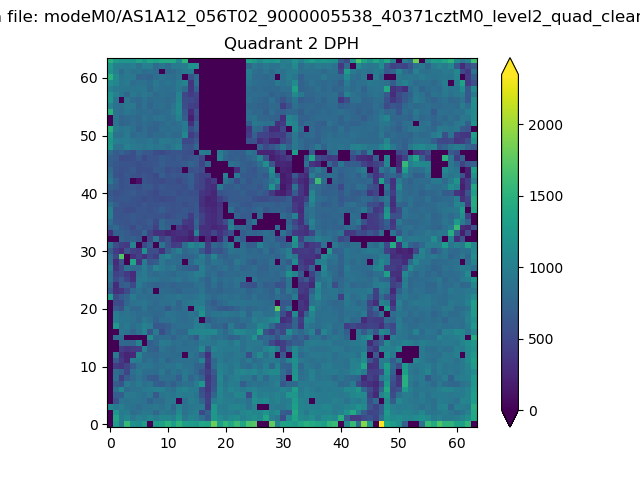 |
Quadrant C |
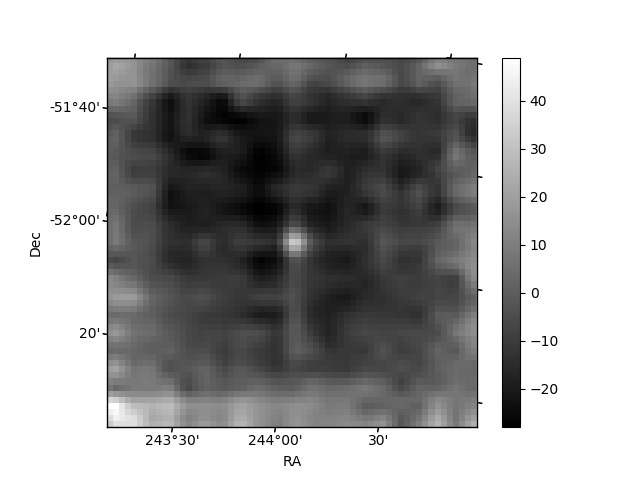
| Plot type | Count rate plots | Images |
|---|---|---|
| Comparison with Poisson distribution Blue bars denote a histogram of data divided into 1 sec bins. Red curve is a Poisson curve with rate = median count rate of data. |
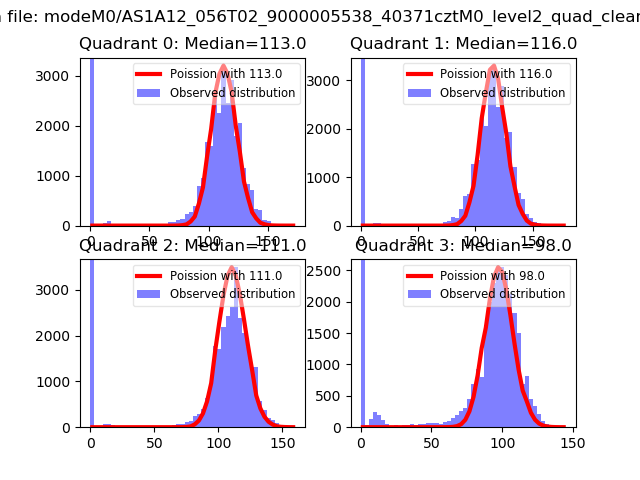 |
 |
| Quadrant-wise count rates Data is divided into 100 sec bins |
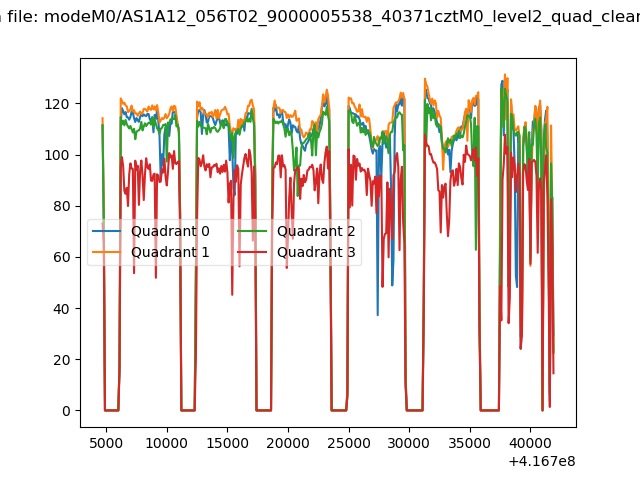 |
|
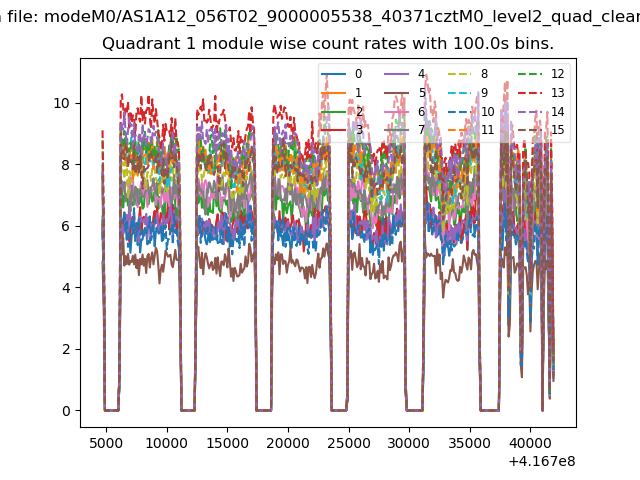
| Module-wise count rates for Quadrant A Data is divided into 100 sec bins |
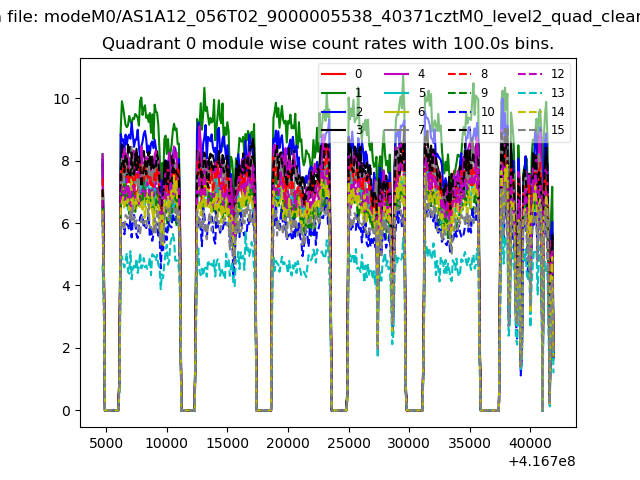 |
 |
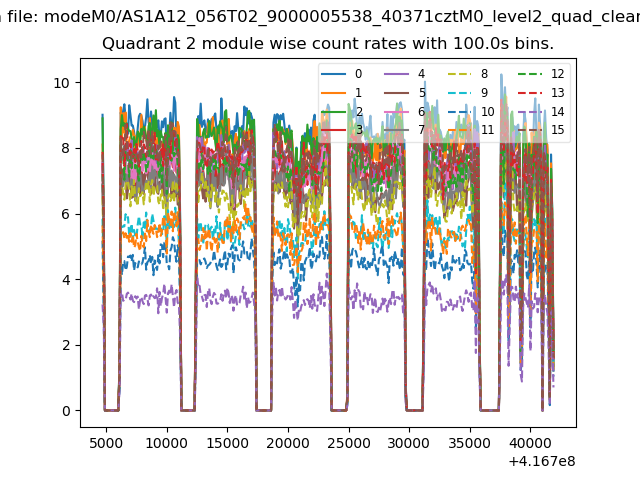
| Module-wise count rates for Quadrant B Data is divided into 100 sec bins |
 |
 |
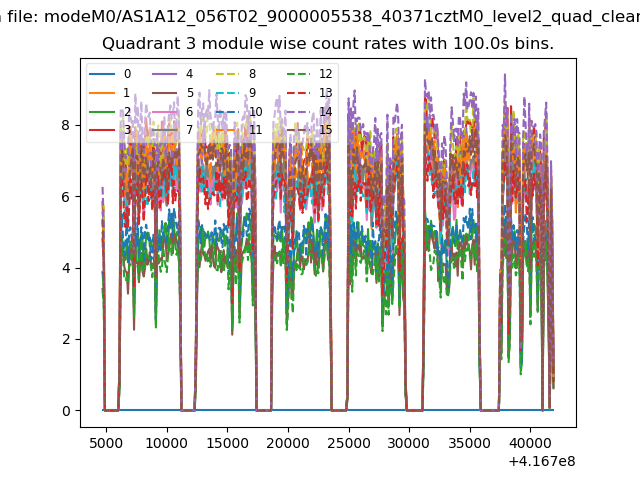
| Module-wise count rates for Quadrant C Data is divided into 100 sec bins |
 |
 |
| Module-wise count rates for Quadrant D Data is divided into 100 sec bins |
 |
 |
| Parameter | Plot |
|---|---|
| CZT HV Monitor | 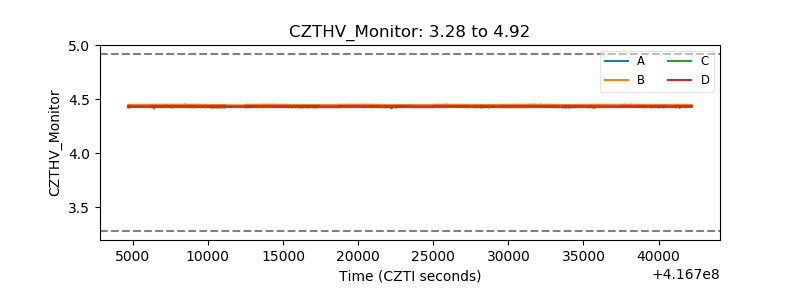 |
| D_VDD | 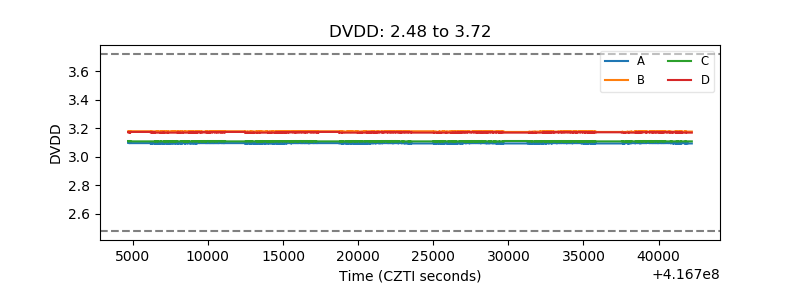 |
| Temperature 1 | 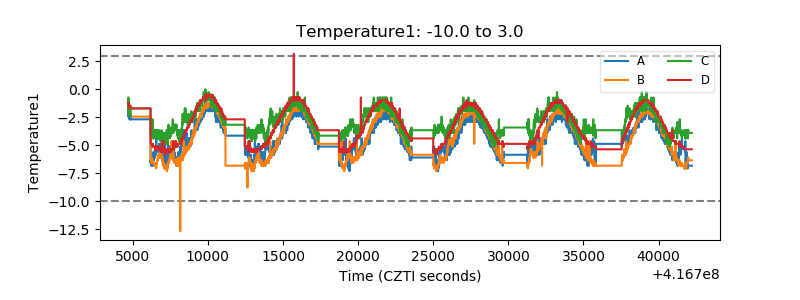 |
| Veto HV Monitor | 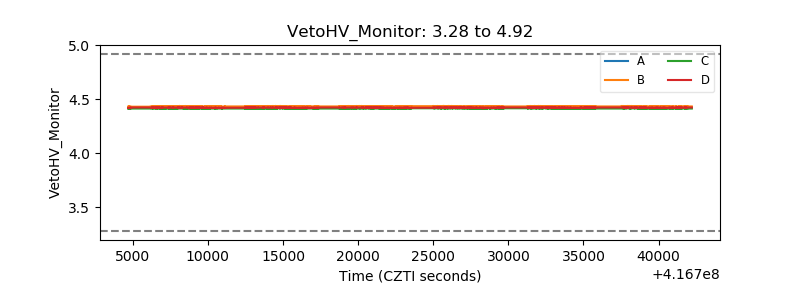 |
| Veto LLD | 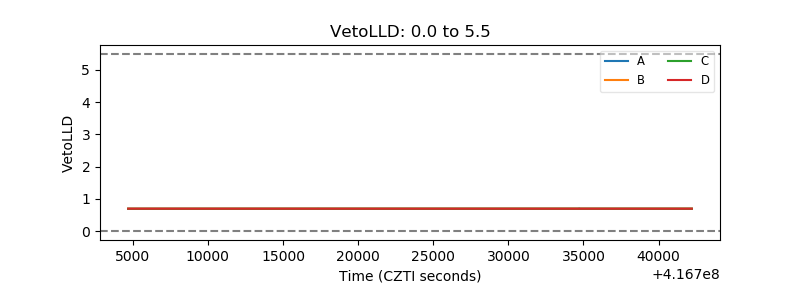 |
| Alpha Counter | 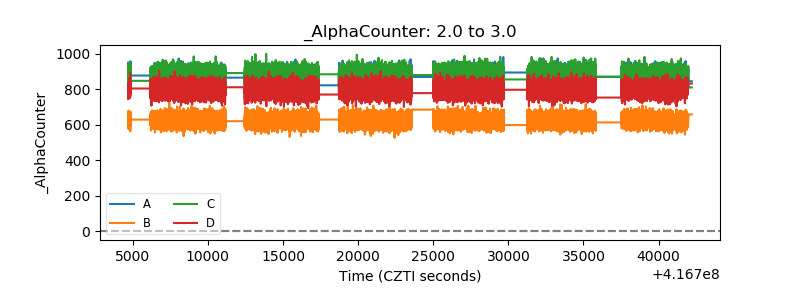 |
| _CPM_Rate | 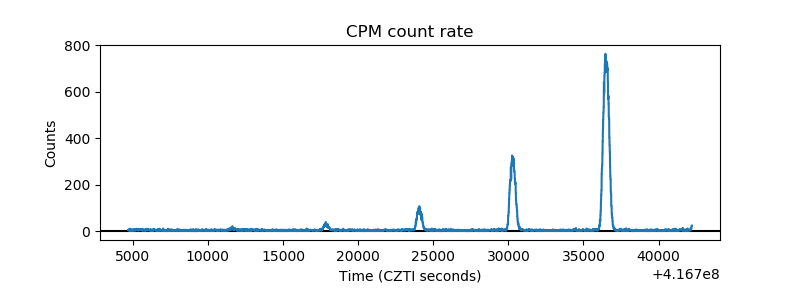 |
| CZT Counter | 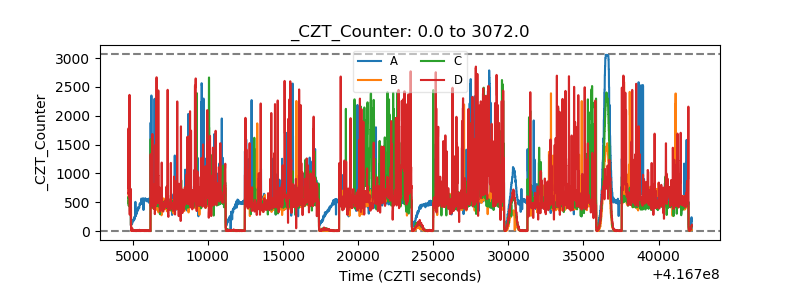 |
| +2.5 Volts monitor | 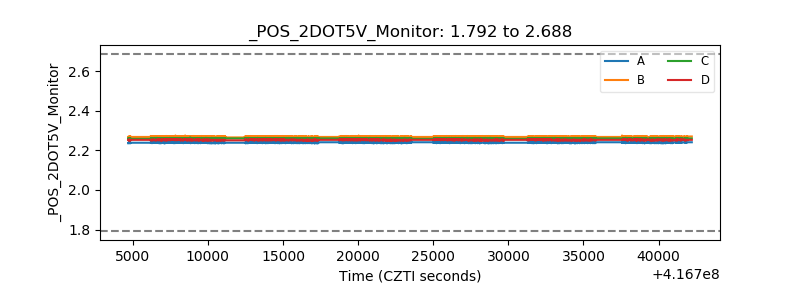 |
| +5 Volts monitor | 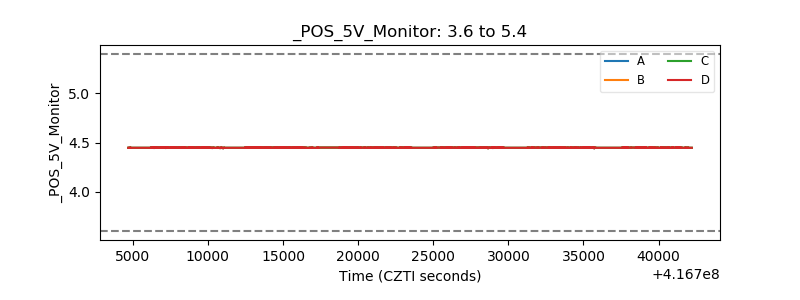 |
| _ROLL_ROT | 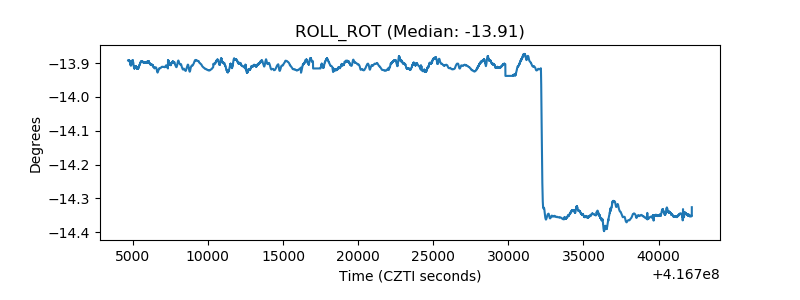 |
| _Roll_DEC | 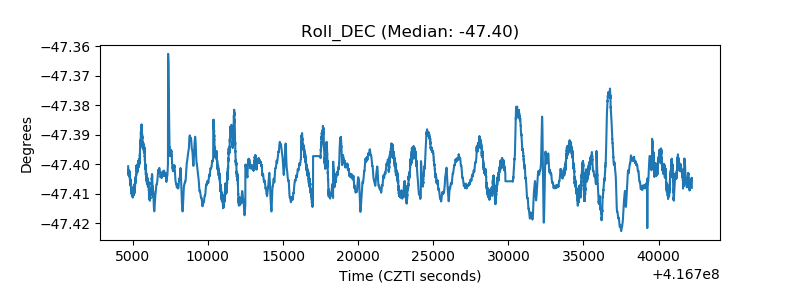 |
| _Roll_RA | 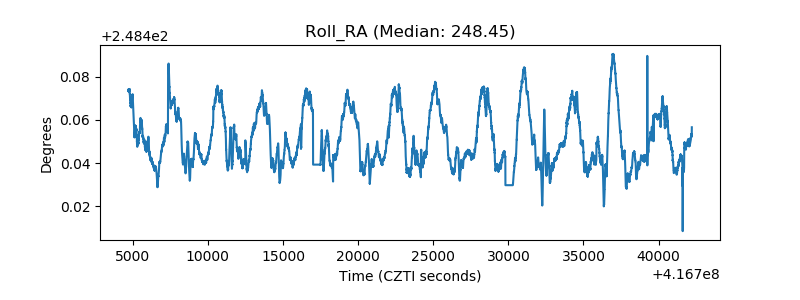 |
| Veto Counter | 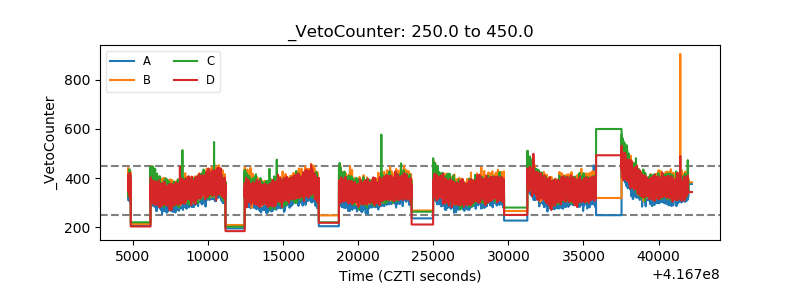 |