| Param | Original file | Final file |
|---|---|---|
| Filename | modeM0/AS1A12_056T02_9000005538_40372cztM0_level2.fits | modeM0/AS1A12_056T02_9000005538_40372cztM0_level2_quad_clean.evt |
| Size (bytes) | 425,773,440 | 105,108,480 |
| Size | 406.0 MB | 100.2 MB |
| Events in quadrant A | 3,800,422 | 731,776 |
| Events in quadrant B | 3,592,012 | 755,928 |
| Events in quadrant C | 2,982,087 | 718,269 |
| Events in quadrant D | 4,933,361 | 570,068 |
| Mode M0 | |||
|---|---|---|---|
| Quadrant | BADHDUFLAG | Total packets | Discarded packets |
| A | 0 | 14896 | 3 |
| B | 0 | 14954 | 2 |
| C | 0 | 12231 | 2 |
| D | 0 | 18588 | 2 |
| Mode M9 | |||
|---|---|---|---|
| Quadrant | BADHDUFLAG | Total packets | Discarded packets |
| A | 0 | 38 | 0 |
| B | 0 | 38 | 0 |
| C | 0 | 38 | 0 |
| D | 0 | 38 | 0 |
| Mode SS | |||
|---|---|---|---|
| Quadrant | BADHDUFLAG | Total packets | Discarded packets |
| A | 0 | 120 | 0 |
| B | 0 | 120 | 0 |
| C | 0 | 120 | 0 |
| D | 0 | 120 | 0 |
| Quadrant | Total seconds | Saturated seconds | Saturation percentage |
|---|---|---|---|
| A | 5821 | 122 | 2.095860% |
| B | 5821 | 32 | 0.549734% |
| C | 5821 | 22 | 0.377942% |
| D | 5821 | 958 | 16.457653% |
Noise dominated data is calculated using 1-second bins in cleaned event files. If a bin has >2000 counts, and if more than 50% of those come from <1% of pixels, then it is considered to be noise-dominated and hence unusable.
| Quadrant | # 1 sec bins | Bins with >0 counts | Bins with >2000 counts | High rate bins dominated by noise | Noise dominated (total time) | Noise dominated (detector-on time) | Marked lightcurve |
|---|---|---|---|---|---|---|---|
| A | 9616 | 5823 | 81 | 81 | 0.84% | 1.39% | 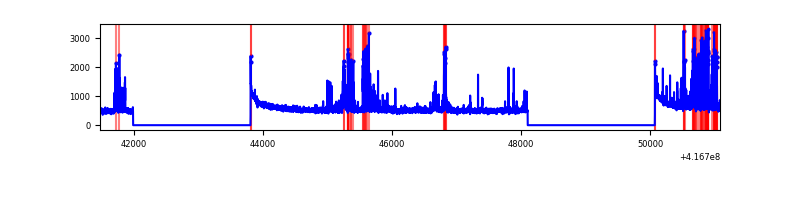 |
| B | 9616 | 5823 | 14 | 14 | 0.15% | 0.24% | 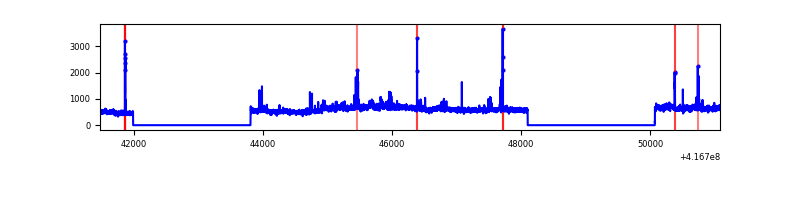 |
| C | 9616 | 5823 | 14 | 14 | 0.15% | 0.24% |  |
| D | 9616 | 5823 | 427 | 427 | 4.44% | 7.33% | 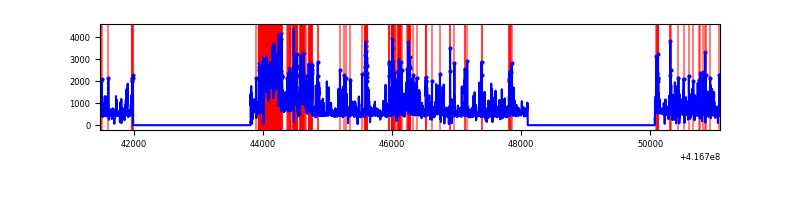 |
Top three noisy pixels from each quadrant. If the there are fewer than three noisy pixels in the level2.evt file, extra rows are filled as -1
| Pixel properties | Quadrant properties | ||||||
|---|---|---|---|---|---|---|---|
| Quadrant | DetID | PixID | Counts | Sigma | Mean | Median | Sigma |
| A | 13 | 248 | 565143 | 4072.18 | 689 | 679 | 138.6 |
| A | 10 | 83 | 503506 | 3627.52 | 689 | 679 | 138.6 |
| A | 2 | 79 | 34705 | 245.47 | 689 | 679 | 138.6 |
| B | 7 | 202 | 719359 | 5538.07 | 682 | 664 | 129.8 |
| B | 5 | 255 | 81235 | 620.86 | 682 | 664 | 129.8 |
| B | 0 | 245 | 33940 | 256.42 | 682 | 664 | 129.8 |
| C | 15 | 214 | 249941 | 1631.29 | 667 | 673 | 152.8 |
| C | 0 | 10 | 62420 | 404.09 | 667 | 673 | 152.8 |
| C | 14 | 254 | 55252 | 357.18 | 667 | 673 | 152.8 |
| D | 12 | 227 | 1760019 | 11544.8 | 620 | 602 | 152.4 |
| D | 2 | 250 | 293493 | 1921.87 | 620 | 602 | 152.4 |
| D | 13 | 171 | 210748 | 1378.92 | 620 | 602 | 152.4 |
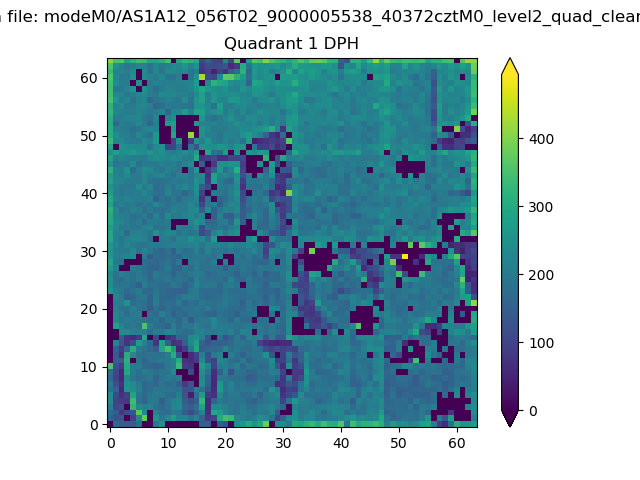
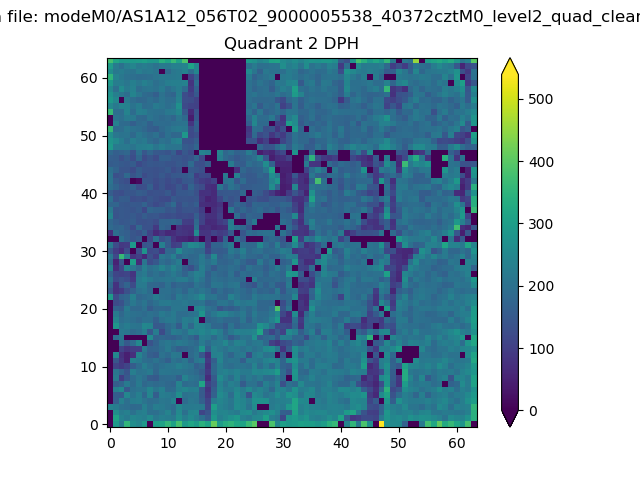
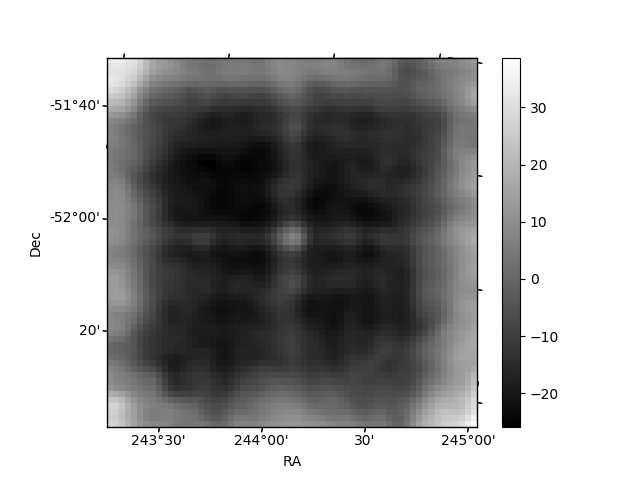
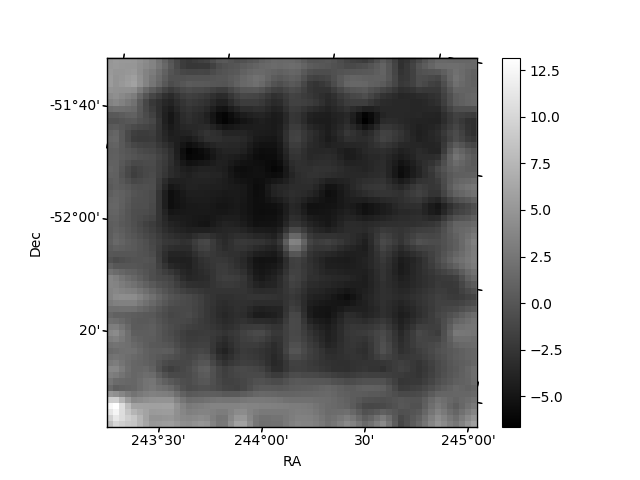
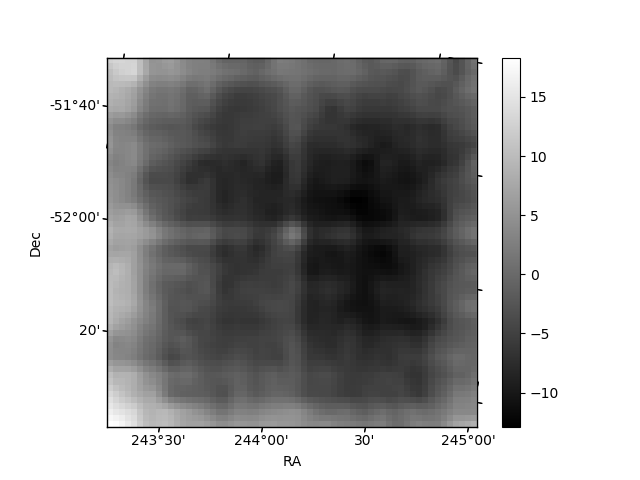
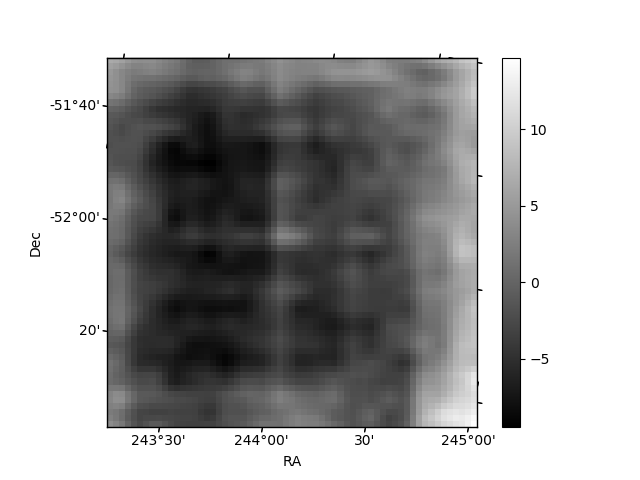
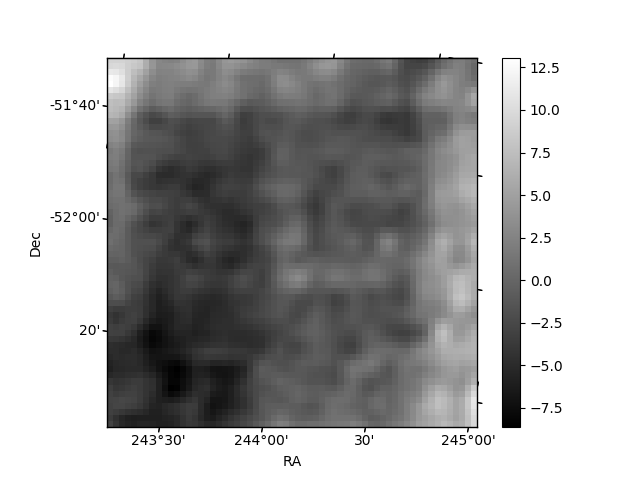
Histogram calculated using DETX and DETY for each event in the final _common_clean file
| Quadrant A | 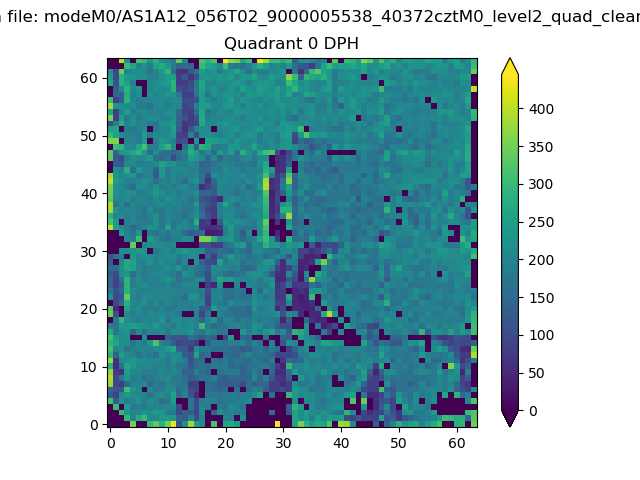 |
 |
Quadrant B |
|---|---|---|---|
| Quadrant D | 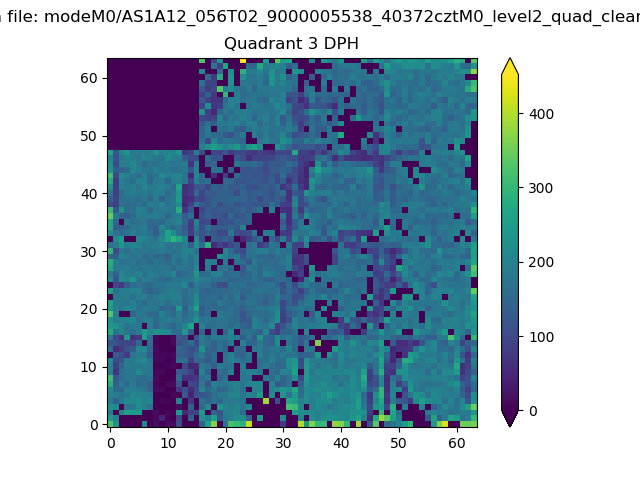 |
 |
Quadrant C |
| Plot type | Count rate plots | Images |
|---|---|---|
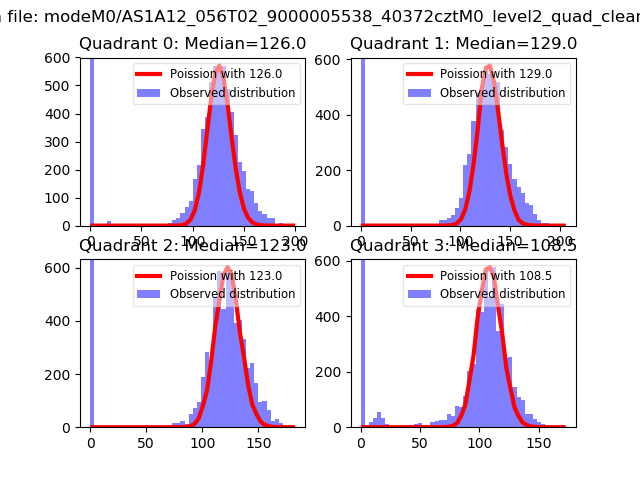
| Comparison with Poisson distribution Blue bars denote a histogram of data divided into 1 sec bins. Red curve is a Poisson curve with rate = median count rate of data. |
 |
 |
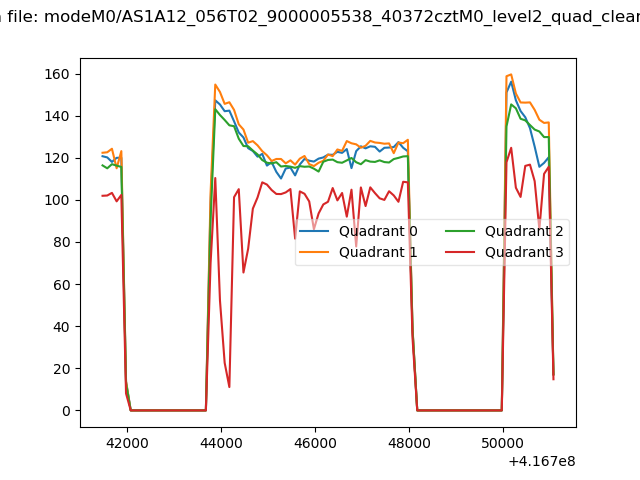
| Quadrant-wise count rates Data is divided into 100 sec bins |
 |
|
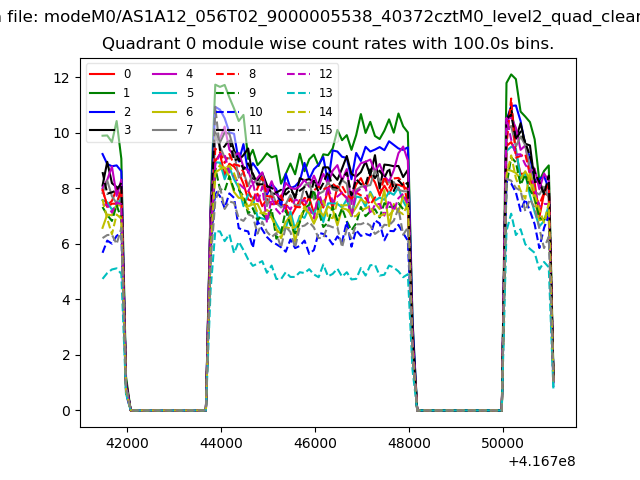
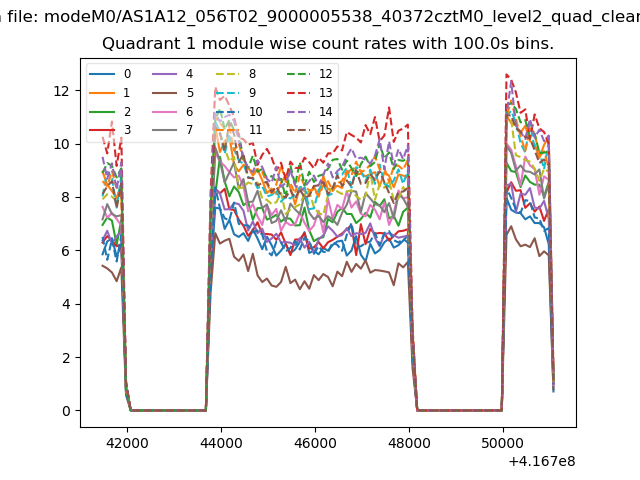
| Module-wise count rates for Quadrant A Data is divided into 100 sec bins |
 |
 |
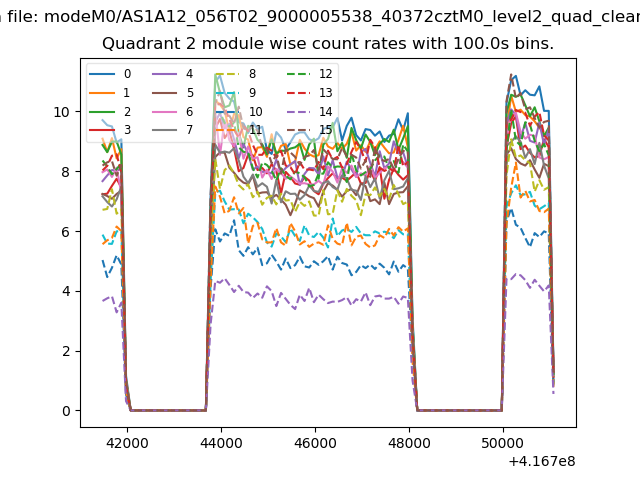
| Module-wise count rates for Quadrant B Data is divided into 100 sec bins |
 |
 |
| Module-wise count rates for Quadrant C Data is divided into 100 sec bins |
 |
 |
| Module-wise count rates for Quadrant D Data is divided into 100 sec bins |
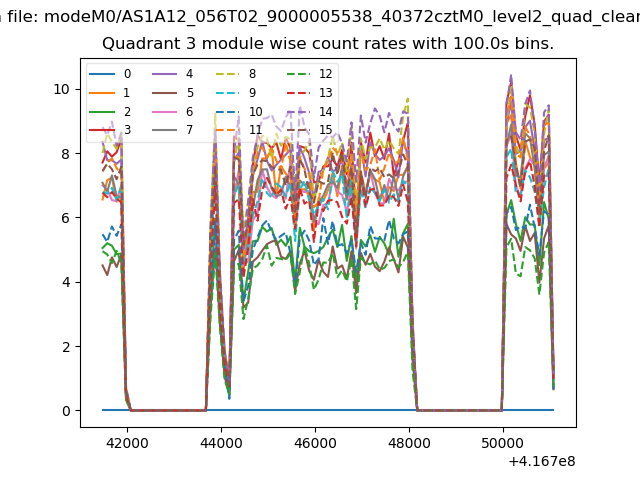 |
 |
| Parameter | Plot |
|---|---|
| CZT HV Monitor | 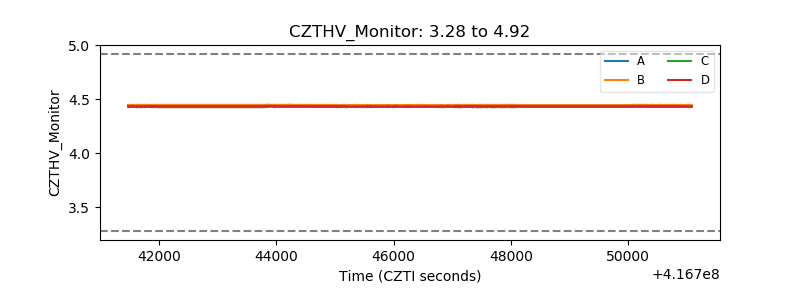 |
| D_VDD | 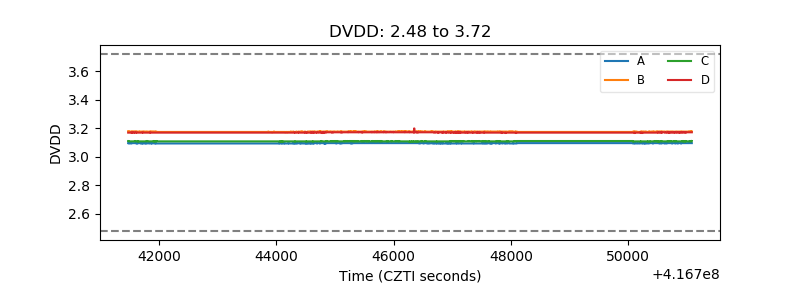 |
| Temperature 1 | 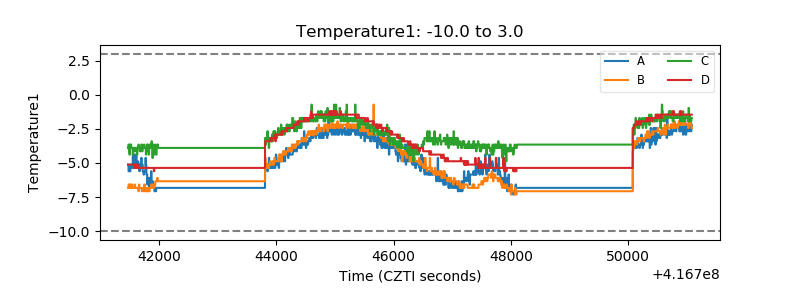 |
| Veto HV Monitor | 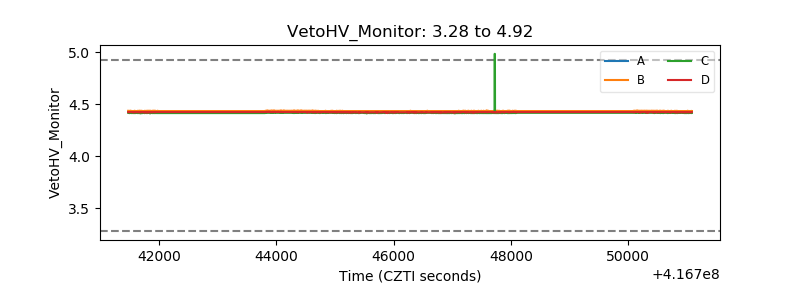 |
| Veto LLD |  |
| Alpha Counter |  |
| _CPM_Rate | 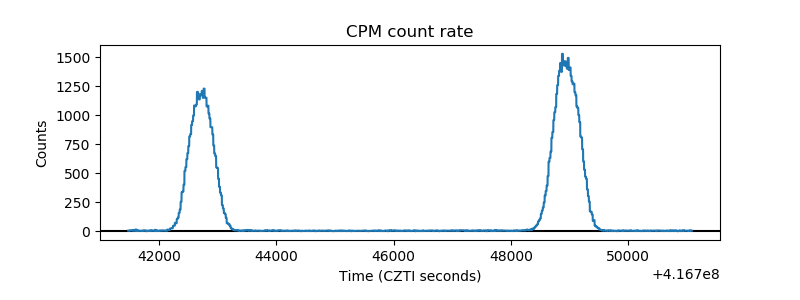 |
| CZT Counter | 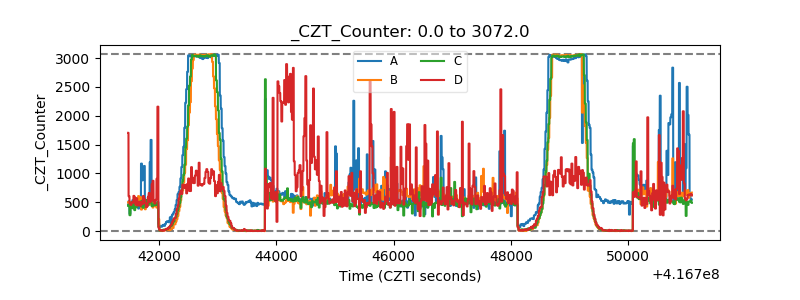 |
| +2.5 Volts monitor | 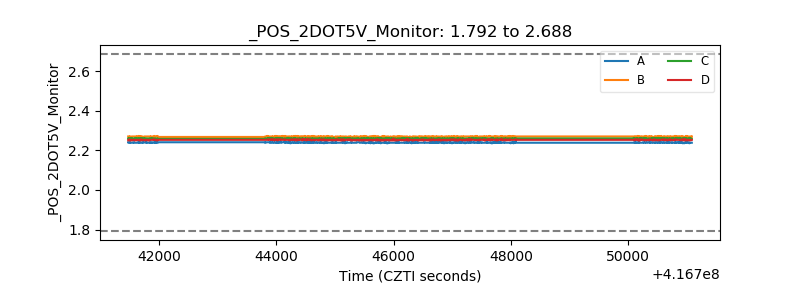 |
| +5 Volts monitor | 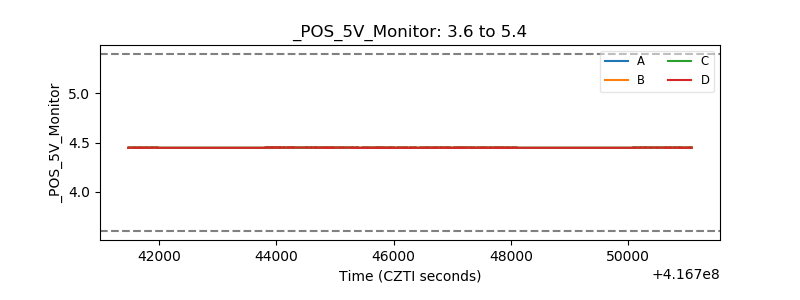 |
| _ROLL_ROT | 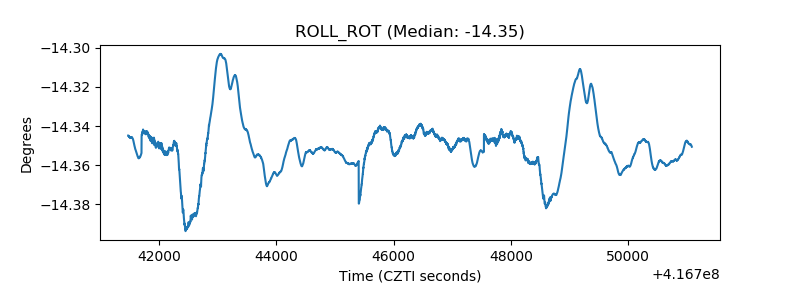 |
| _Roll_DEC | 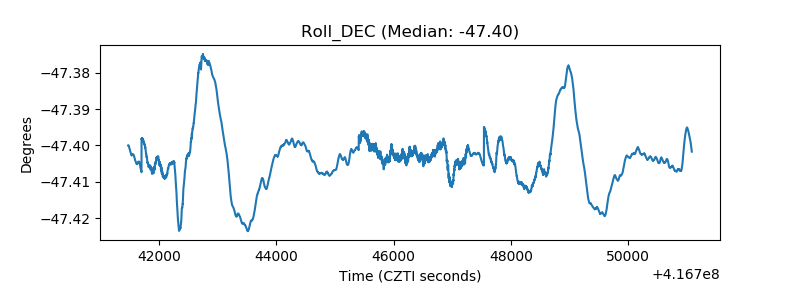 |
| _Roll_RA | 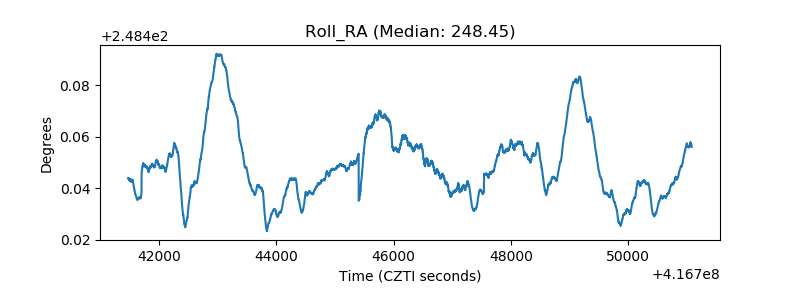 |
| Veto Counter | 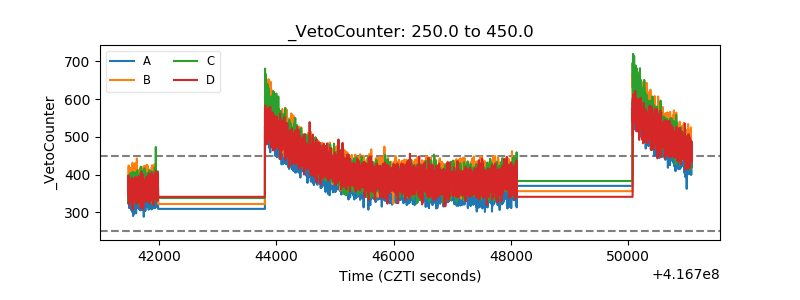 |