| Param | Original file | Final file |
|---|---|---|
| Filename | modeM0/AS1A12_056T02_9000005538_40373cztM0_level2.fits | modeM0/AS1A12_056T02_9000005538_40373cztM0_level2_quad_clean.evt |
| Size (bytes) | 382,487,040 | 98,697,600 |
| Size | 364.8 MB | 94.1 MB |
| Events in quadrant A | 3,628,010 | 691,889 |
| Events in quadrant B | 3,047,712 | 719,419 |
| Events in quadrant C | 2,762,439 | 677,503 |
| Events in quadrant D | 4,307,459 | 529,295 |
| Mode M0 | |||
|---|---|---|---|
| Quadrant | BADHDUFLAG | Total packets | Discarded packets |
| A | 0 | 14066 | 3 |
| B | 0 | 12816 | 2 |
| C | 0 | 11207 | 2 |
| D | 0 | 16437 | 2 |
| Mode M9 | |||
|---|---|---|---|
| Quadrant | BADHDUFLAG | Total packets | Discarded packets |
| A | 0 | 26 | 0 |
| B | 0 | 26 | 0 |
| C | 0 | 26 | 0 |
| D | 0 | 27 | 0 |
| Mode SS | |||
|---|---|---|---|
| Quadrant | BADHDUFLAG | Total packets | Discarded packets |
| A | 0 | 106 | 0 |
| B | 0 | 106 | 0 |
| C | 0 | 106 | 0 |
| D | 0 | 106 | 0 |
| Quadrant | Total seconds | Saturated seconds | Saturation percentage |
|---|---|---|---|
| A | 5298 | 168 | 3.171008% |
| B | 5298 | 18 | 0.339751% |
| C | 5298 | 27 | 0.509626% |
| D | 5298 | 1063 | 20.064175% |
Noise dominated data is calculated using 1-second bins in cleaned event files. If a bin has >2000 counts, and if more than 50% of those come from <1% of pixels, then it is considered to be noise-dominated and hence unusable.
| Quadrant | # 1 sec bins | Bins with >0 counts | Bins with >2000 counts | High rate bins dominated by noise | Noise dominated (total time) | Noise dominated (detector-on time) | Marked lightcurve |
|---|---|---|---|---|---|---|---|
| A | 7331 | 5299 | 109 | 109 | 1.49% | 2.06% | 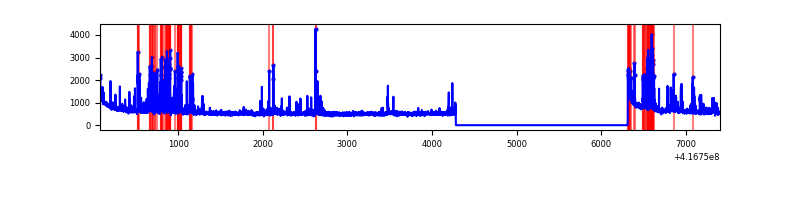 |
| B | 7331 | 5299 | 6 | 6 | 0.08% | 0.11% | 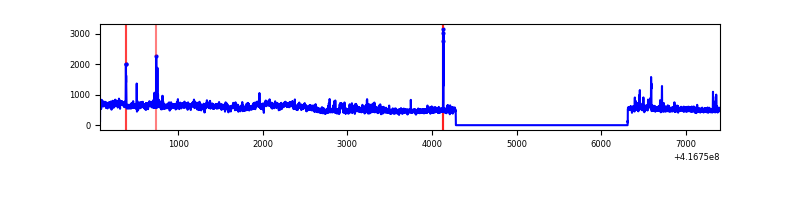 |
| C | 7331 | 5299 | 14 | 14 | 0.19% | 0.26% | 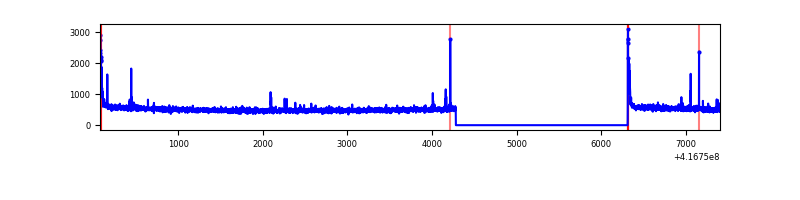 |
| D | 7331 | 5299 | 299 | 299 | 4.08% | 5.64% | 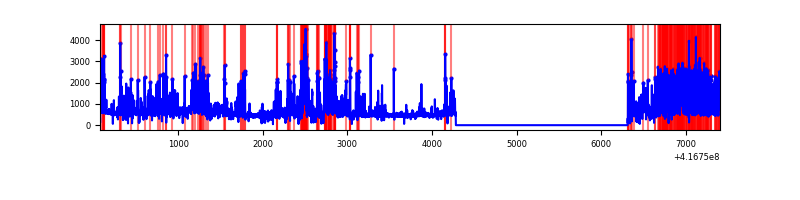 |
Top three noisy pixels from each quadrant. If the there are fewer than three noisy pixels in the level2.evt file, extra rows are filled as -1
| Pixel properties | Quadrant properties | ||||||
|---|---|---|---|---|---|---|---|
| Quadrant | DetID | PixID | Counts | Sigma | Mean | Median | Sigma |
| A | 13 | 248 | 590028 | 4561.52 | 643 | 635 | 129.2 |
| A | 10 | 83 | 483717 | 3738.74 | 643 | 635 | 129.2 |
| A | 2 | 79 | 47610 | 363.56 | 643 | 635 | 129.2 |
| B | 7 | 202 | 363659 | 3016.67 | 641 | 625 | 120.3 |
| B | 3 | 112 | 43221 | 353.96 | 641 | 625 | 120.3 |
| B | 4 | 170 | 37984 | 310.44 | 641 | 625 | 120.3 |
| C | 15 | 214 | 227167 | 1600.47 | 621 | 627 | 141.5 |
| C | 0 | 10 | 72836 | 510.15 | 621 | 627 | 141.5 |
| C | 14 | 254 | 38036 | 264.29 | 621 | 627 | 141.5 |
| D | 12 | 227 | 1301057 | 9234.83 | 570 | 556 | 140.8 |
| D | 2 | 250 | 374665 | 2656.54 | 570 | 556 | 140.8 |
| D | 12 | 191 | 184140 | 1303.63 | 570 | 556 | 140.8 |
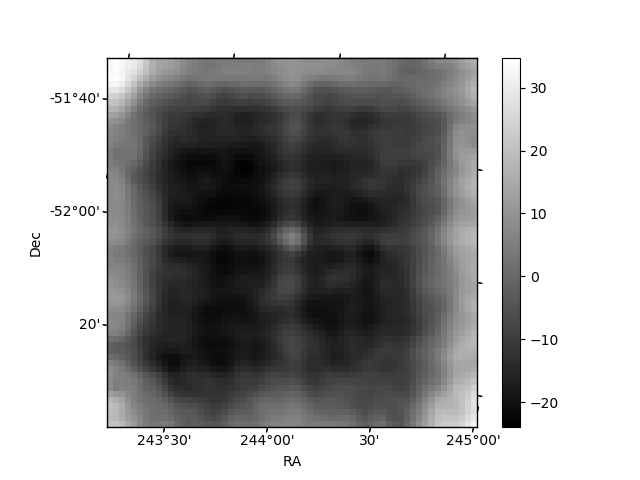
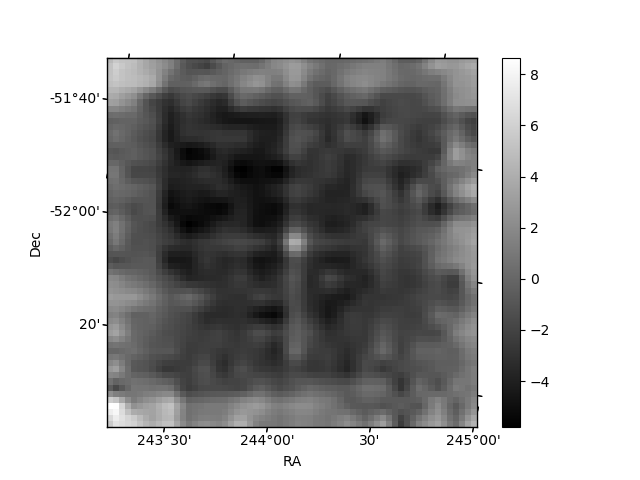
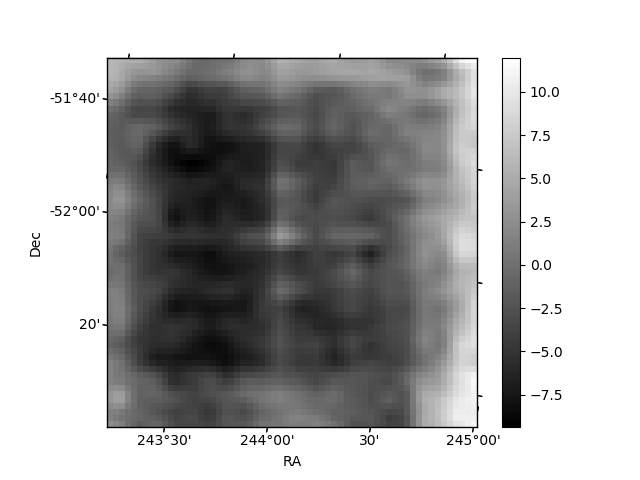
Histogram calculated using DETX and DETY for each event in the final _common_clean file
| Quadrant A | 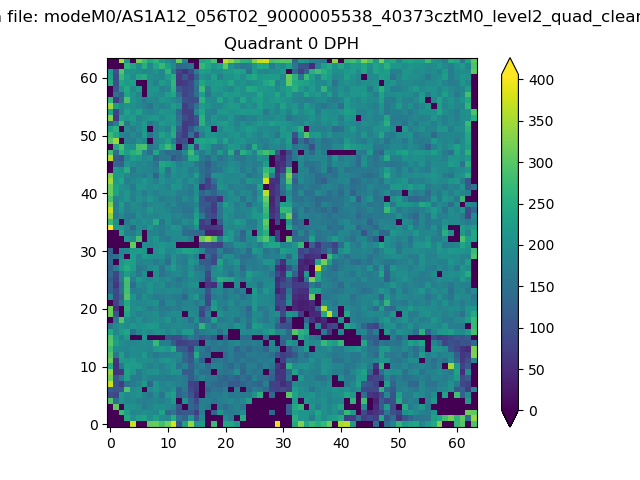 |
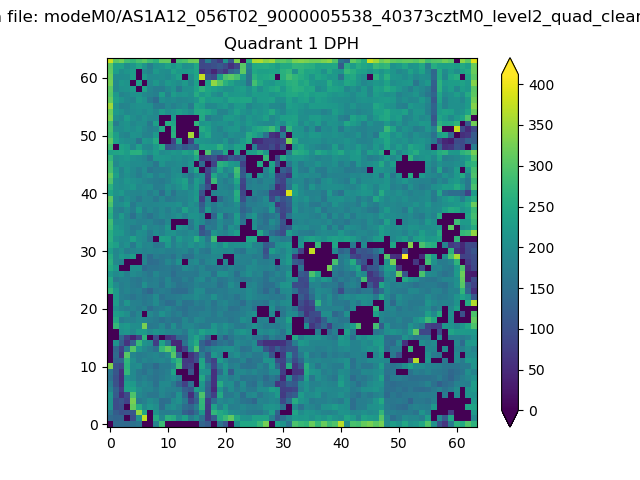 |
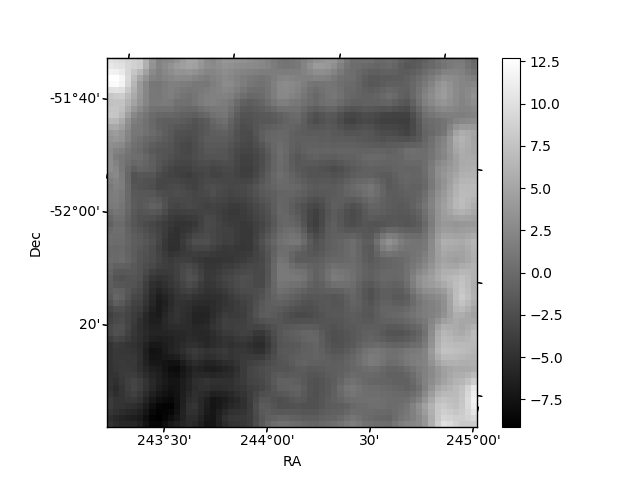
Quadrant B |
|---|---|---|---|
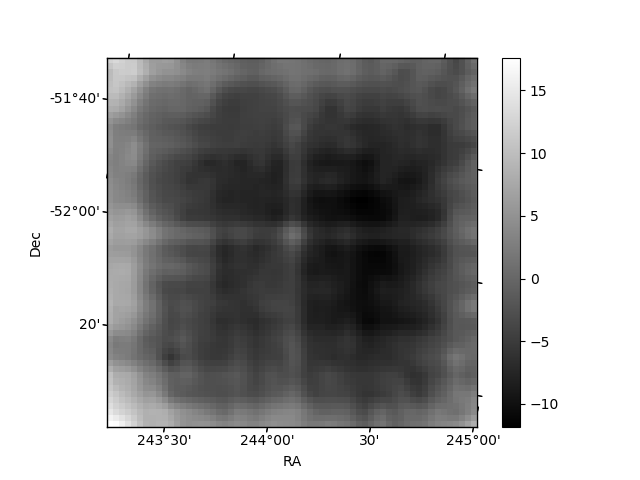
| Quadrant D | 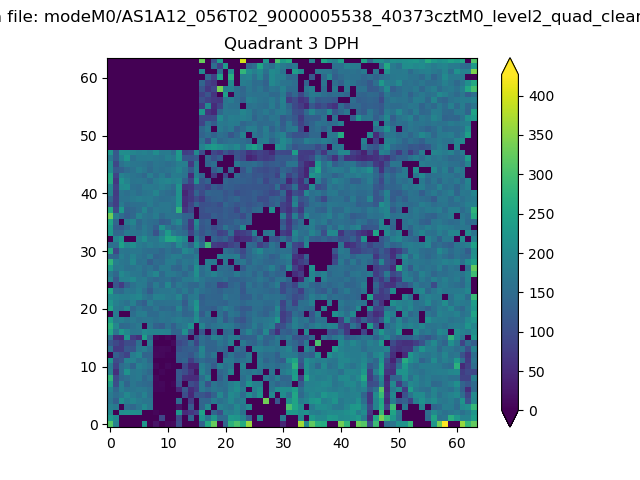 |
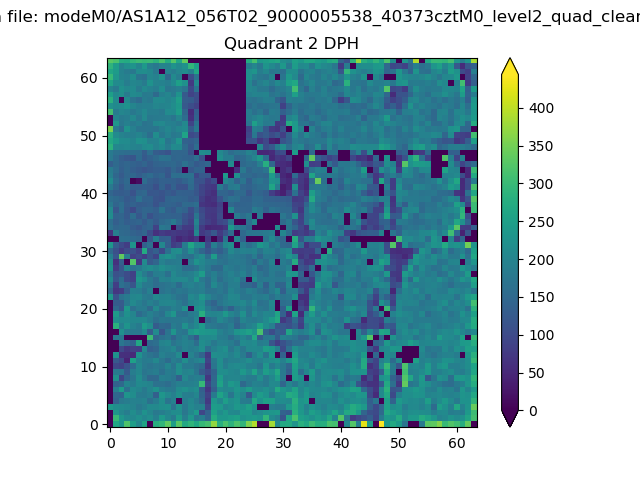 |
Quadrant C |
| Plot type | Count rate plots | Images |
|---|---|---|
| Comparison with Poisson distribution Blue bars denote a histogram of data divided into 1 sec bins. Red curve is a Poisson curve with rate = median count rate of data. |
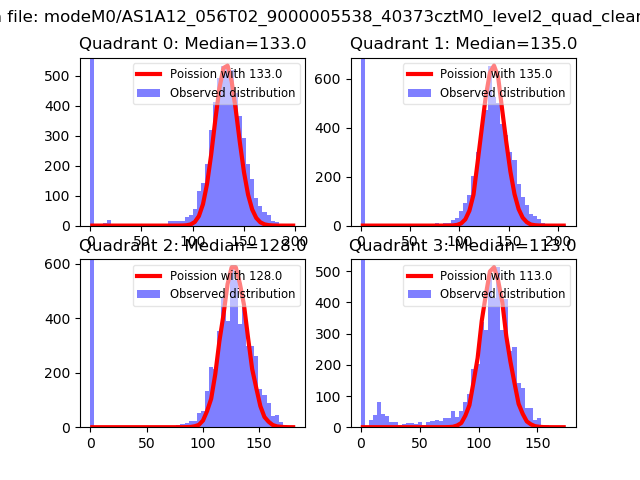 |
 |
| Quadrant-wise count rates Data is divided into 100 sec bins |
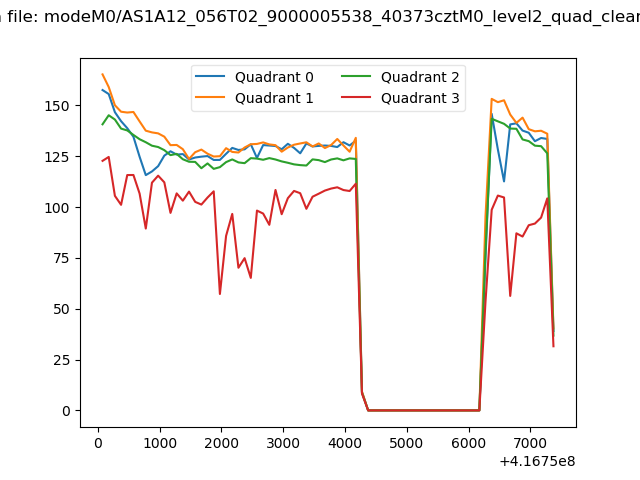 |
|
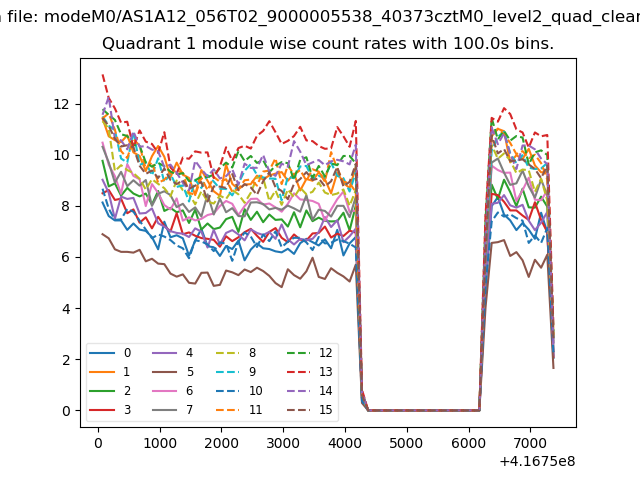
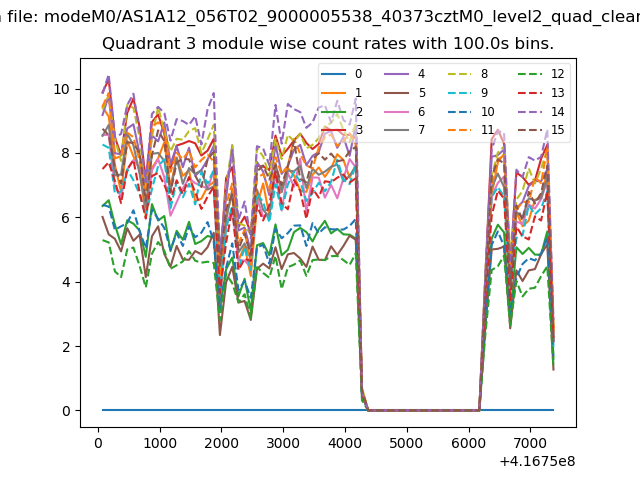
| Module-wise count rates for Quadrant A Data is divided into 100 sec bins |
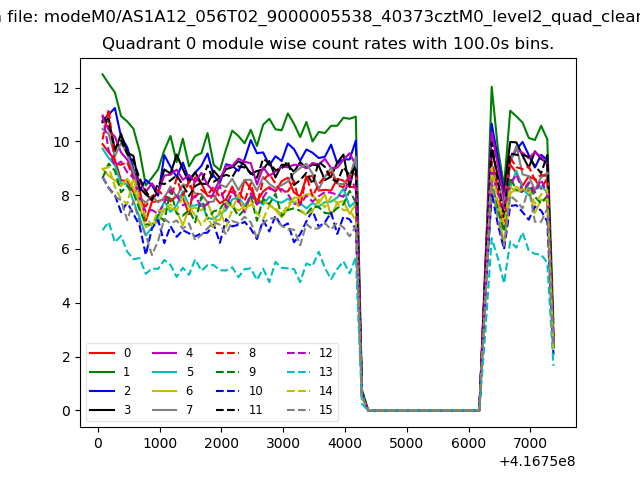 |
 |
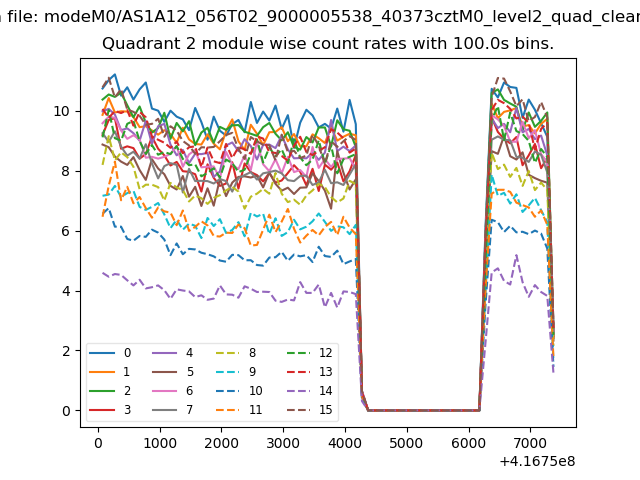
| Module-wise count rates for Quadrant B Data is divided into 100 sec bins |
 |
 |
| Module-wise count rates for Quadrant C Data is divided into 100 sec bins |
 |
 |
| Module-wise count rates for Quadrant D Data is divided into 100 sec bins |
 |
 |
| Parameter | Plot |
|---|---|
| CZT HV Monitor | 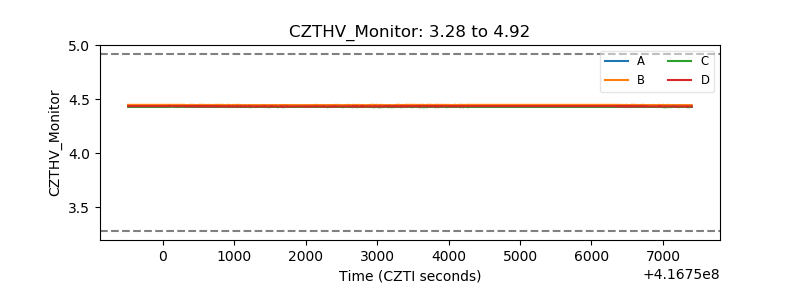 |
| D_VDD | 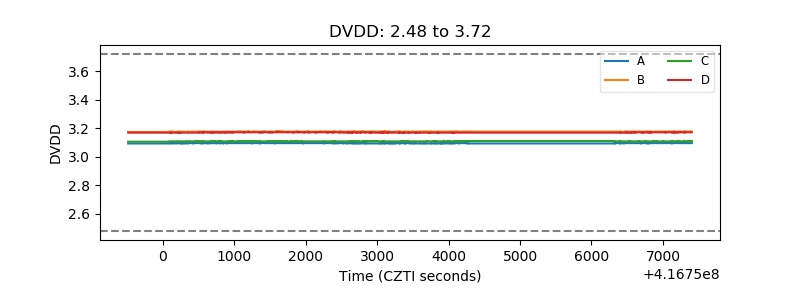 |
| Temperature 1 | 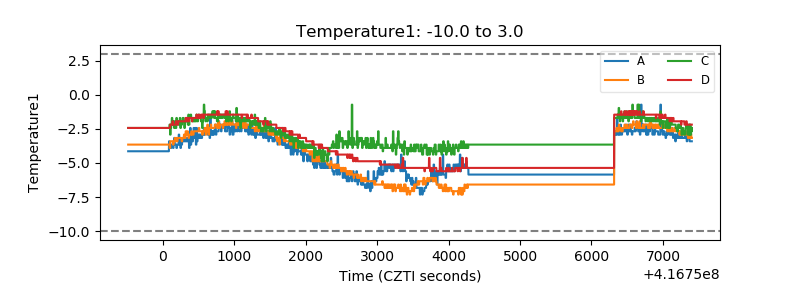 |
| Veto HV Monitor | 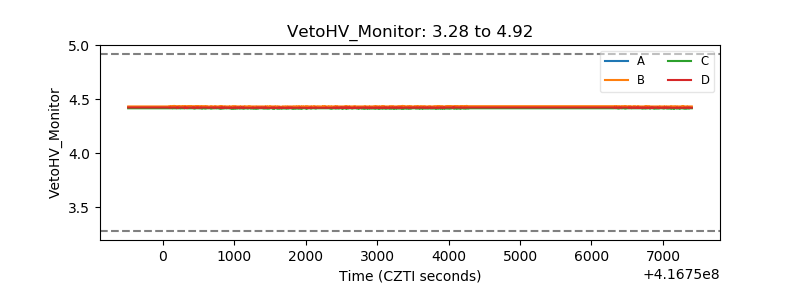 |
| Veto LLD | 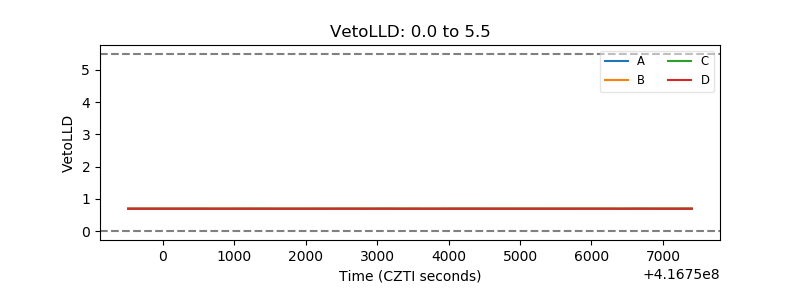 |
| Alpha Counter | 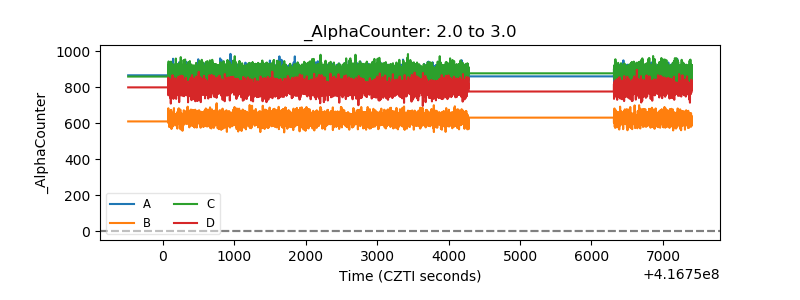 |
| _CPM_Rate | 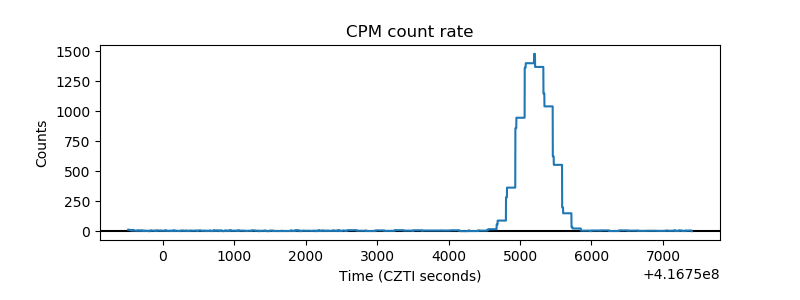 |
| CZT Counter | 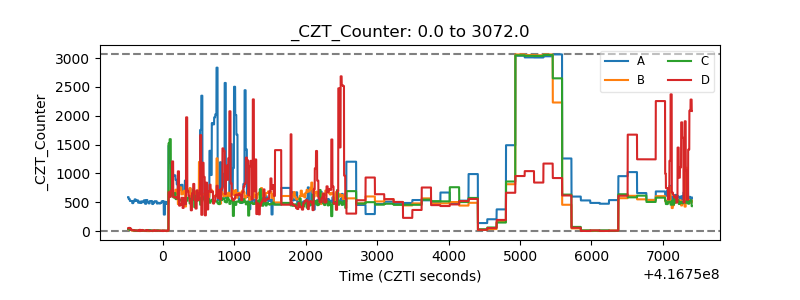 |
| +2.5 Volts monitor | 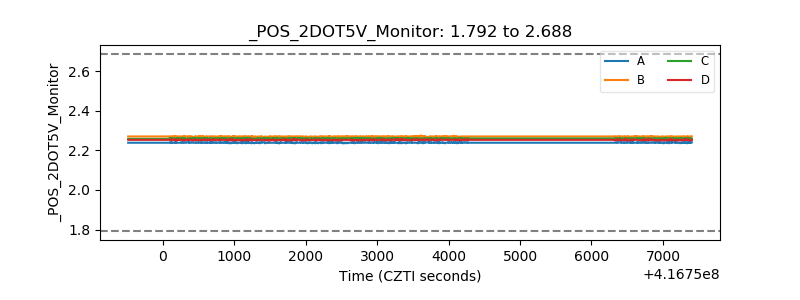 |
| +5 Volts monitor | 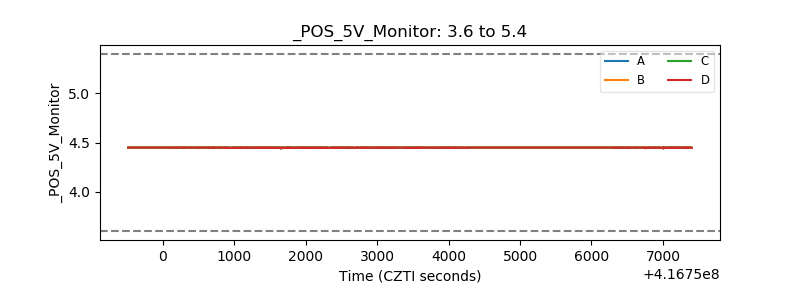 |
| _ROLL_ROT | 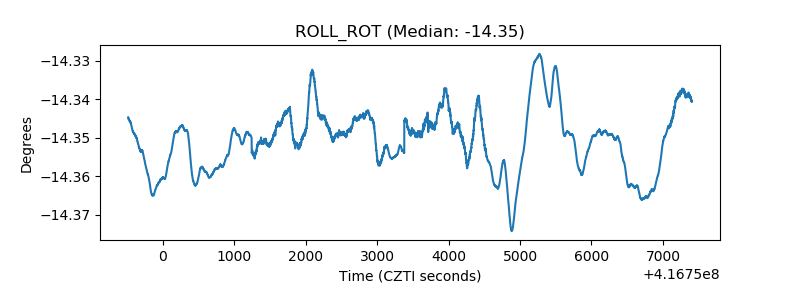 |
| _Roll_DEC | 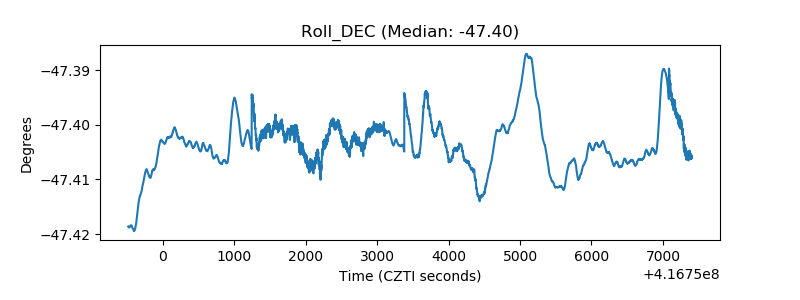 |
| _Roll_RA | 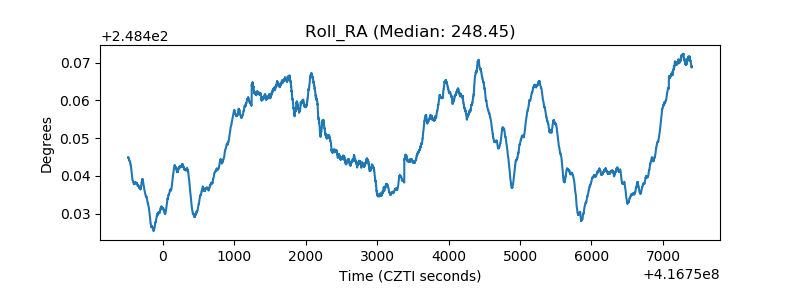 |
| Veto Counter | 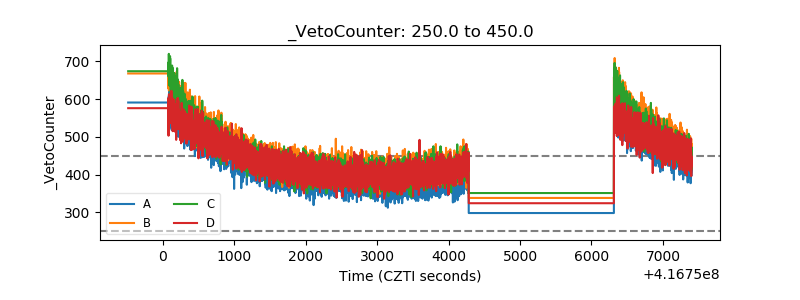 |