| Param | Original file | Final file |
|---|---|---|
| Filename | modeM0/AS1A12_056T02_9000005538_40374cztM0_level2.fits | modeM0/AS1A12_056T02_9000005538_40374cztM0_level2_quad_clean.evt |
| Size (bytes) | 423,279,360 | 93,623,040 |
| Size | 403.7 MB | 89.3 MB |
| Events in quadrant A | 3,316,094 | 666,787 |
| Events in quadrant B | 4,723,346 | 677,878 |
| Events in quadrant C | 2,715,725 | 644,897 |
| Events in quadrant D | 4,515,306 | 486,883 |
| Mode M0 | |||
|---|---|---|---|
| Quadrant | BADHDUFLAG | Total packets | Discarded packets |
| A | 0 | 12992 | 3 |
| B | 0 | 17407 | 2 |
| C | 0 | 10996 | 2 |
| D | 0 | 16928 | 2 |
| Mode M9 | |||
|---|---|---|---|
| Quadrant | BADHDUFLAG | Total packets | Discarded packets |
| A | 0 | 32 | 0 |
| B | 0 | 32 | 0 |
| C | 0 | 32 | 0 |
| D | 0 | 33 | 0 |
| Mode SS | |||
|---|---|---|---|
| Quadrant | BADHDUFLAG | Total packets | Discarded packets |
| A | 0 | 104 | 0 |
| B | 0 | 104 | 0 |
| C | 0 | 104 | 0 |
| D | 0 | 104 | 0 |
| Quadrant | Total seconds | Saturated seconds | Saturation percentage |
|---|---|---|---|
| A | 5117 | 121 | 2.364667% |
| B | 5117 | 227 | 4.436193% |
| C | 5117 | 37 | 0.723080% |
| D | 5117 | 1210 | 23.646668% |
Noise dominated data is calculated using 1-second bins in cleaned event files. If a bin has >2000 counts, and if more than 50% of those come from <1% of pixels, then it is considered to be noise-dominated and hence unusable.
| Quadrant | # 1 sec bins | Bins with >0 counts | Bins with >2000 counts | High rate bins dominated by noise | Noise dominated (total time) | Noise dominated (detector-on time) | Marked lightcurve |
|---|---|---|---|---|---|---|---|
| A | 7239 | 5118 | 83 | 83 | 1.15% | 1.62% | 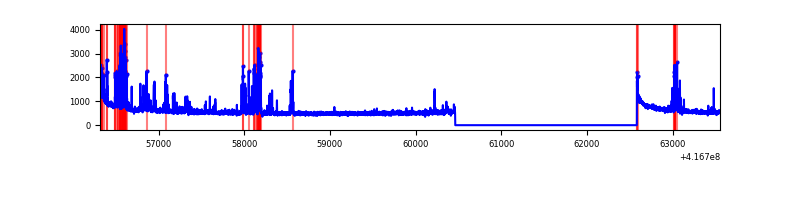 |
| B | 7239 | 5118 | 78 | 78 | 1.08% | 1.52% | 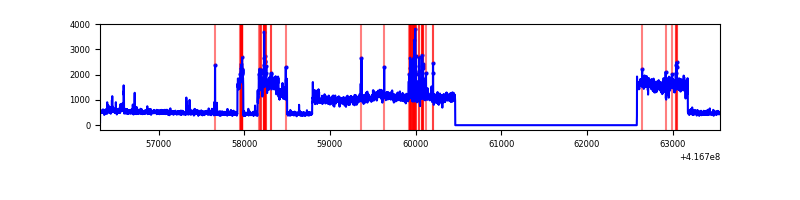 |
| C | 7239 | 5118 | 23 | 23 | 0.32% | 0.45% | 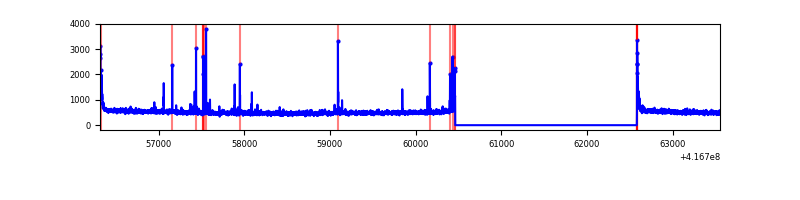 |
| D | 7239 | 5118 | 354 | 354 | 4.89% | 6.92% | 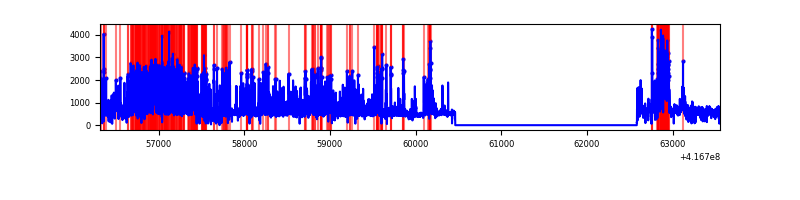 |
Top three noisy pixels from each quadrant. If the there are fewer than three noisy pixels in the level2.evt file, extra rows are filled as -1
| Pixel properties | Quadrant properties | ||||||
|---|---|---|---|---|---|---|---|
| Quadrant | DetID | PixID | Counts | Sigma | Mean | Median | Sigma |
| A | 10 | 83 | 471703 | 3817.63 | 616 | 607 | 123.4 |
| A | 13 | 248 | 421552 | 3411.22 | 616 | 607 | 123.4 |
| A | 2 | 79 | 26896 | 213.04 | 616 | 607 | 123.4 |
| B | 7 | 202 | 2119048 | 18374.44 | 608 | 592 | 115.3 |
| B | 5 | 255 | 111906 | 965.48 | 608 | 592 | 115.3 |
| B | 0 | 230 | 34205 | 291.54 | 608 | 592 | 115.3 |
| C | 15 | 214 | 220828 | 1623.67 | 593 | 599 | 135.6 |
| C | 14 | 254 | 115671 | 848.39 | 593 | 599 | 135.6 |
| C | 0 | 10 | 64481 | 470.98 | 593 | 599 | 135.6 |
| D | 12 | 227 | 1370270 | 10276.65 | 532 | 517 | 133.3 |
| D | 2 | 250 | 678817 | 5088.98 | 532 | 517 | 133.3 |
| D | 12 | 191 | 184447 | 1379.94 | 532 | 517 | 133.3 |
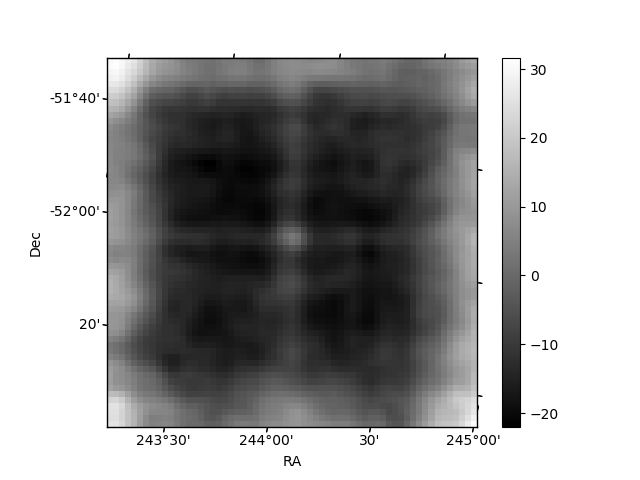
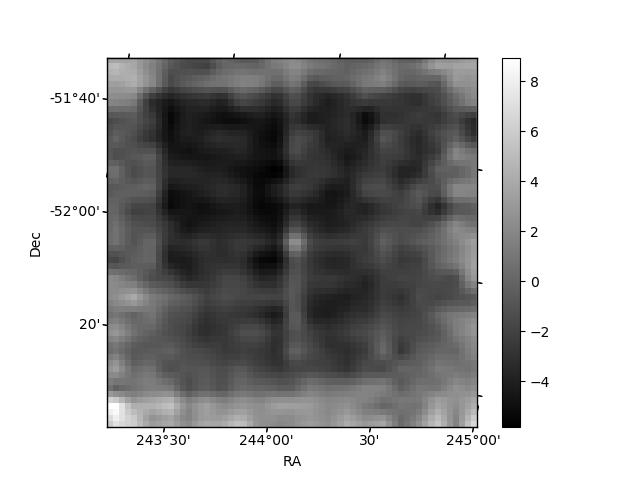
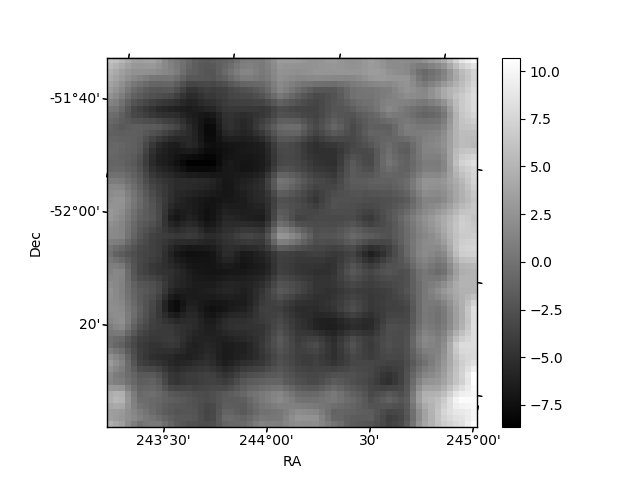
Histogram calculated using DETX and DETY for each event in the final _common_clean file
| Quadrant A | 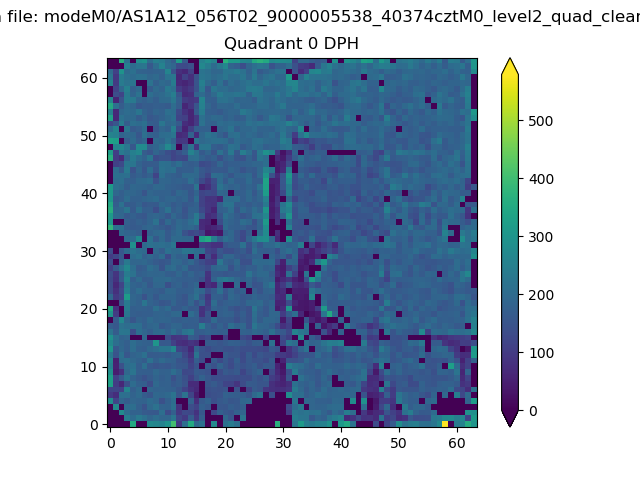 |
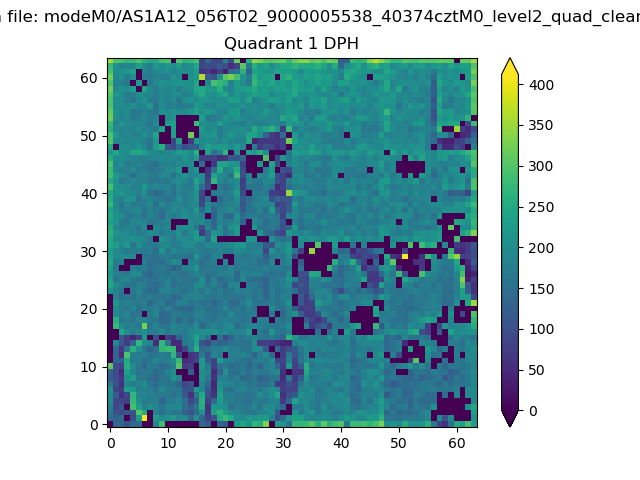 |
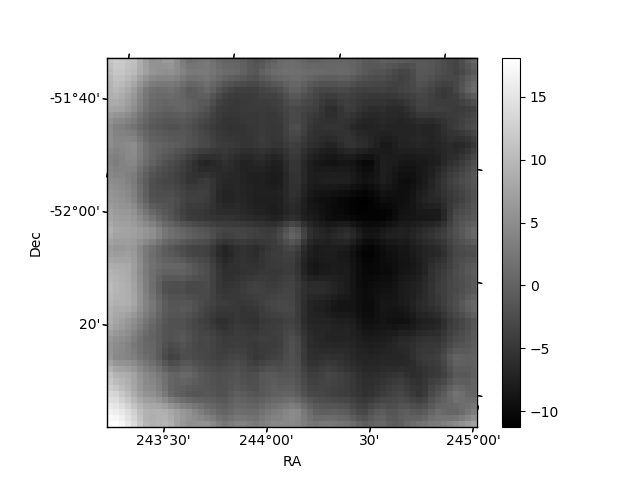
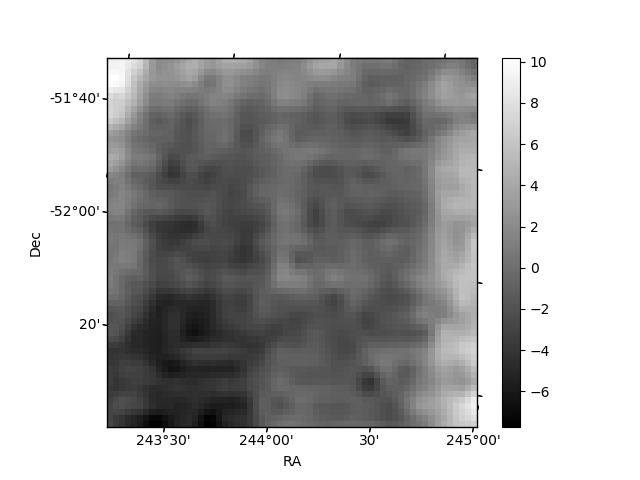
Quadrant B |
|---|---|---|---|
| Quadrant D | 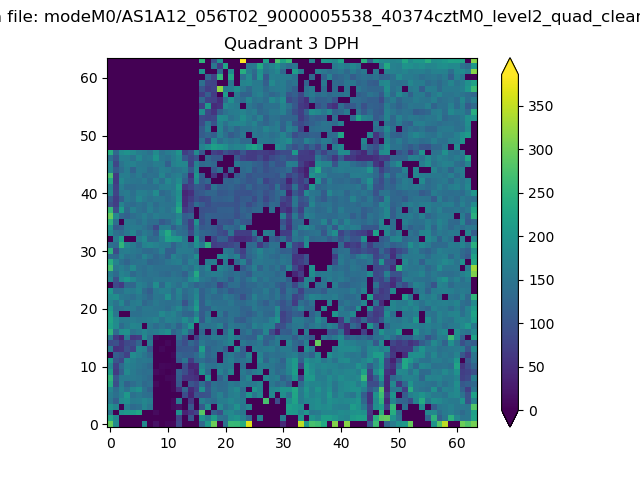 |
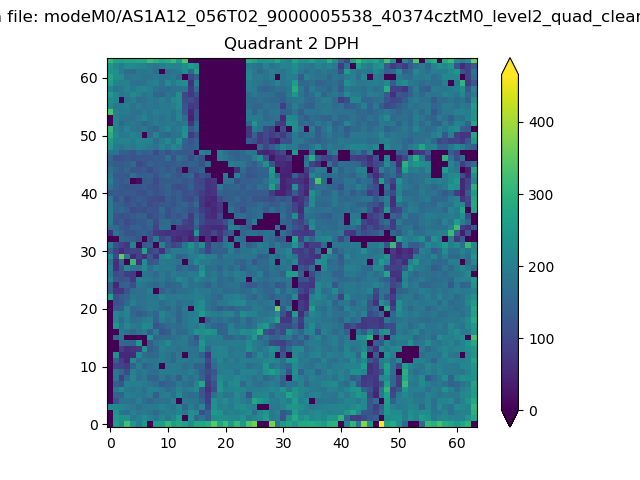 |
Quadrant C |
| Plot type | Count rate plots | Images |
|---|---|---|
| Comparison with Poisson distribution Blue bars denote a histogram of data divided into 1 sec bins. Red curve is a Poisson curve with rate = median count rate of data. |
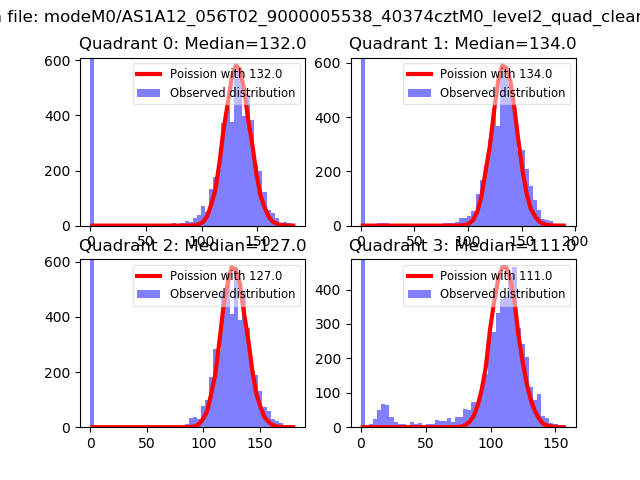 |
 |
| Quadrant-wise count rates Data is divided into 100 sec bins |
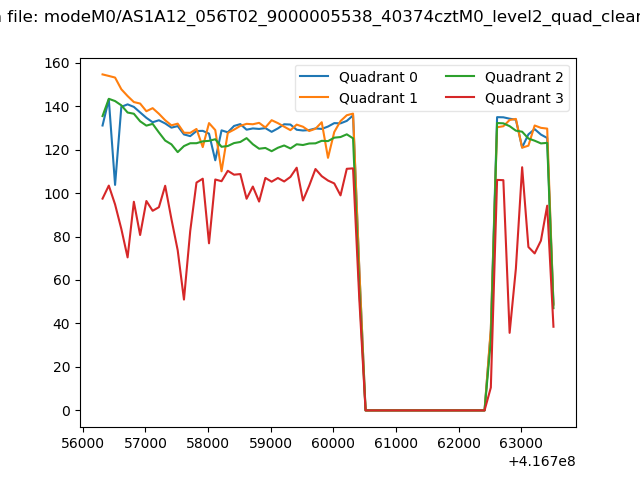 |
|
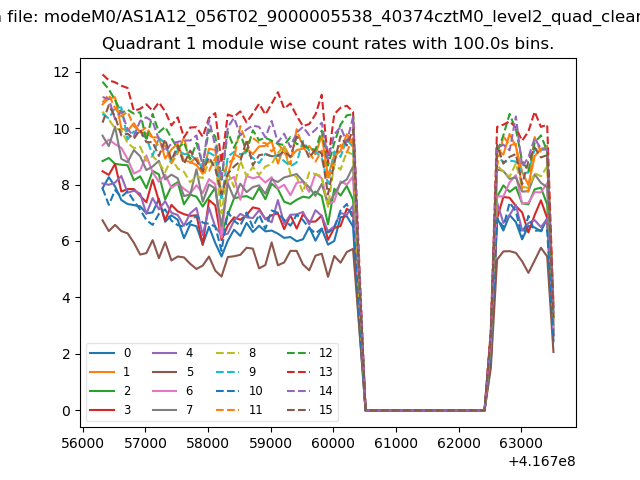
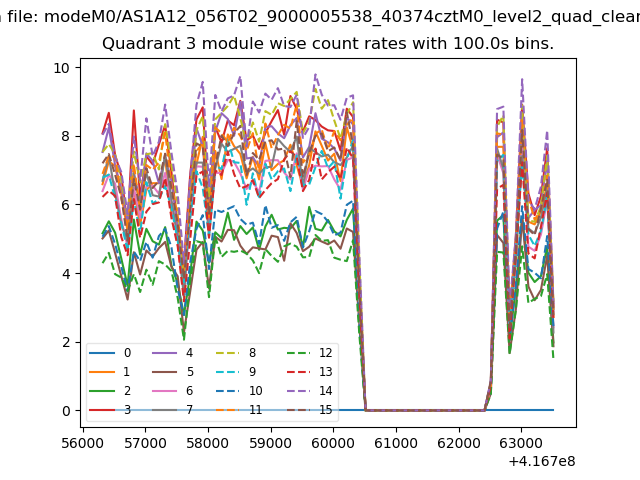
| Module-wise count rates for Quadrant A Data is divided into 100 sec bins |
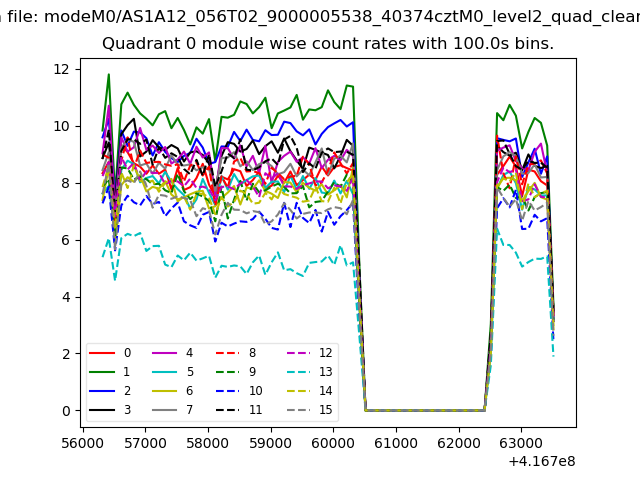 |
 |
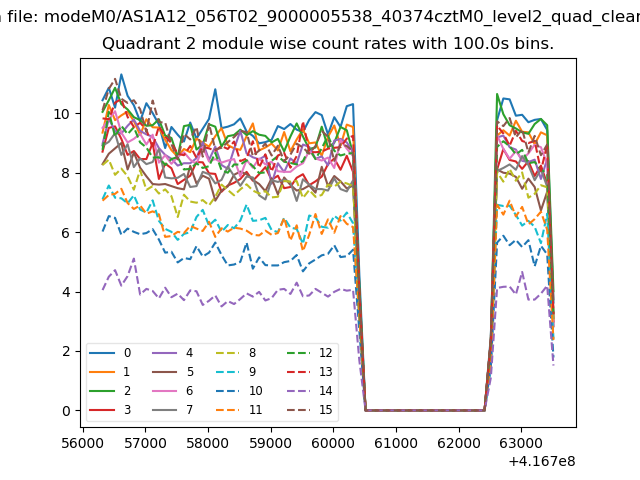
| Module-wise count rates for Quadrant B Data is divided into 100 sec bins |
 |
 |
| Module-wise count rates for Quadrant C Data is divided into 100 sec bins |
 |
 |
| Module-wise count rates for Quadrant D Data is divided into 100 sec bins |
 |
 |
| Parameter | Plot |
|---|---|
| CZT HV Monitor | 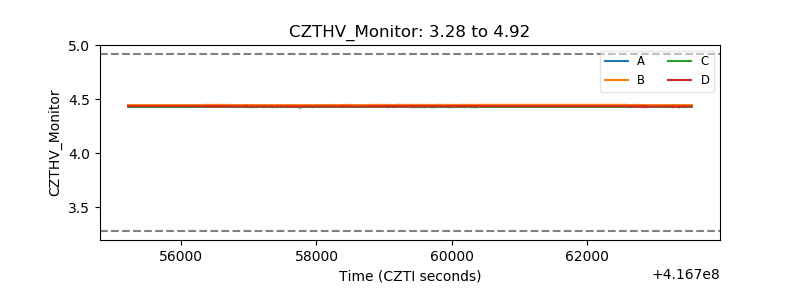 |
| D_VDD | 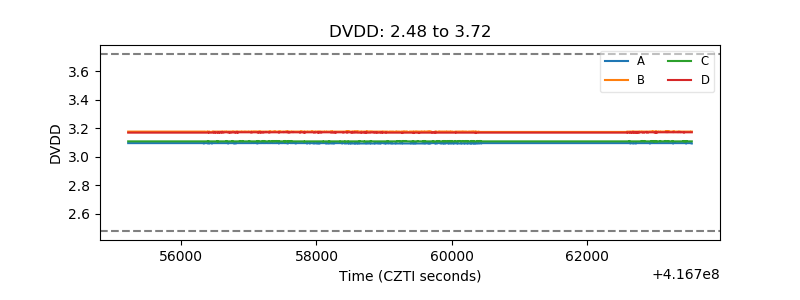 |
| Temperature 1 |  |
| Veto HV Monitor | 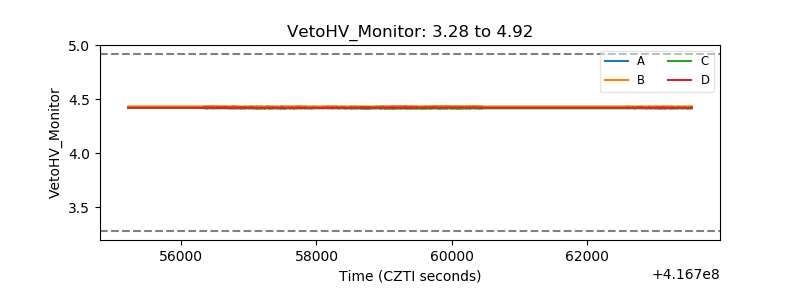 |
| Veto LLD | 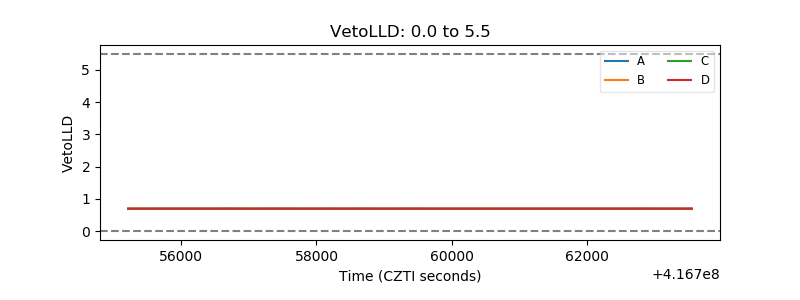 |
| Alpha Counter | 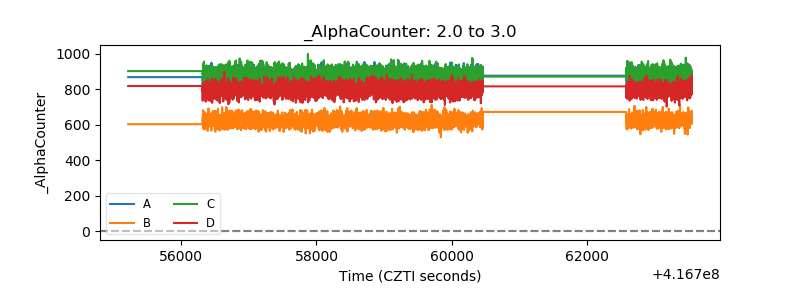 |
| _CPM_Rate | 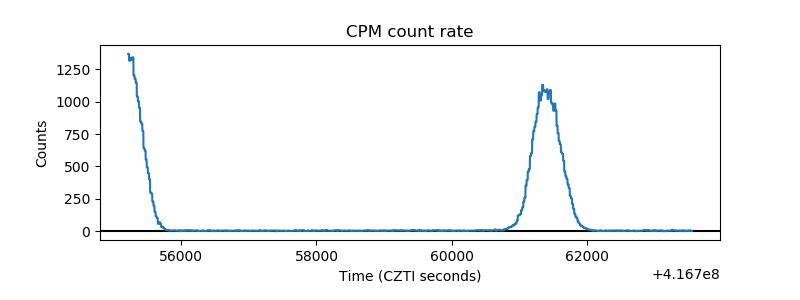 |
| CZT Counter | 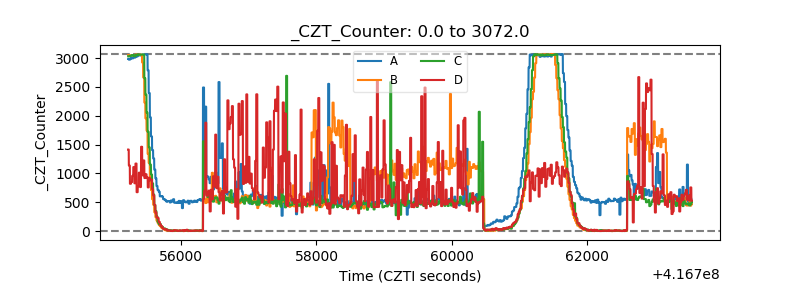 |
| +2.5 Volts monitor | 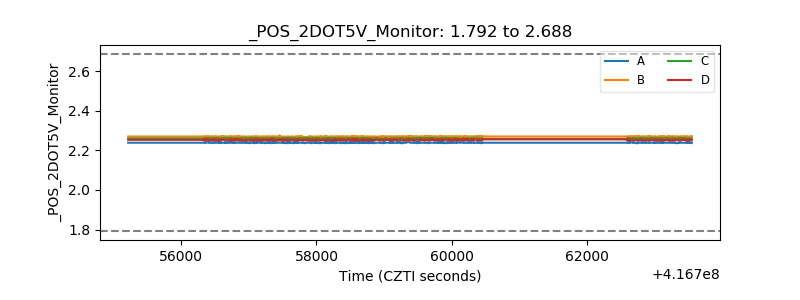 |
| +5 Volts monitor | 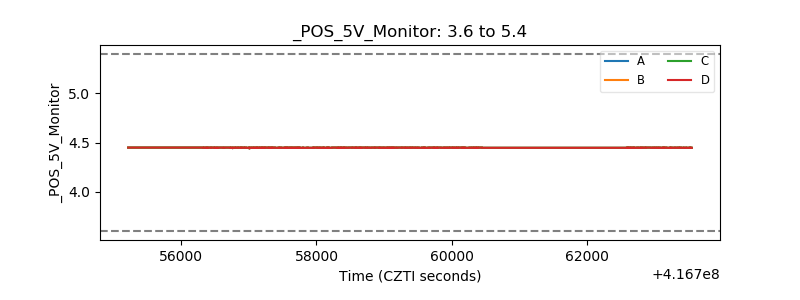 |
| _ROLL_ROT | 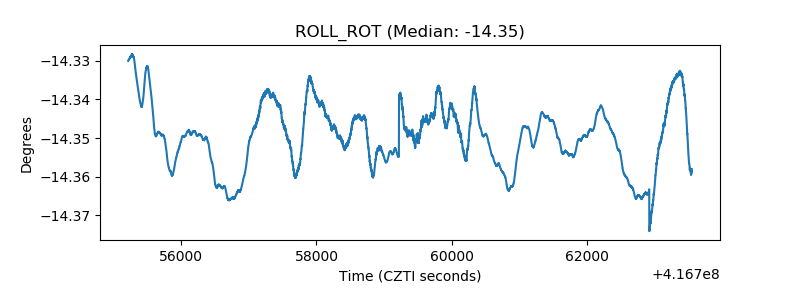 |
| _Roll_DEC | 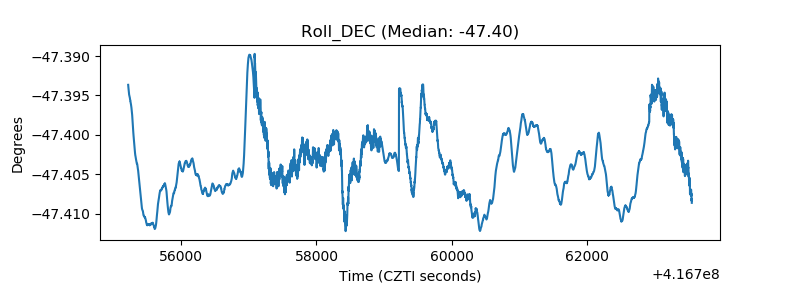 |
| _Roll_RA | 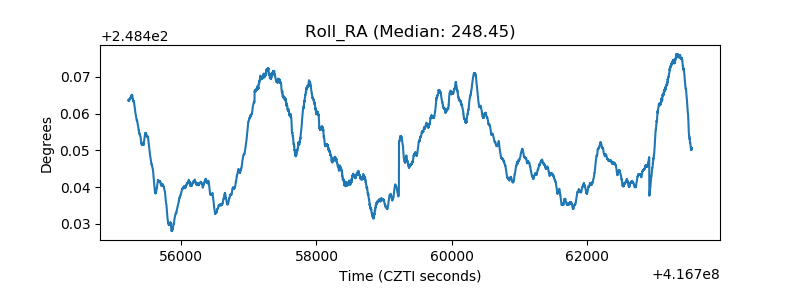 |
| Veto Counter | 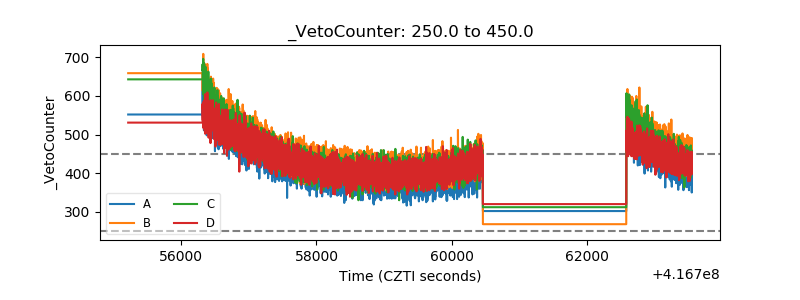 |