| Param | Original file | Final file |
|---|---|---|
| Filename | modeM0/AS1A12_056T02_9000005538_40375cztM0_level2.fits | modeM0/AS1A12_056T02_9000005538_40375cztM0_level2_quad_clean.evt |
| Size (bytes) | 326,508,480 | 89,516,160 |
| Size | 311.4 MB | 85.4 MB |
| Events in quadrant A | 2,931,607 | 628,404 |
| Events in quadrant B | 3,097,462 | 640,081 |
| Events in quadrant C | 2,468,184 | 606,533 |
| Events in quadrant D | 3,198,496 | 484,634 |
| Mode M0 | |||
|---|---|---|---|
| Quadrant | BADHDUFLAG | Total packets | Discarded packets |
| A | 0 | 11649 | 3 |
| B | 0 | 12401 | 2 |
| C | 0 | 10299 | 2 |
| D | 0 | 12869 | 2 |
| Mode M9 | |||
|---|---|---|---|
| Quadrant | BADHDUFLAG | Total packets | Discarded packets |
| A | 0 | 28 | 0 |
| B | 0 | 28 | 0 |
| C | 0 | 28 | 0 |
| D | 0 | 29 | 0 |
| Mode SS | |||
|---|---|---|---|
| Quadrant | BADHDUFLAG | Total packets | Discarded packets |
| A | 0 | 102 | 0 |
| B | 0 | 102 | 0 |
| C | 0 | 102 | 0 |
| D | 0 | 102 | 0 |
| Quadrant | Total seconds | Saturated seconds | Saturation percentage |
|---|---|---|---|
| A | 5005 | 66 | 1.318681% |
| B | 5005 | 121 | 2.417582% |
| C | 5005 | 12 | 0.239760% |
| D | 5005 | 793 | 15.844156% |
Noise dominated data is calculated using 1-second bins in cleaned event files. If a bin has >2000 counts, and if more than 50% of those come from <1% of pixels, then it is considered to be noise-dominated and hence unusable.
| Quadrant | # 1 sec bins | Bins with >0 counts | Bins with >2000 counts | High rate bins dominated by noise | Noise dominated (total time) | Noise dominated (detector-on time) | Marked lightcurve |
|---|---|---|---|---|---|---|---|
| A | 7128 | 5006 | 36 | 36 | 0.51% | 0.72% | 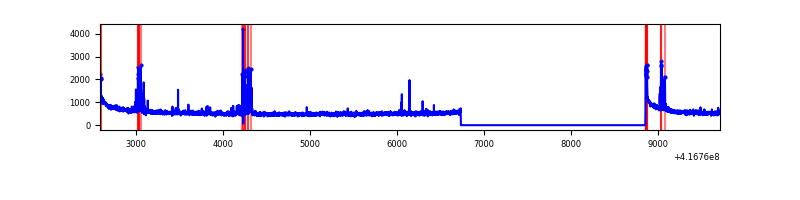 |
| B | 7128 | 5006 | 14 | 14 | 0.20% | 0.28% | 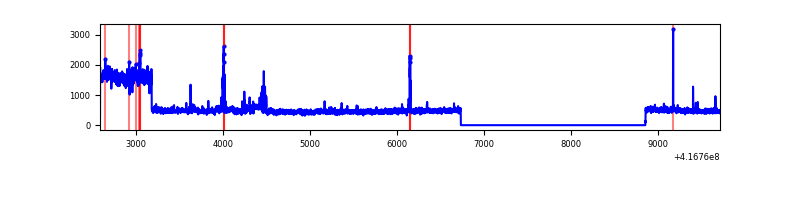 |
| C | 7128 | 5006 | 8 | 8 | 0.11% | 0.16% | 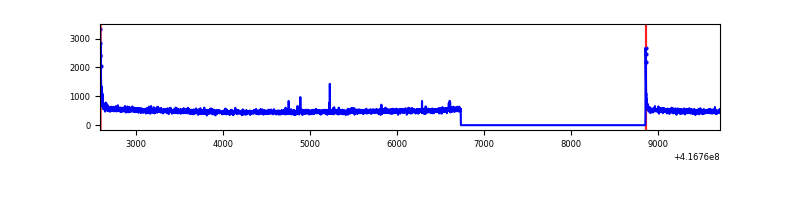 |
| D | 7128 | 5005 | 140 | 140 | 1.96% | 2.80% | 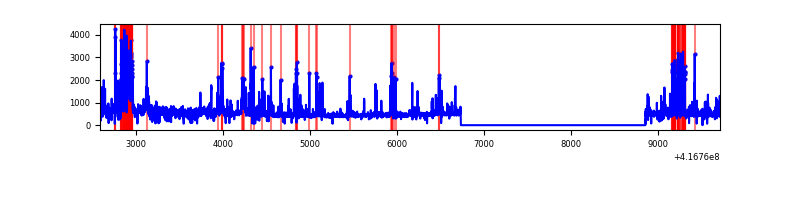 |
Top three noisy pixels from each quadrant. If the there are fewer than three noisy pixels in the level2.evt file, extra rows are filled as -1
| Pixel properties | Quadrant properties | ||||||
|---|---|---|---|---|---|---|---|
| Quadrant | DetID | PixID | Counts | Sigma | Mean | Median | Sigma |
| A | 10 | 83 | 470135 | 3972.37 | 582 | 572 | 118.2 |
| A | 13 | 248 | 157437 | 1327.03 | 582 | 572 | 118.2 |
| A | 9 | 191 | 28062 | 232.55 | 582 | 572 | 118.2 |
| B | 7 | 202 | 682643 | 6244.01 | 578 | 565 | 109.2 |
| B | 4 | 170 | 60052 | 544.57 | 578 | 565 | 109.2 |
| B | 5 | 255 | 39970 | 360.73 | 578 | 565 | 109.2 |
| C | 15 | 214 | 216714 | 1673.46 | 561 | 565 | 129.2 |
| C | 0 | 10 | 45579 | 348.51 | 561 | 565 | 129.2 |
| C | 14 | 254 | 11926 | 87.96 | 561 | 565 | 129.2 |
| D | 2 | 250 | 536774 | 4180.12 | 514 | 500 | 128.3 |
| D | 12 | 227 | 293541 | 2284.18 | 514 | 500 | 128.3 |
| D | 12 | 191 | 173481 | 1348.34 | 514 | 500 | 128.3 |
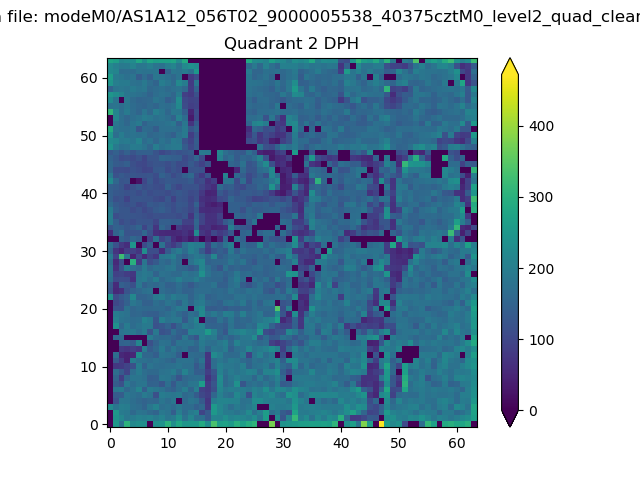
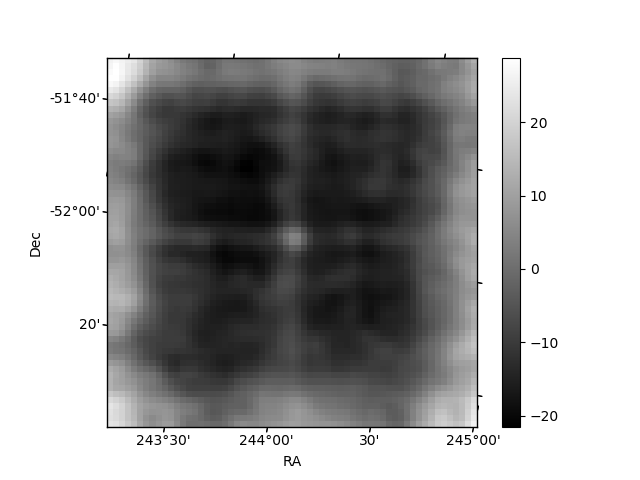
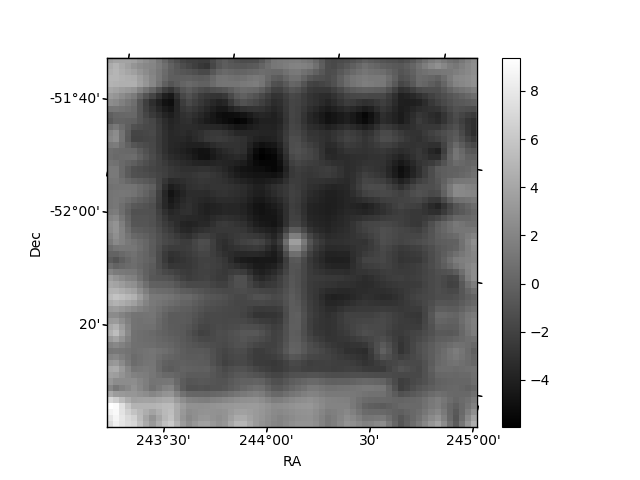
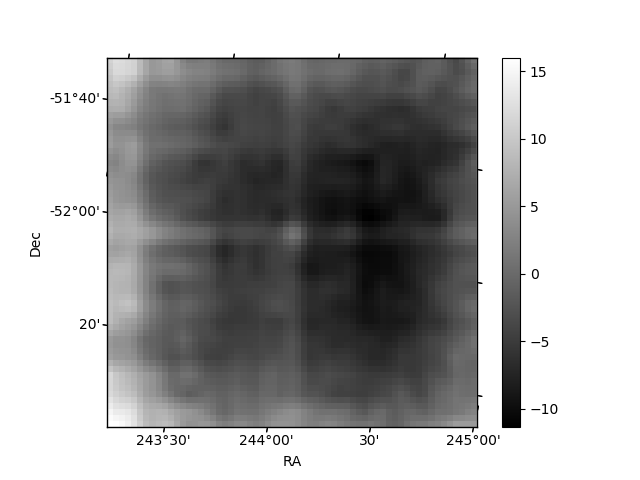
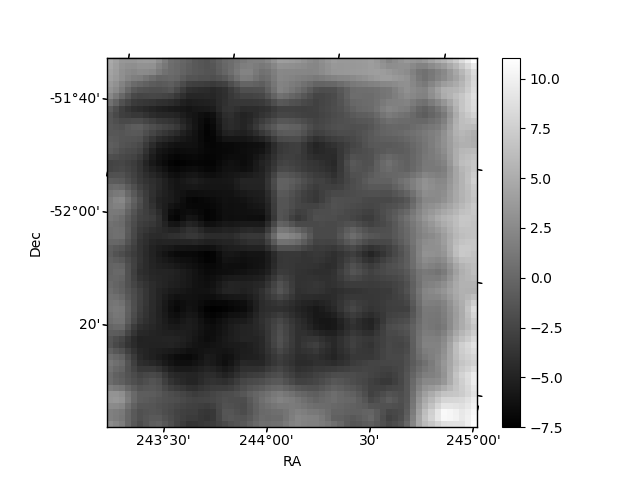
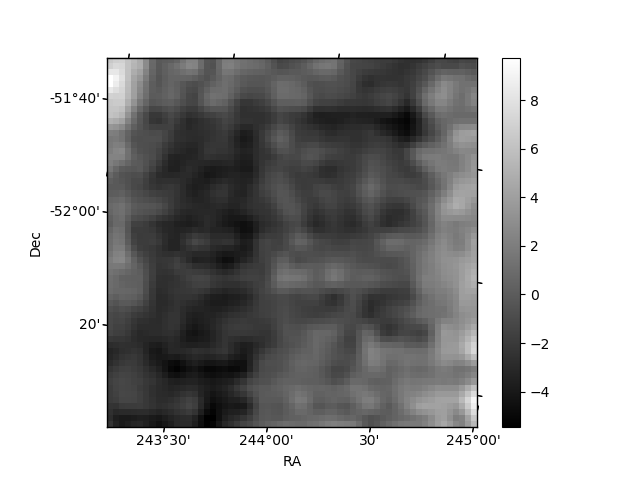
Histogram calculated using DETX and DETY for each event in the final _common_clean file
| Quadrant A | 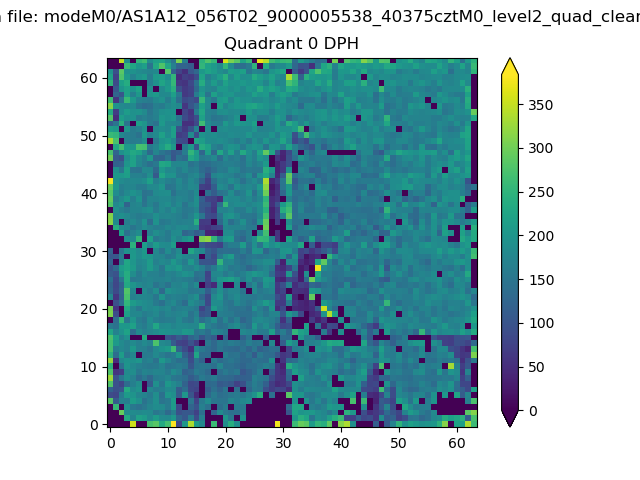 |
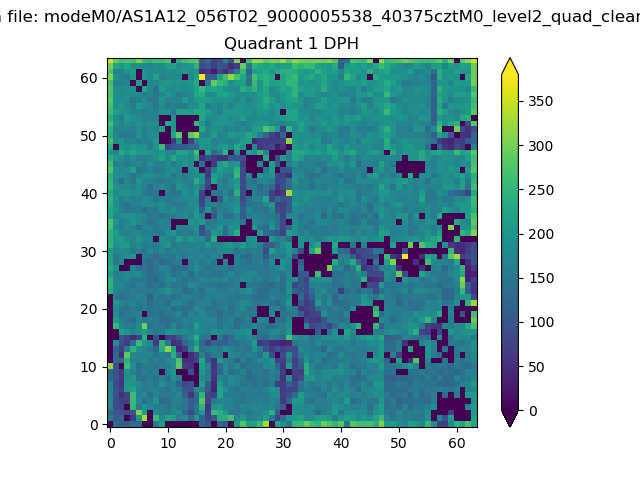 |
Quadrant B |
|---|---|---|---|
| Quadrant D | 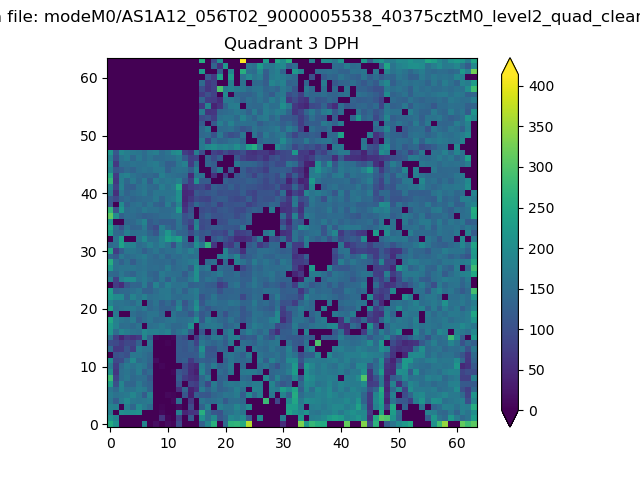 |
 |
Quadrant C |
| Plot type | Count rate plots | Images |
|---|---|---|
| Comparison with Poisson distribution Blue bars denote a histogram of data divided into 1 sec bins. Red curve is a Poisson curve with rate = median count rate of data. |
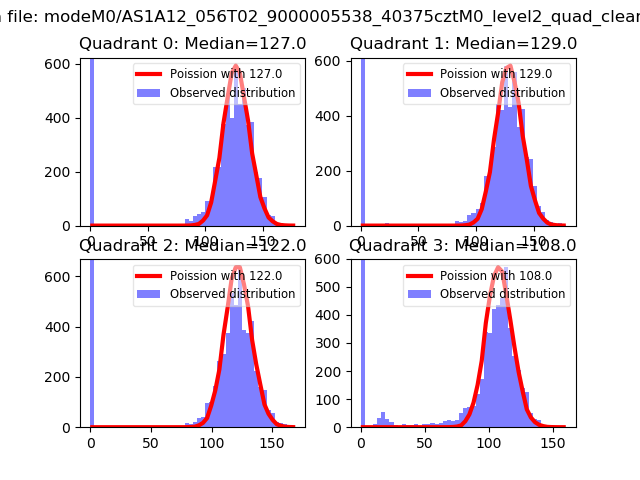 |
 |
| Quadrant-wise count rates Data is divided into 100 sec bins |
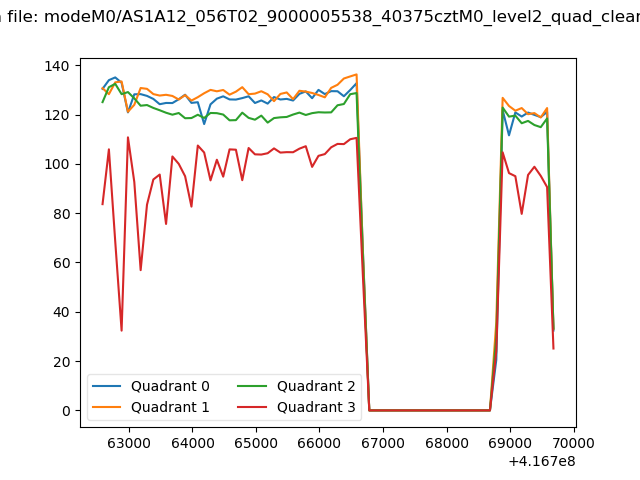 |
|
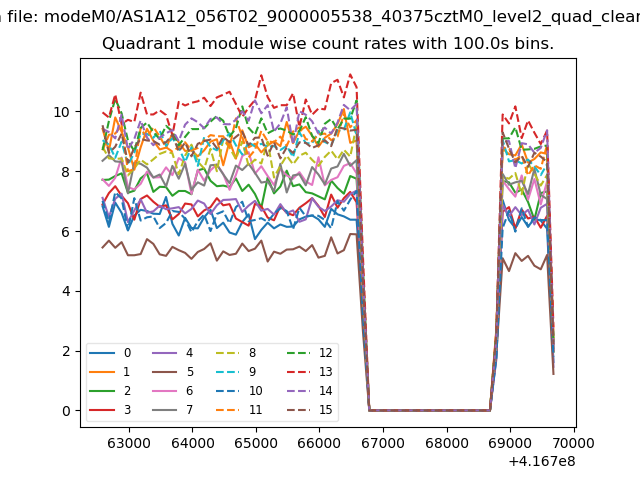
| Module-wise count rates for Quadrant A Data is divided into 100 sec bins |
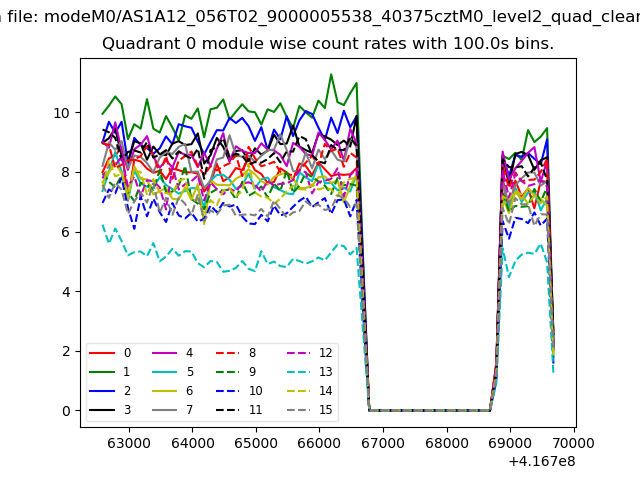 |
 |
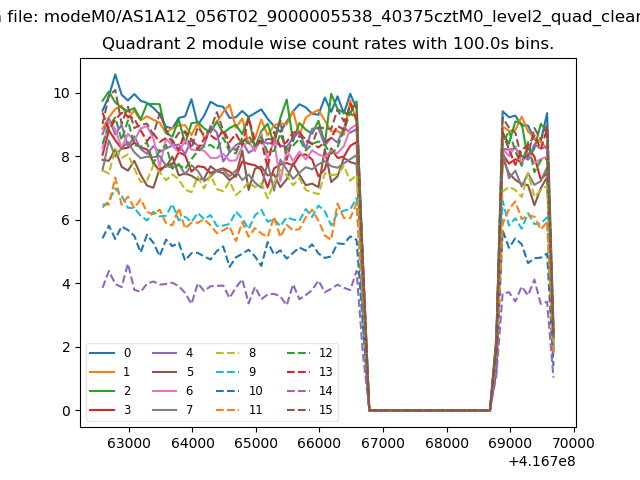
| Module-wise count rates for Quadrant B Data is divided into 100 sec bins |
 |
 |
| Module-wise count rates for Quadrant C Data is divided into 100 sec bins |
 |
 |
| Module-wise count rates for Quadrant D Data is divided into 100 sec bins |
 |
 |
| Parameter | Plot |
|---|---|
| CZT HV Monitor | 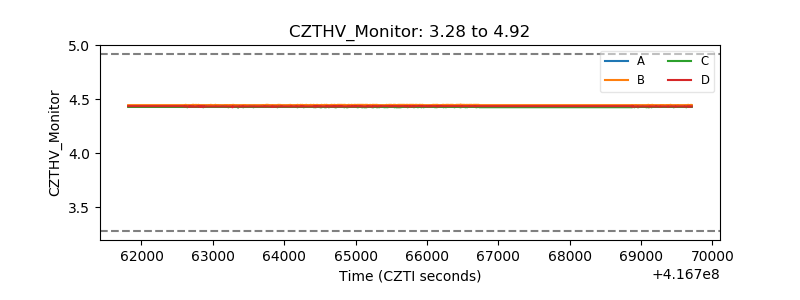 |
| D_VDD | 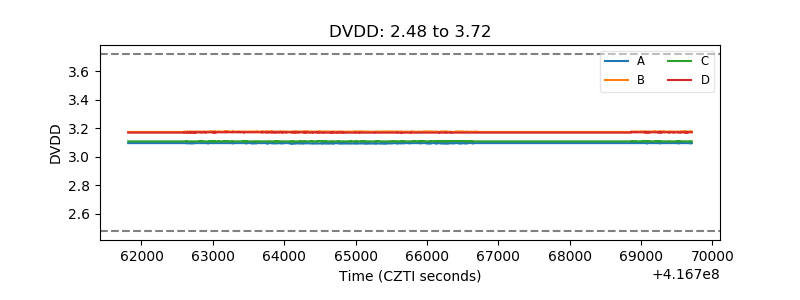 |
| Temperature 1 | 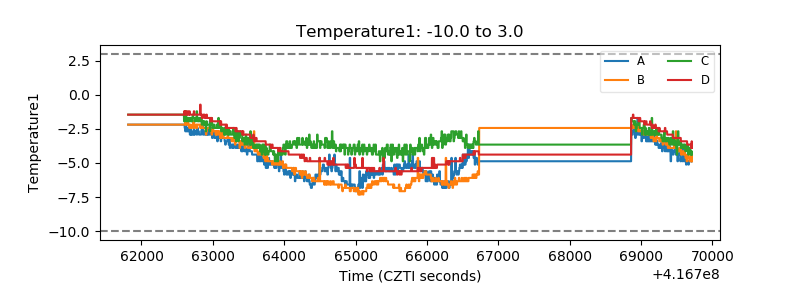 |
| Veto HV Monitor | 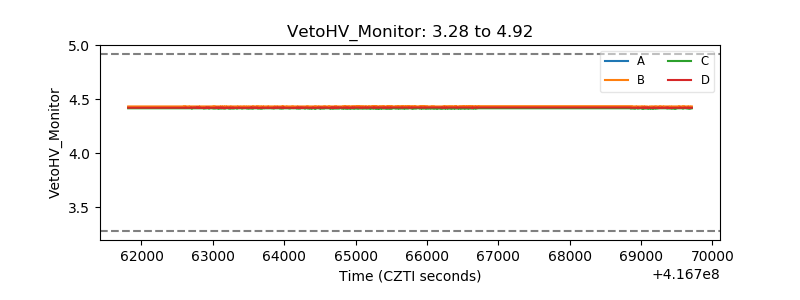 |
| Veto LLD | 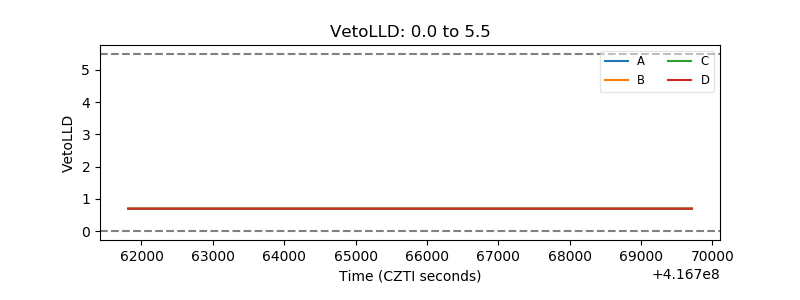 |
| Alpha Counter | 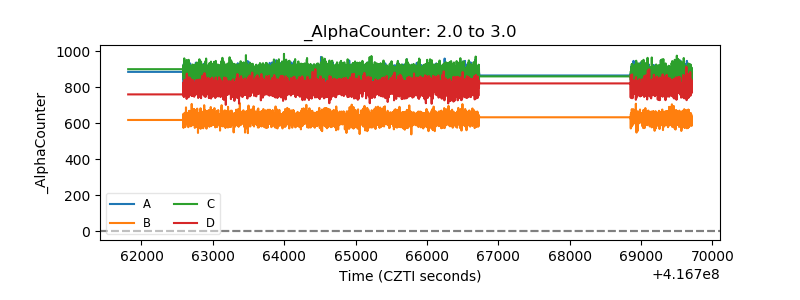 |
| _CPM_Rate | 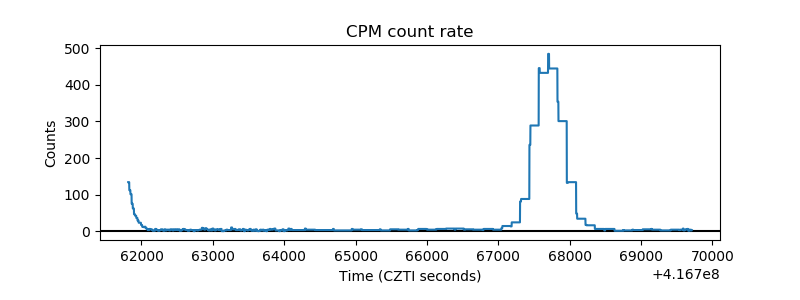 |
| CZT Counter | 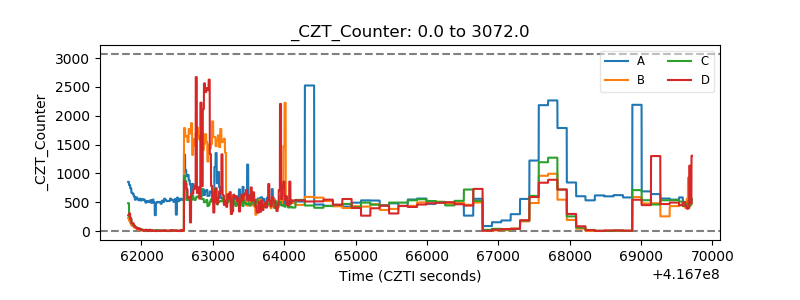 |
| +2.5 Volts monitor | 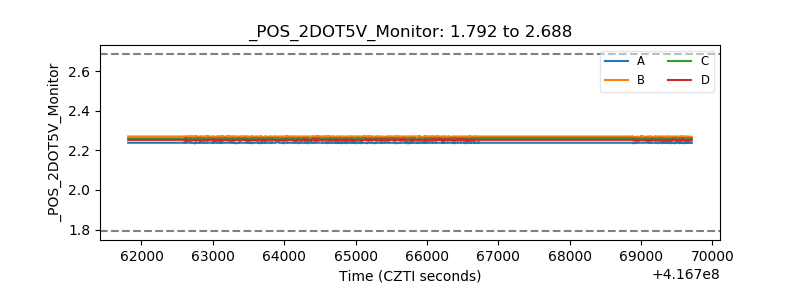 |
| +5 Volts monitor | 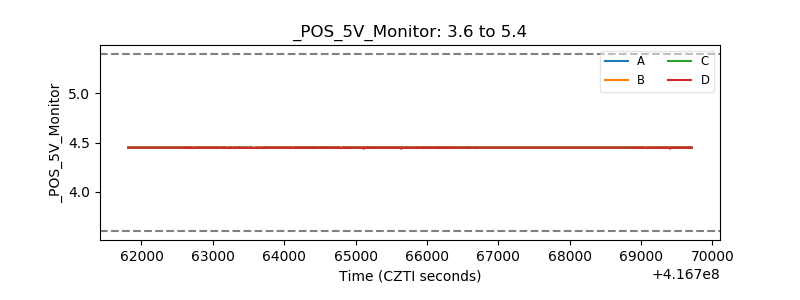 |
| _ROLL_ROT | 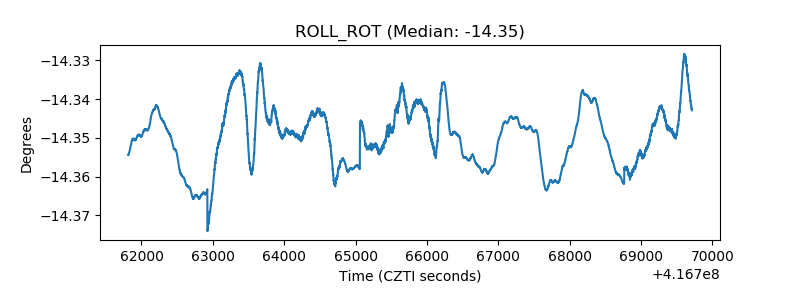 |
| _Roll_DEC | 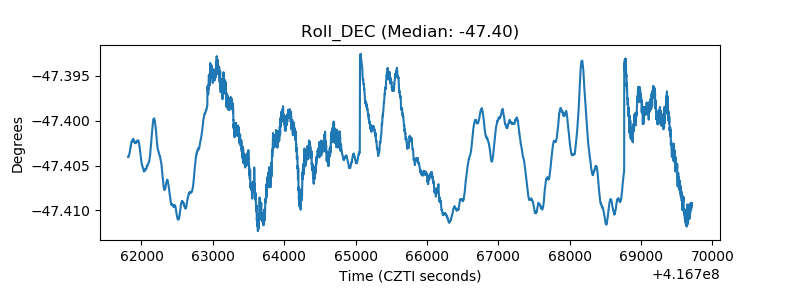 |
| _Roll_RA | 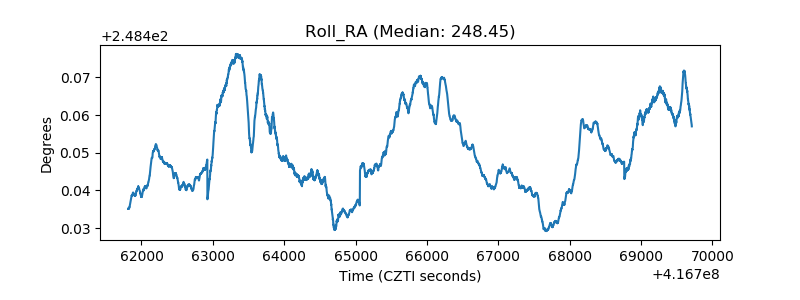 |
| Veto Counter | 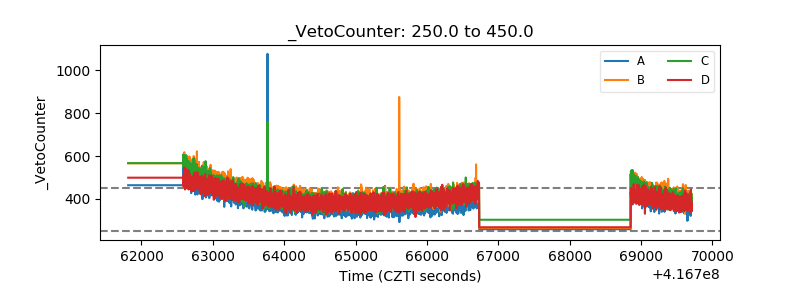 |