| Param | Original file | Final file |
|---|---|---|
| Filename | modeM0/AS1A12_056T02_9000005538_40376cztM0_level2.fits | modeM0/AS1A12_056T02_9000005538_40376cztM0_level2_quad_clean.evt |
| Size (bytes) | 507,836,160 | 149,313,600 |
| Size | 484.3 MB | 142.4 MB |
| Events in quadrant A | 4,730,194 | 1,038,393 |
| Events in quadrant B | 4,048,973 | 1,064,100 |
| Events in quadrant C | 4,074,561 | 999,768 |
| Events in quadrant D | 5,282,635 | 828,108 |
| Mode M0 | |||
|---|---|---|---|
| Quadrant | BADHDUFLAG | Total packets | Discarded packets |
| A | 0 | 19040 | 3 |
| B | 0 | 17558 | 2 |
| C | 0 | 17316 | 2 |
| D | 0 | 21392 | 2 |
| Mode M9 | |||
|---|---|---|---|
| Quadrant | BADHDUFLAG | Total packets | Discarded packets |
| A | 0 | 41 | 0 |
| B | 0 | 41 | 0 |
| C | 0 | 41 | 0 |
| D | 0 | 41 | 0 |
| Mode SS | |||
|---|---|---|---|
| Quadrant | BADHDUFLAG | Total packets | Discarded packets |
| A | 0 | 174 | 0 |
| B | 0 | 174 | 0 |
| C | 0 | 174 | 0 |
| D | 0 | 174 | 0 |
| Quadrant | Total seconds | Saturated seconds | Saturation percentage |
|---|---|---|---|
| A | 8511 | 80 | 0.939960% |
| B | 8511 | 20 | 0.234990% |
| C | 8511 | 12 | 0.140994% |
| D | 8511 | 1103 | 12.959699% |
Noise dominated data is calculated using 1-second bins in cleaned event files. If a bin has >2000 counts, and if more than 50% of those come from <1% of pixels, then it is considered to be noise-dominated and hence unusable.
| Quadrant | # 1 sec bins | Bins with >0 counts | Bins with >2000 counts | High rate bins dominated by noise | Noise dominated (total time) | Noise dominated (detector-on time) | Marked lightcurve |
|---|---|---|---|---|---|---|---|
| A | 12636 | 8513 | 50 | 50 | 0.40% | 0.59% | 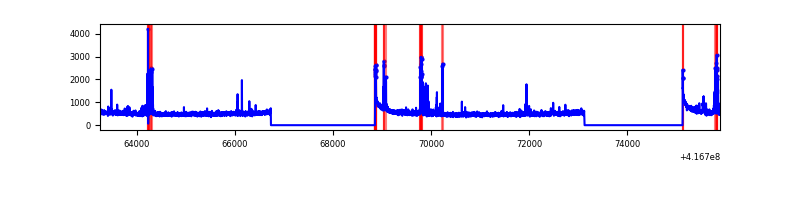 |
| B | 12636 | 8513 | 8 | 8 | 0.06% | 0.09% | 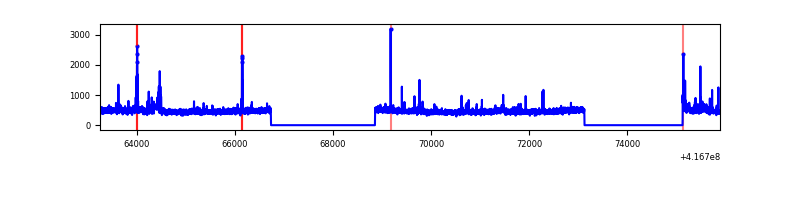 |
| C | 12636 | 8513 | 10 | 10 | 0.08% | 0.12% | 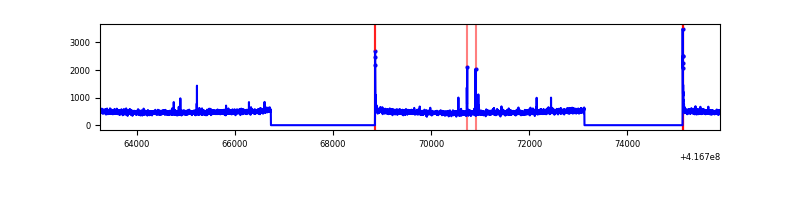 |
| D | 12636 | 8511 | 224 | 224 | 1.77% | 2.63% | 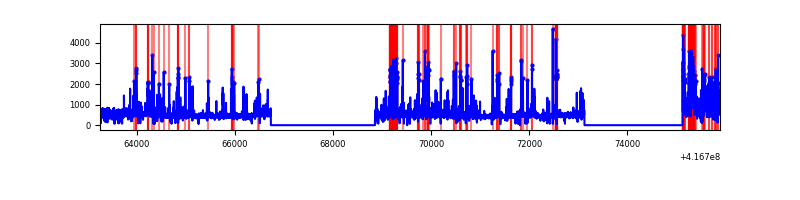 |
Top three noisy pixels from each quadrant. If the there are fewer than three noisy pixels in the level2.evt file, extra rows are filled as -1
| Pixel properties | Quadrant properties | ||||||
|---|---|---|---|---|---|---|---|
| Quadrant | DetID | PixID | Counts | Sigma | Mean | Median | Sigma |
| A | 10 | 83 | 662391 | 3422.7 | 956 | 942 | 193.3 |
| A | 13 | 248 | 274755 | 1416.86 | 956 | 942 | 193.3 |
| A | 6 | 10 | 40963 | 207.09 | 956 | 942 | 193.3 |
| B | 4 | 170 | 65655 | 361.13 | 956 | 934 | 179.2 |
| B | 0 | 230 | 51754 | 283.56 | 956 | 934 | 179.2 |
| B | 7 | 202 | 50973 | 279.2 | 956 | 934 | 179.2 |
| C | 15 | 214 | 359922 | 1688.24 | 931 | 939 | 212.6 |
| C | 0 | 10 | 42791 | 196.82 | 931 | 939 | 212.6 |
| C | 14 | 254 | 32898 | 150.3 | 931 | 939 | 212.6 |
| D | 12 | 227 | 872486 | 4078.37 | 864 | 843 | 213.7 |
| D | 2 | 250 | 373189 | 1742.19 | 864 | 843 | 213.7 |
| D | 12 | 191 | 267818 | 1249.16 | 864 | 843 | 213.7 |
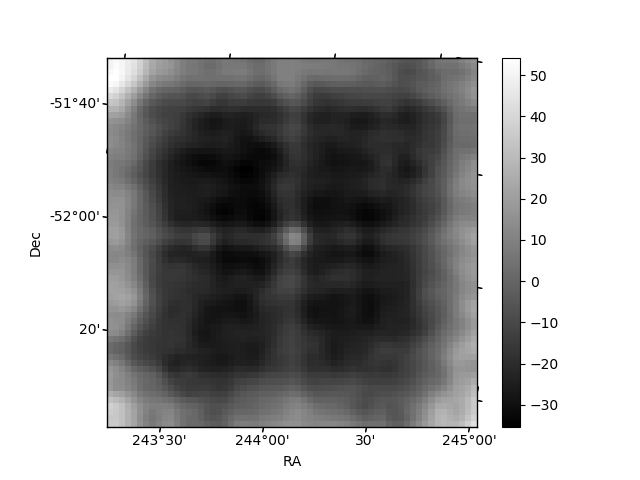
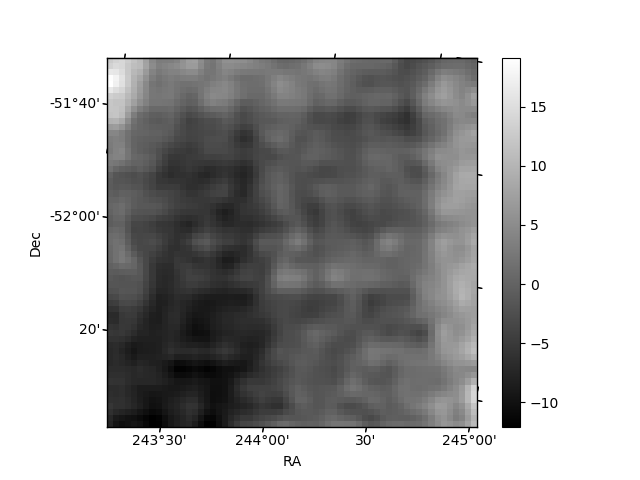
Histogram calculated using DETX and DETY for each event in the final _common_clean file
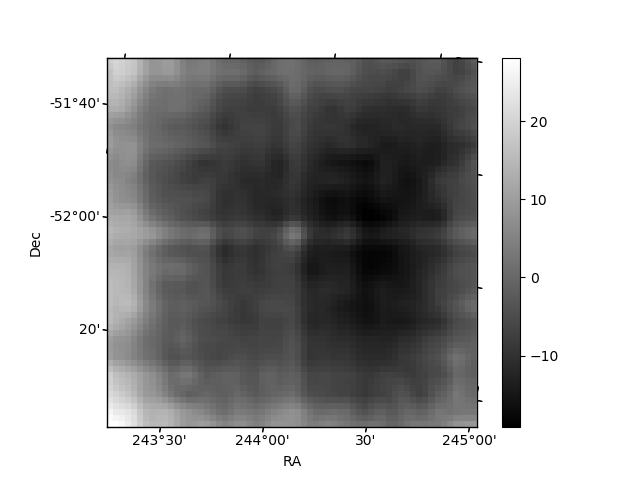
| Quadrant A | 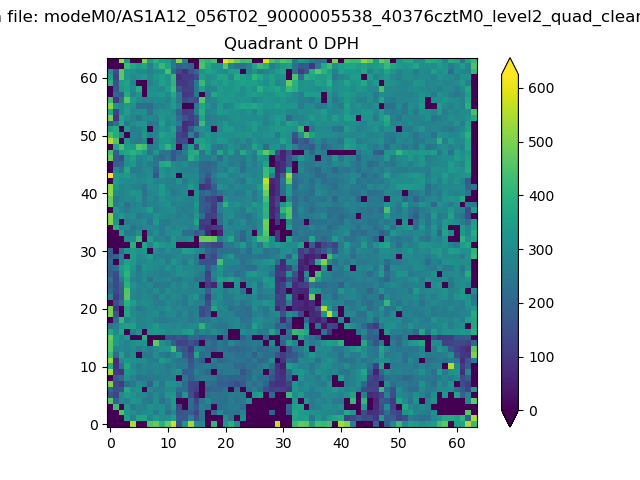 |
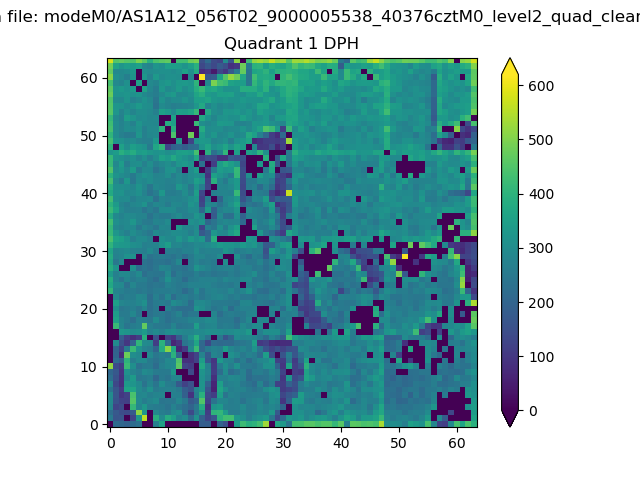 |
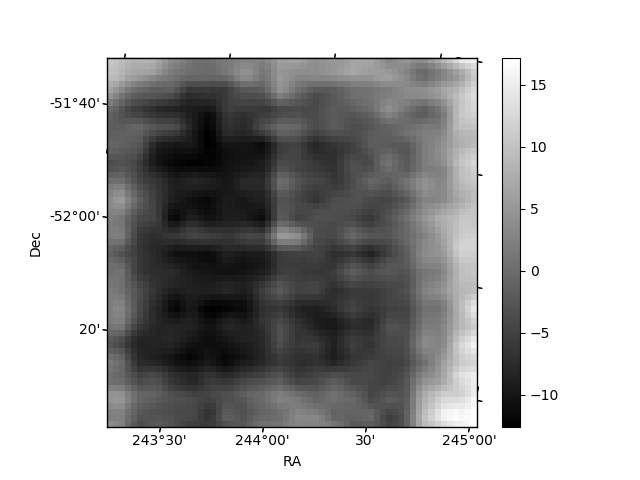
Quadrant B |
|---|---|---|---|
| Quadrant D | 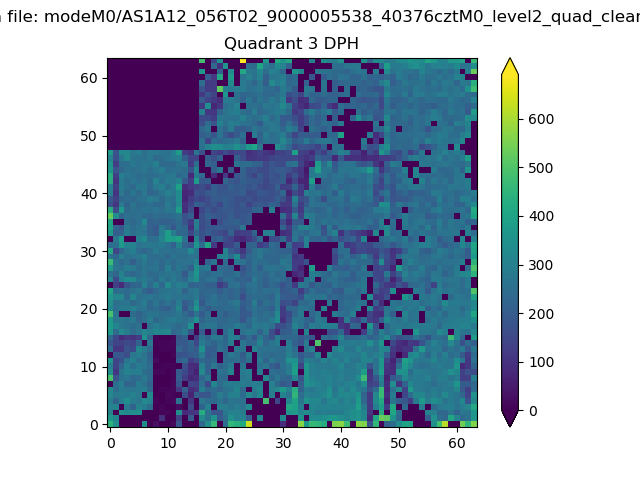 |
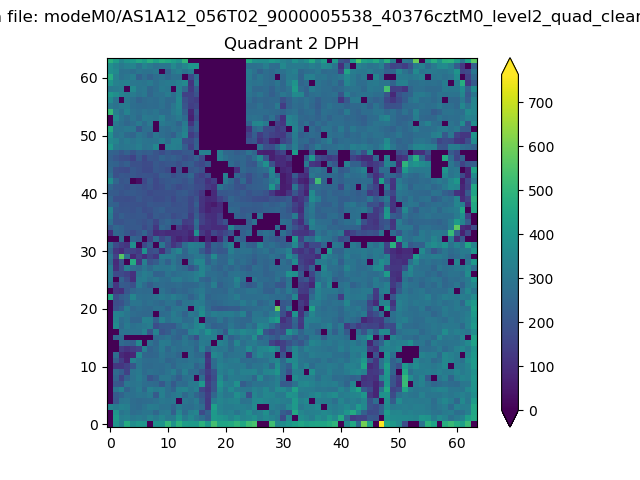 |
Quadrant C |
| Plot type | Count rate plots | Images |
|---|---|---|
| Comparison with Poisson distribution Blue bars denote a histogram of data divided into 1 sec bins. Red curve is a Poisson curve with rate = median count rate of data. |
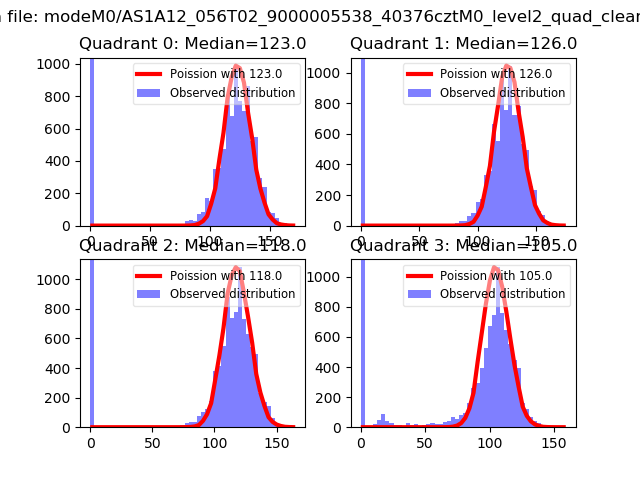 |
 |
| Quadrant-wise count rates Data is divided into 100 sec bins |
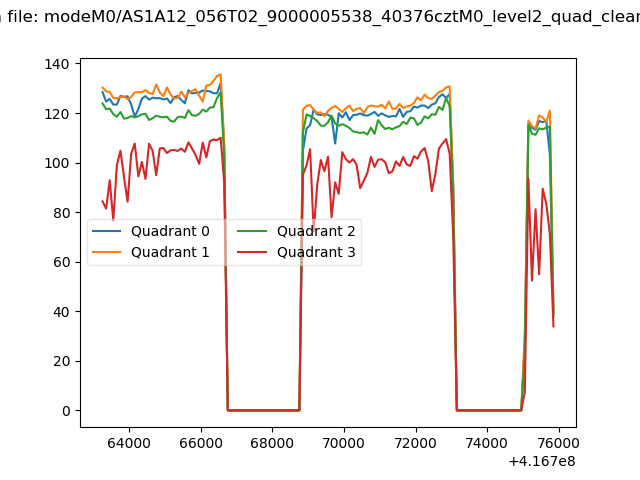 |
|
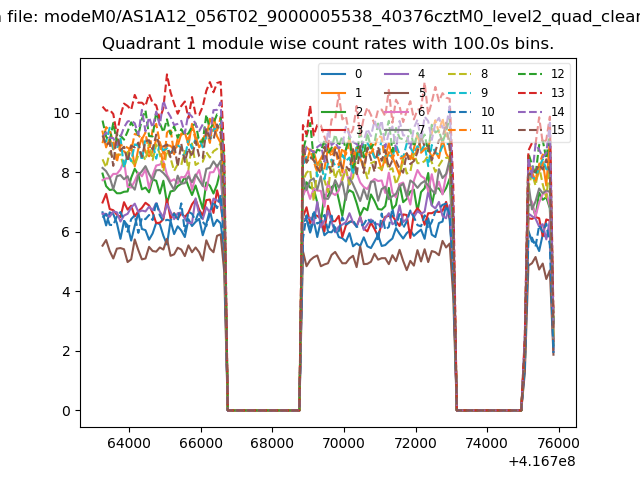
| Module-wise count rates for Quadrant A Data is divided into 100 sec bins |
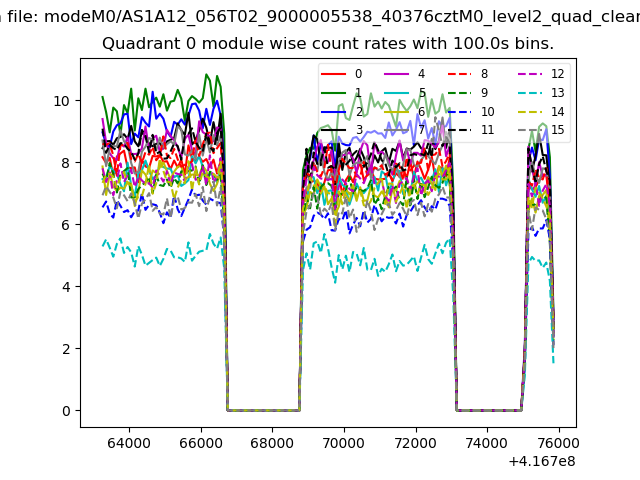 |
 |
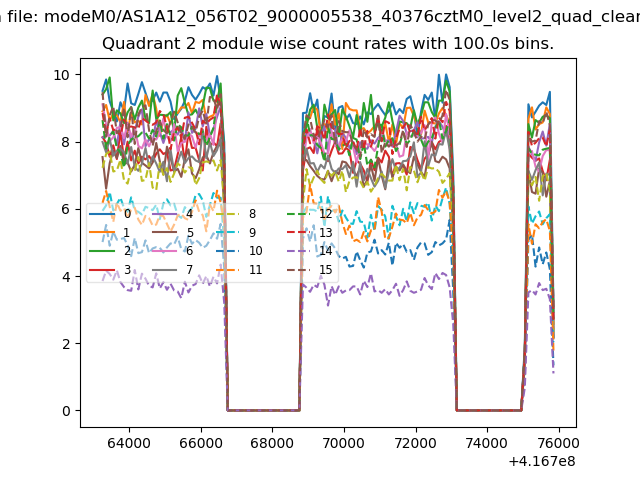
| Module-wise count rates for Quadrant B Data is divided into 100 sec bins |
 |
 |
| Module-wise count rates for Quadrant C Data is divided into 100 sec bins |
 |
 |
| Module-wise count rates for Quadrant D Data is divided into 100 sec bins |
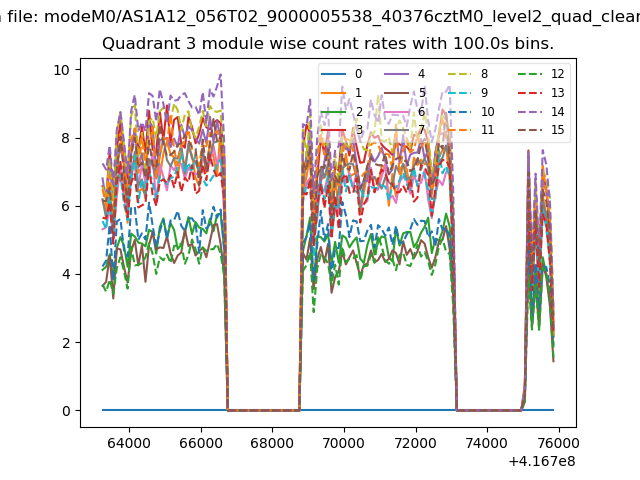 |
 |
| Parameter | Plot |
|---|---|
| CZT HV Monitor | 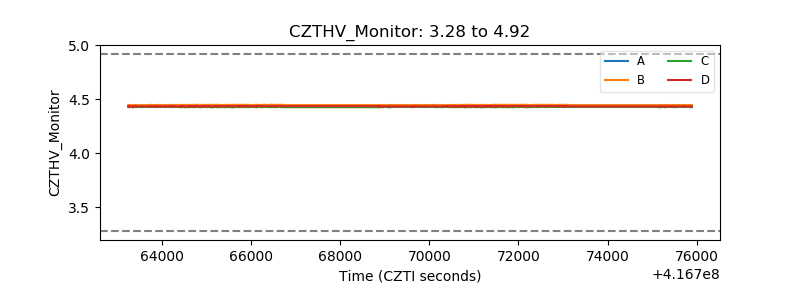 |
| D_VDD | 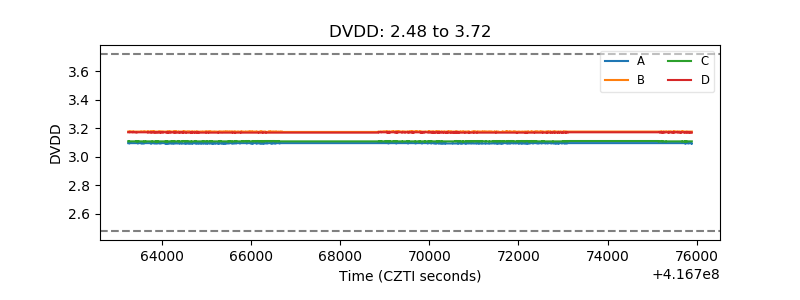 |
| Temperature 1 | 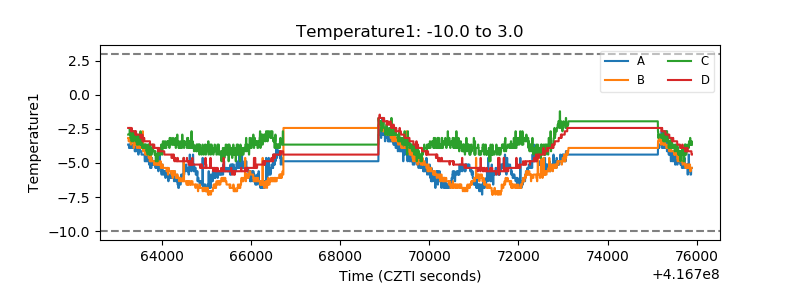 |
| Veto HV Monitor | 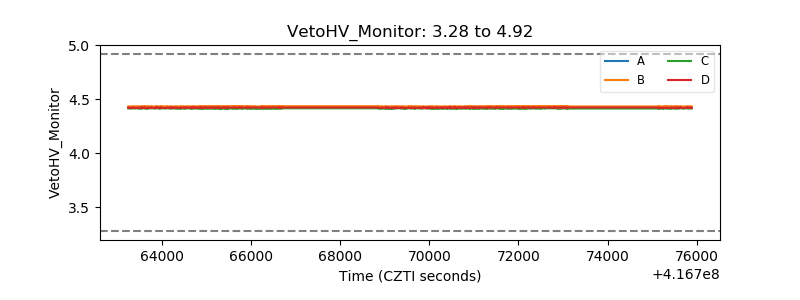 |
| Veto LLD | 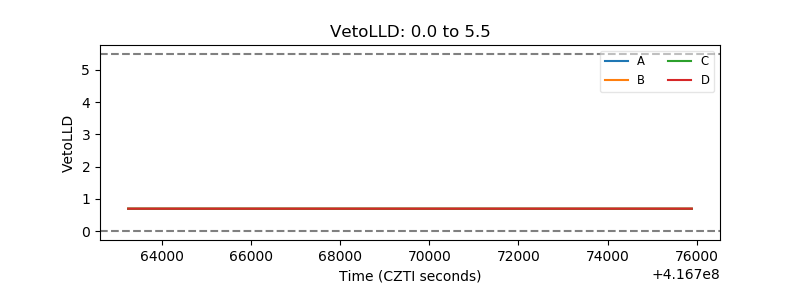 |
| Alpha Counter | 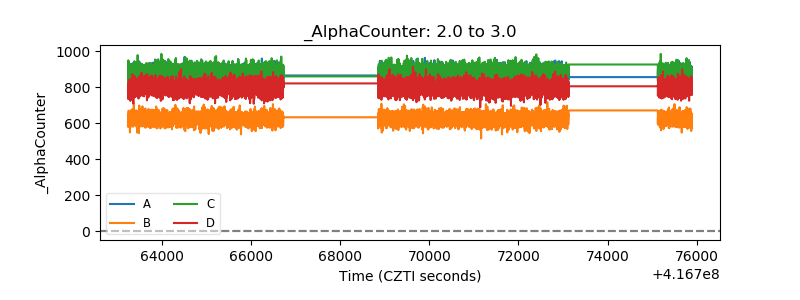 |
| _CPM_Rate | 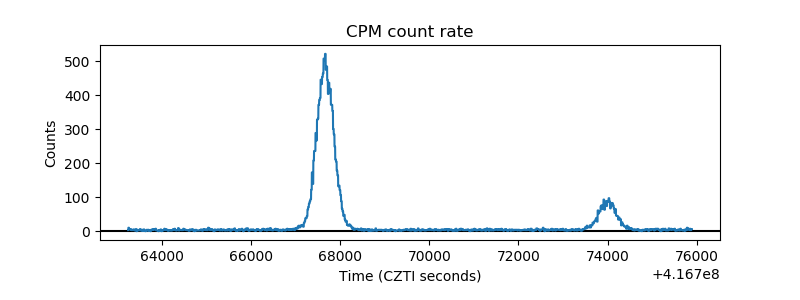 |
| CZT Counter | 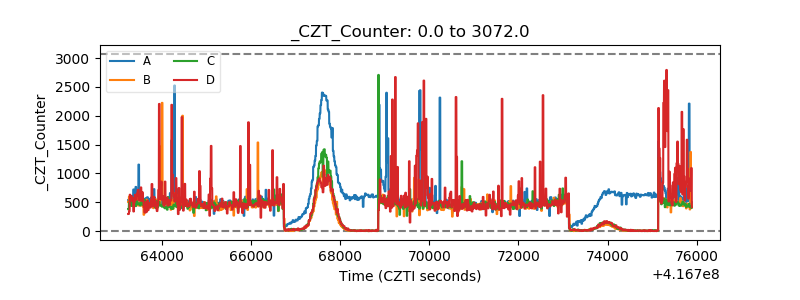 |
| +2.5 Volts monitor | 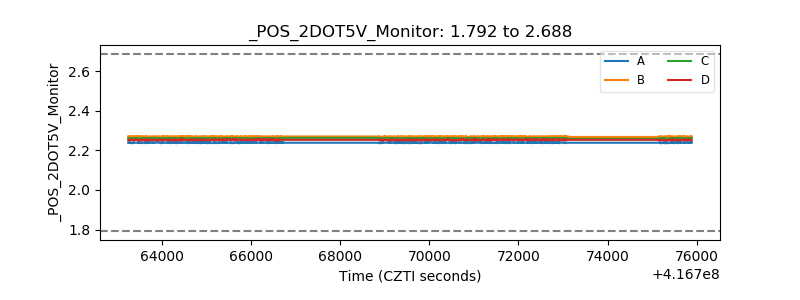 |
| +5 Volts monitor | 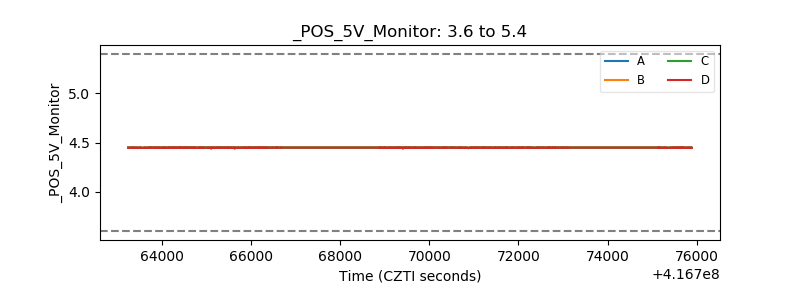 |
| _ROLL_ROT | 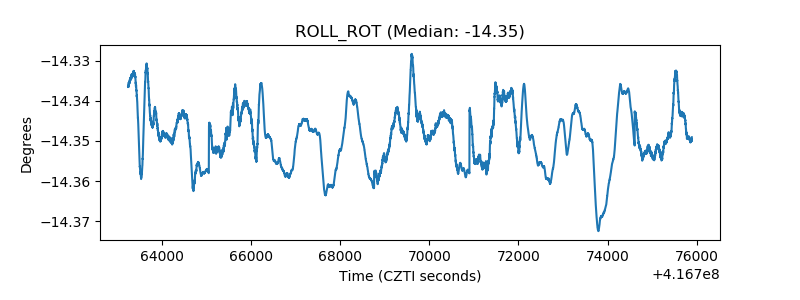 |
| _Roll_DEC |  |
| _Roll_RA | 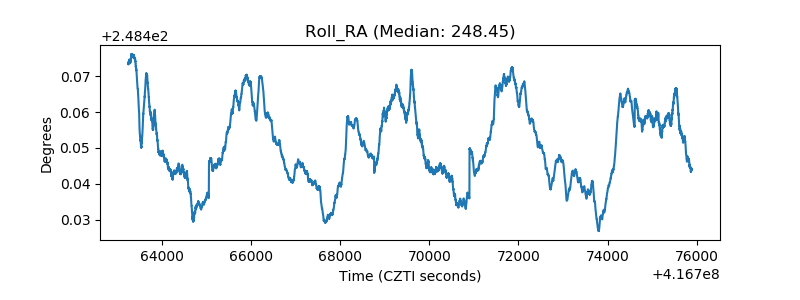 |
| Veto Counter | 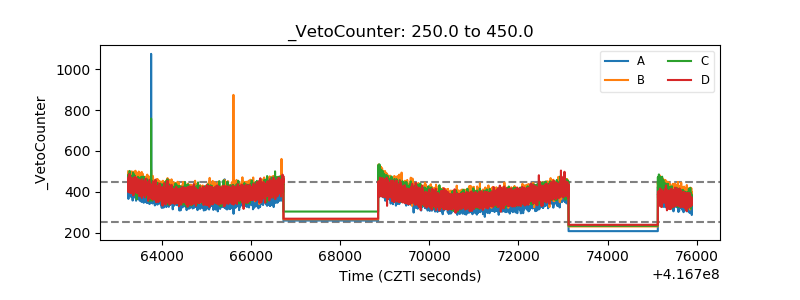 |