| Param | Original file | Final file |
|---|---|---|
| Filename | modeM0/AS1A12_056T02_9000005538_40377cztM0_level2.fits | modeM0/AS1A12_056T02_9000005538_40377cztM0_level2_quad_clean.evt |
| Size (bytes) | 379,817,280 | 90,604,800 |
| Size | 362.2 MB | 86.4 MB |
| Events in quadrant A | 3,158,318 | 634,484 |
| Events in quadrant B | 2,502,337 | 649,202 |
| Events in quadrant C | 2,666,285 | 614,246 |
| Events in quadrant D | 5,309,971 | 465,784 |
| Mode M0 | |||
|---|---|---|---|
| Quadrant | BADHDUFLAG | Total packets | Discarded packets |
| A | 0 | 12797 | 3 |
| B | 0 | 11207 | 5 |
| C | 0 | 11319 | 2 |
| D | 0 | 19483 | 2 |
| Mode M9 | |||
|---|---|---|---|
| Quadrant | BADHDUFLAG | Total packets | Discarded packets |
| A | 0 | 36 | 0 |
| B | 0 | 36 | 0 |
| C | 0 | 36 | 0 |
| D | 0 | 36 | 0 |
| Mode SS | |||
|---|---|---|---|
| Quadrant | BADHDUFLAG | Total packets | Discarded packets |
| A | 0 | 110 | 0 |
| B | 0 | 110 | 0 |
| C | 0 | 110 | 0 |
| D | 0 | 110 | 0 |
| Quadrant | Total seconds | Saturated seconds | Saturation percentage |
|---|---|---|---|
| A | 5425 | 38 | 0.700461% |
| B | 5423 | 12 | 0.221280% |
| C | 5425 | 28 | 0.516129% |
| D | 5425 | 1173 | 21.622120% |
Noise dominated data is calculated using 1-second bins in cleaned event files. If a bin has >2000 counts, and if more than 50% of those come from <1% of pixels, then it is considered to be noise-dominated and hence unusable.
| Quadrant | # 1 sec bins | Bins with >0 counts | Bins with >2000 counts | High rate bins dominated by noise | Noise dominated (total time) | Noise dominated (detector-on time) | Marked lightcurve |
|---|---|---|---|---|---|---|---|
| A | 7127 | 5426 | 23 | 23 | 0.32% | 0.42% | 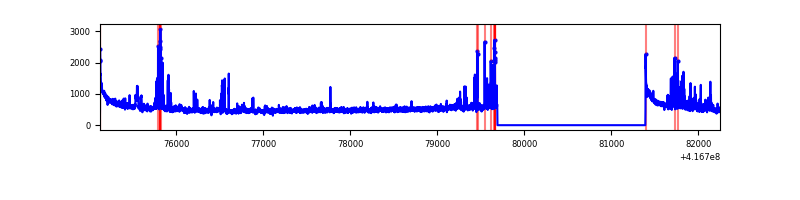 |
| B | 7127 | 5425 | 9 | 9 | 0.13% | 0.17% | 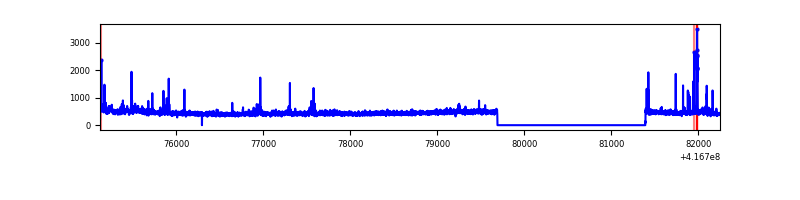 |
| C | 7127 | 5426 | 23 | 23 | 0.32% | 0.42% | 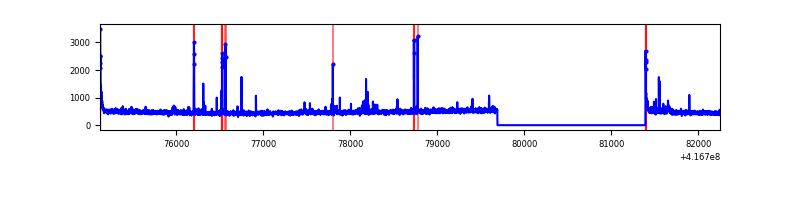 |
| D | 7127 | 5426 | 590 | 590 | 8.28% | 10.87% | 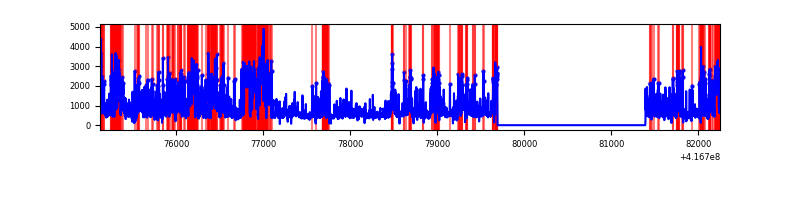 |
Top three noisy pixels from each quadrant. If the there are fewer than three noisy pixels in the level2.evt file, extra rows are filled as -1
| Pixel properties | Quadrant properties | ||||||
|---|---|---|---|---|---|---|---|
| Quadrant | DetID | PixID | Counts | Sigma | Mean | Median | Sigma |
| A | 10 | 83 | 480009 | 3908.34 | 595 | 585 | 122.7 |
| A | 13 | 248 | 203051 | 1650.53 | 595 | 585 | 122.7 |
| A | 6 | 10 | 113575 | 921.11 | 595 | 585 | 122.7 |
| B | 5 | 255 | 62418 | 537.22 | 594 | 579 | 115.1 |
| B | 4 | 171 | 56402 | 484.96 | 594 | 579 | 115.1 |
| B | 0 | 230 | 29221 | 248.82 | 594 | 579 | 115.1 |
| C | 15 | 214 | 234804 | 1724.53 | 583 | 589 | 135.8 |
| C | 14 | 254 | 83918 | 613.55 | 583 | 589 | 135.8 |
| C | 0 | 10 | 47695 | 346.84 | 583 | 589 | 135.8 |
| D | 12 | 227 | 2153205 | 16525.62 | 529 | 516 | 130.3 |
| D | 2 | 250 | 399712 | 3064.52 | 529 | 516 | 130.3 |
| D | 9 | 19 | 262517 | 2011.31 | 529 | 516 | 130.3 |
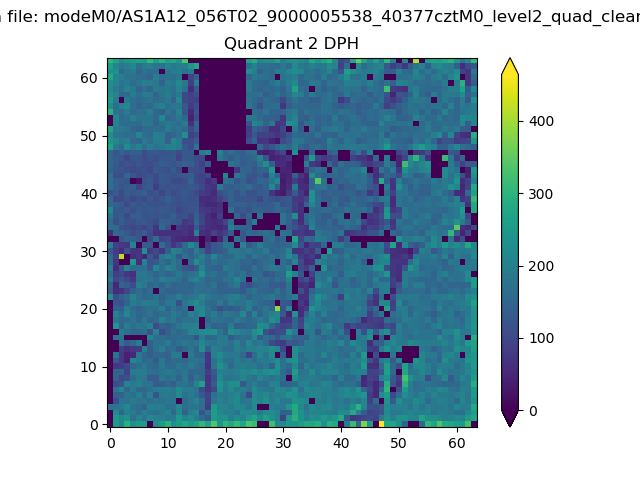
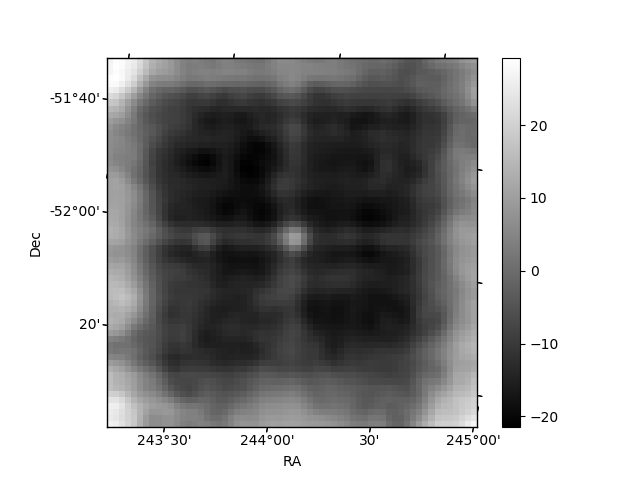
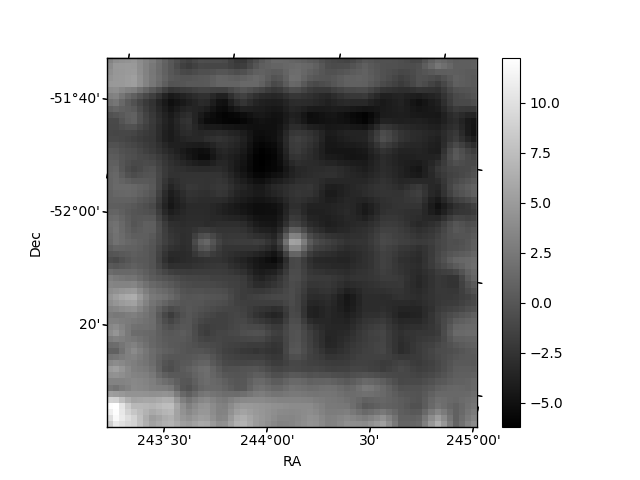
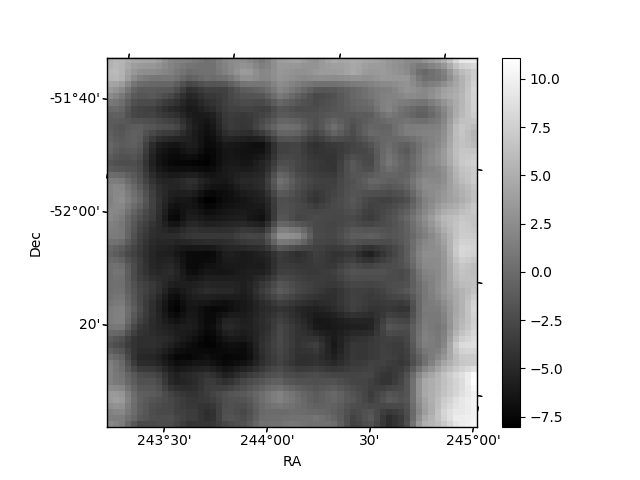
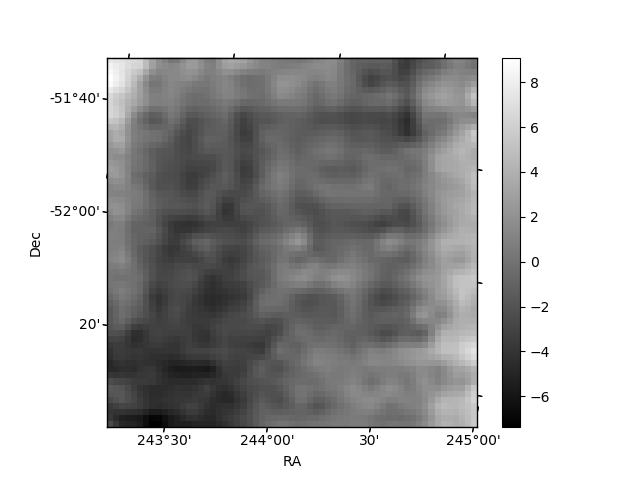
Histogram calculated using DETX and DETY for each event in the final _common_clean file
| Quadrant A | 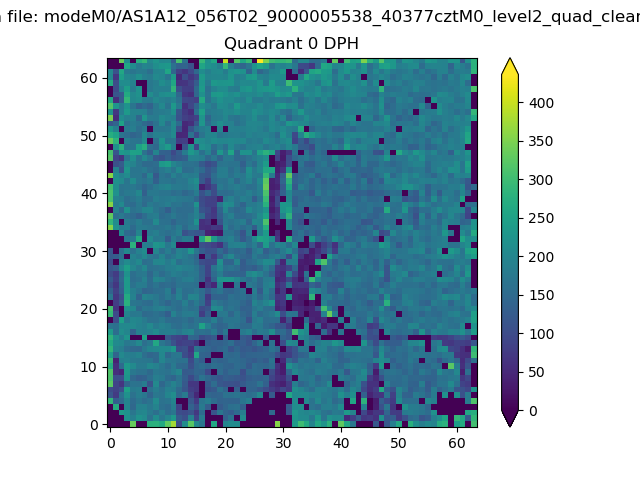 |
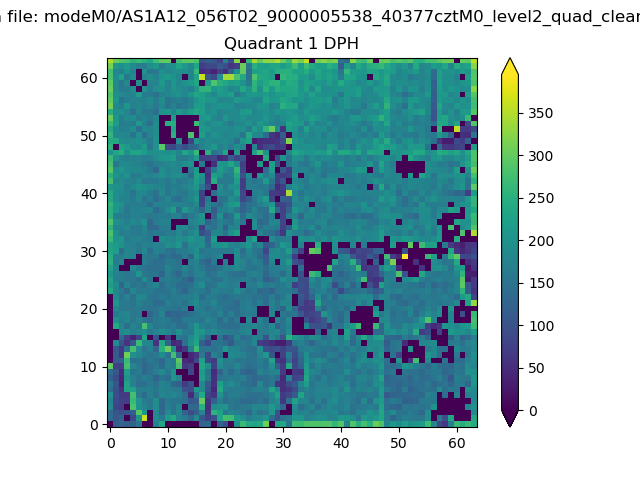 |
Quadrant B |
|---|---|---|---|
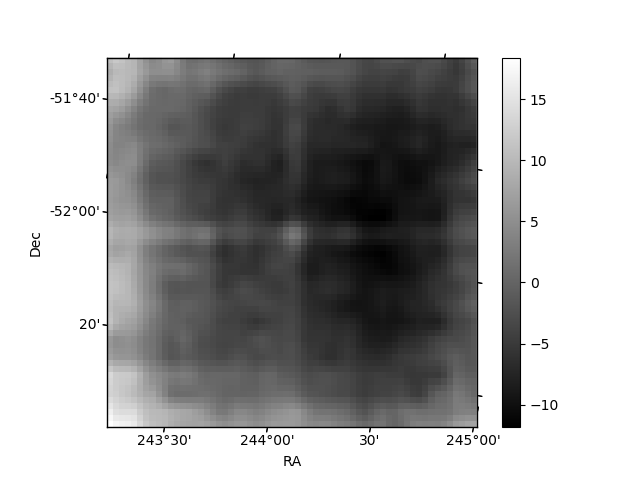
| Quadrant D | 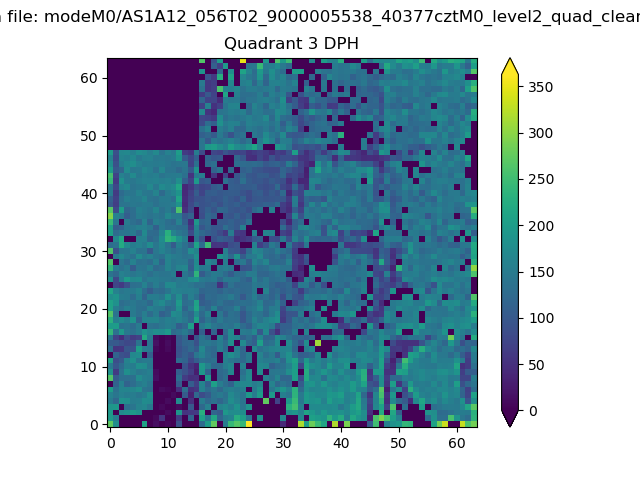 |
 |
Quadrant C |
| Plot type | Count rate plots | Images |
|---|---|---|
| Comparison with Poisson distribution Blue bars denote a histogram of data divided into 1 sec bins. Red curve is a Poisson curve with rate = median count rate of data. |
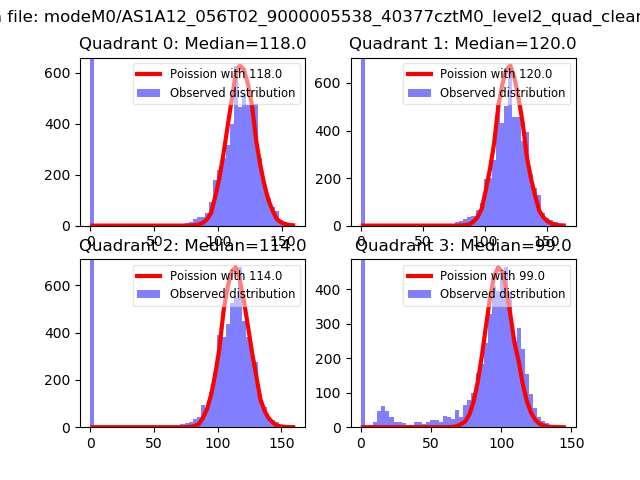 |
 |
| Quadrant-wise count rates Data is divided into 100 sec bins |
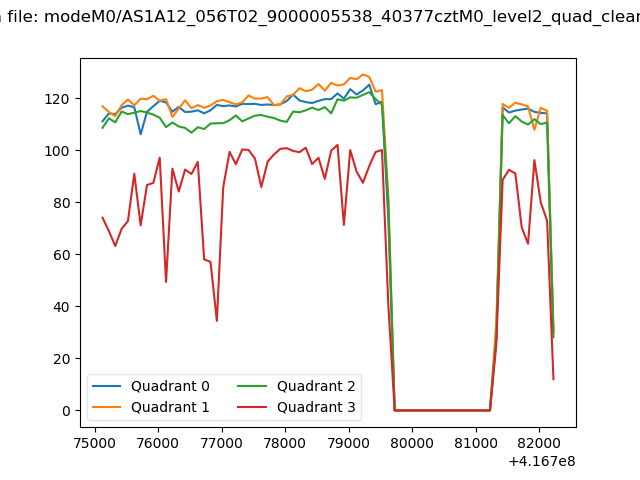 |
|
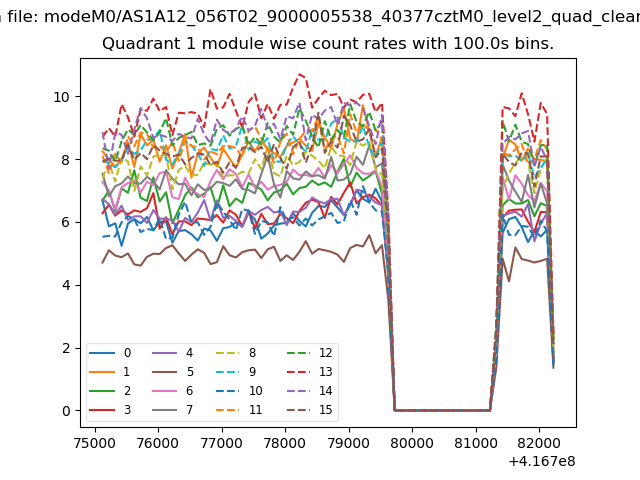
| Module-wise count rates for Quadrant A Data is divided into 100 sec bins |
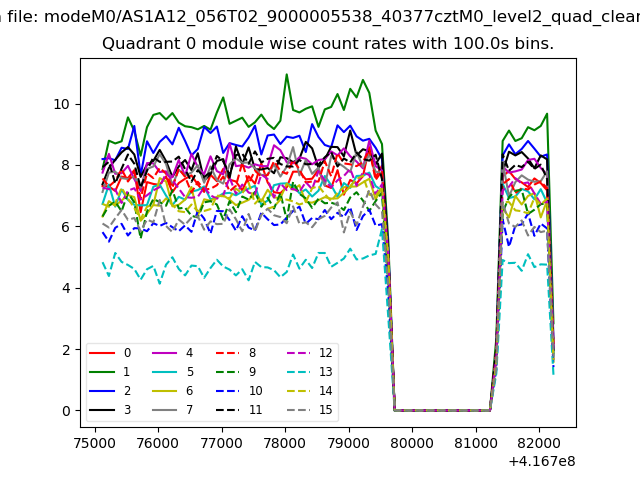 |
 |
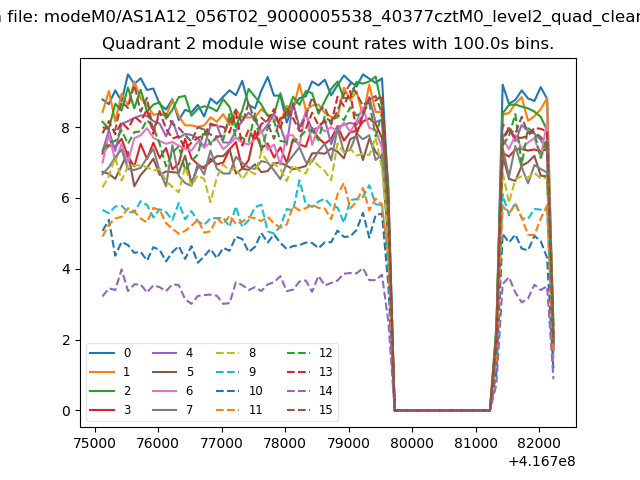
| Module-wise count rates for Quadrant B Data is divided into 100 sec bins |
 |
 |
| Module-wise count rates for Quadrant C Data is divided into 100 sec bins |
 |
 |
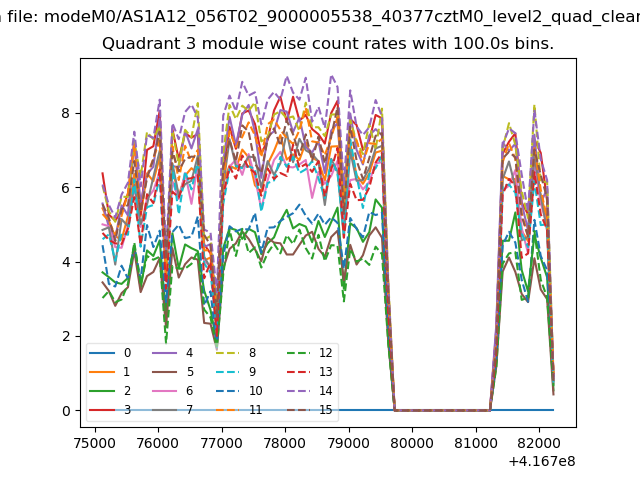
| Module-wise count rates for Quadrant D Data is divided into 100 sec bins |
 |
 |
| Parameter | Plot |
|---|---|
| CZT HV Monitor |  |
| D_VDD | 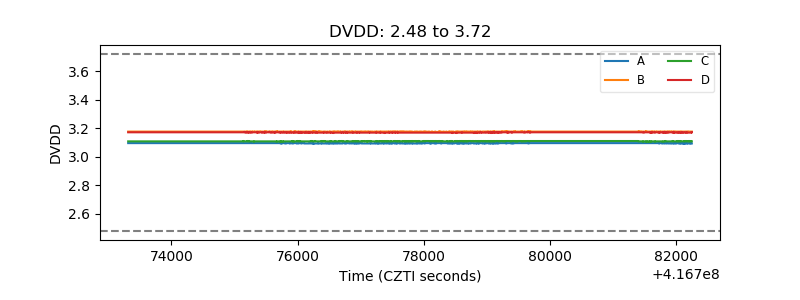 |
| Temperature 1 | 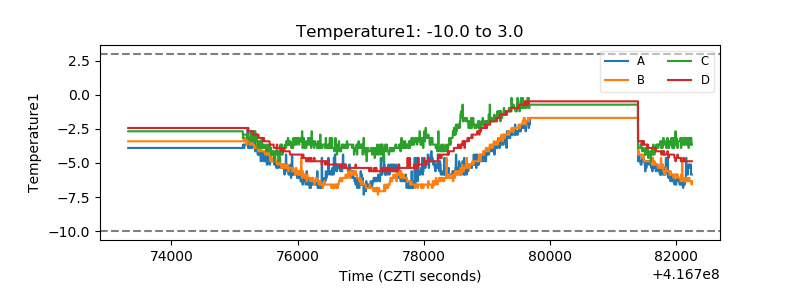 |
| Veto HV Monitor | 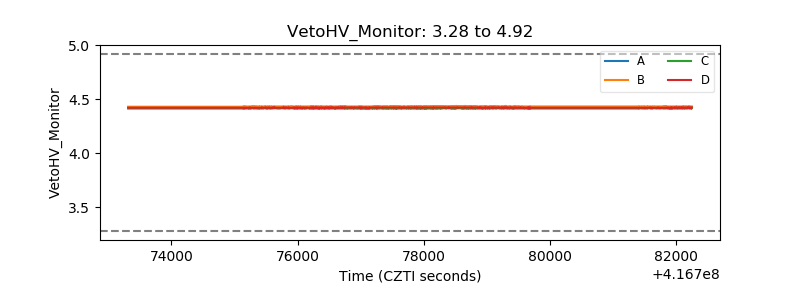 |
| Veto LLD | 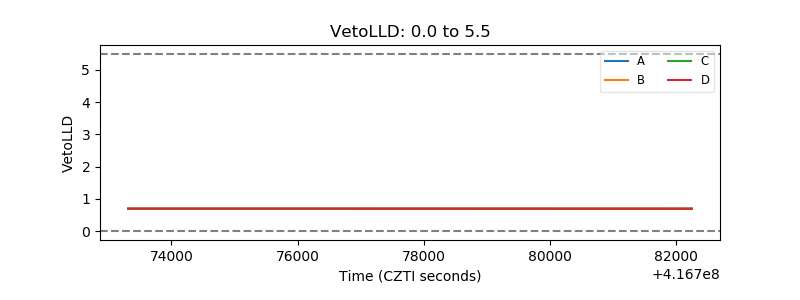 |
| Alpha Counter | 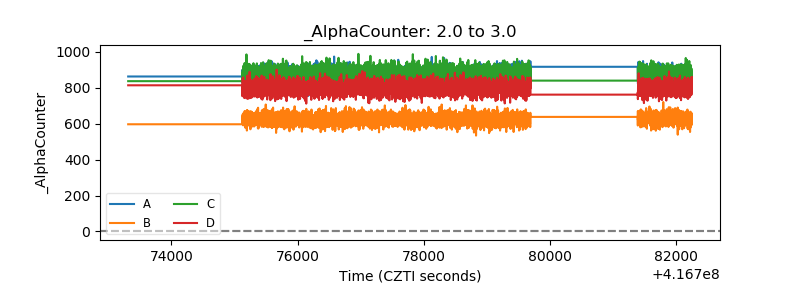 |
| _CPM_Rate | 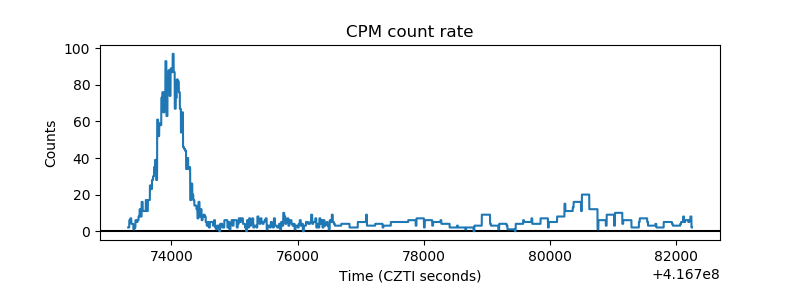 |
| CZT Counter | 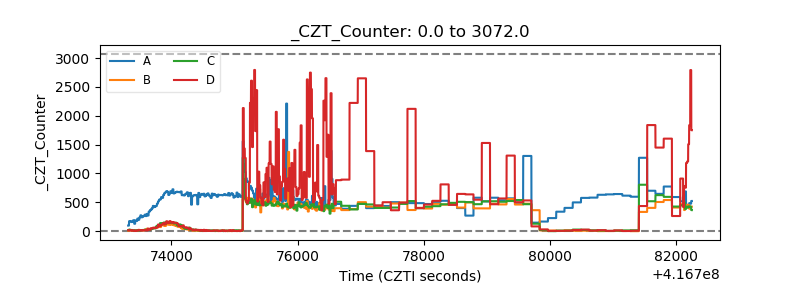 |
| +2.5 Volts monitor | 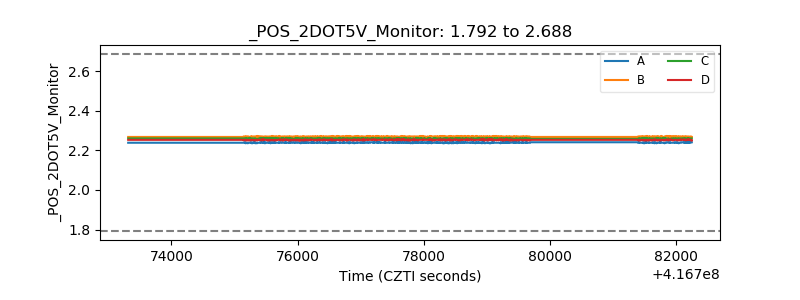 |
| +5 Volts monitor | 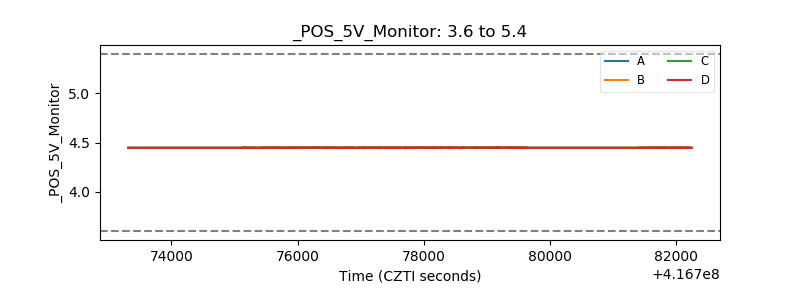 |
| _ROLL_ROT | 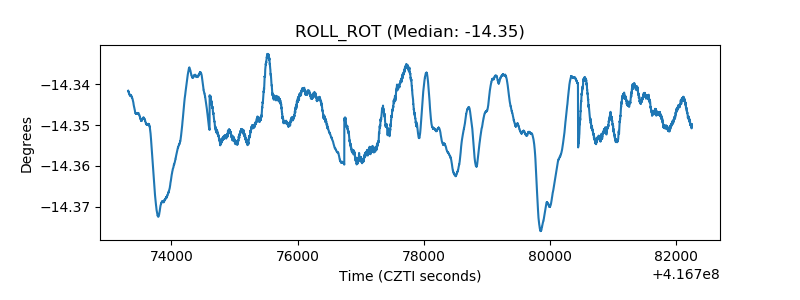 |
| _Roll_DEC | 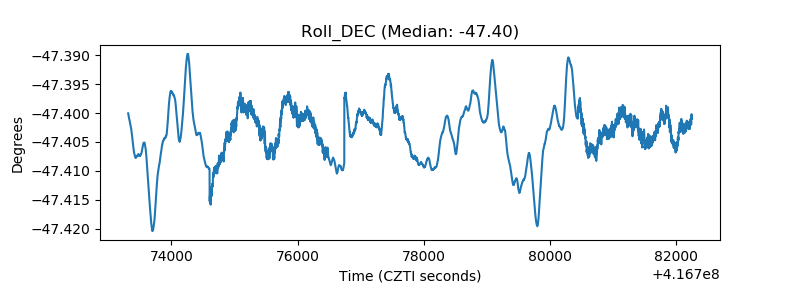 |
| _Roll_RA | 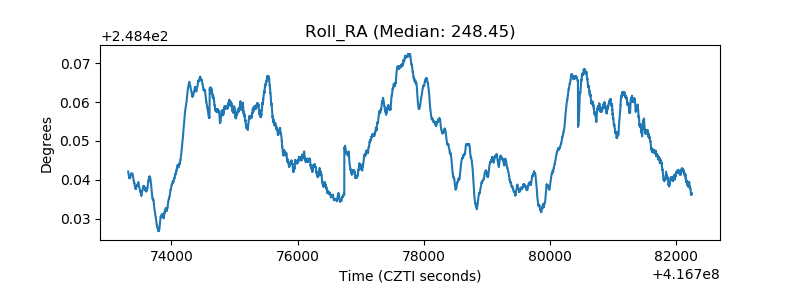 |
| Veto Counter | 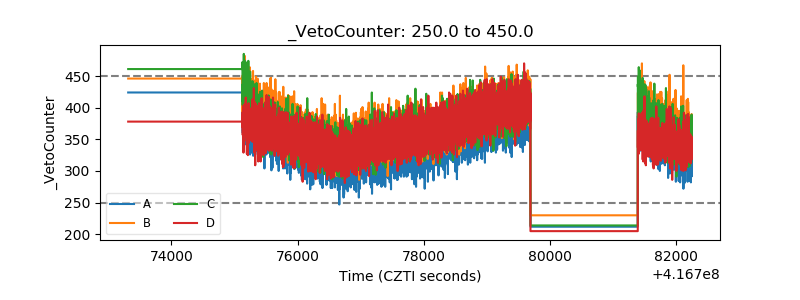 |