| Param | Original file | Final file |
|---|---|---|
| Filename | modeM0/AS1A12_056T02_9000005538_40378cztM0_level2.fits | modeM0/AS1A12_056T02_9000005538_40378cztM0_level2_quad_clean.evt |
| Size (bytes) | 369,460,800 | 94,668,480 |
| Size | 352.3 MB | 90.3 MB |
| Events in quadrant A | 3,401,806 | 652,264 |
| Events in quadrant B | 2,658,916 | 671,312 |
| Events in quadrant C | 2,728,475 | 639,644 |
| Events in quadrant D | 4,440,555 | 502,402 |
| Mode M0 | |||
|---|---|---|---|
| Quadrant | BADHDUFLAG | Total packets | Discarded packets |
| A | 0 | 13799 | 3 |
| B | 0 | 11838 | 2 |
| C | 0 | 11700 | 2 |
| D | 0 | 17090 | 2 |
| Mode M9 | |||
|---|---|---|---|
| Quadrant | BADHDUFLAG | Total packets | Discarded packets |
| A | 0 | 30 | 0 |
| B | 0 | 30 | 0 |
| C | 0 | 30 | 0 |
| D | 0 | 30 | 0 |
| Mode SS | |||
|---|---|---|---|
| Quadrant | BADHDUFLAG | Total packets | Discarded packets |
| A | 0 | 118 | 0 |
| B | 0 | 118 | 0 |
| C | 0 | 118 | 0 |
| D | 0 | 118 | 0 |
| Quadrant | Total seconds | Saturated seconds | Saturation percentage |
|---|---|---|---|
| A | 5728 | 81 | 1.414106% |
| B | 5728 | 17 | 0.296788% |
| C | 5728 | 10 | 0.174581% |
| D | 5728 | 948 | 16.550279% |
Noise dominated data is calculated using 1-second bins in cleaned event files. If a bin has >2000 counts, and if more than 50% of those come from <1% of pixels, then it is considered to be noise-dominated and hence unusable.
| Quadrant | # 1 sec bins | Bins with >0 counts | Bins with >2000 counts | High rate bins dominated by noise | Noise dominated (total time) | Noise dominated (detector-on time) | Marked lightcurve |
|---|---|---|---|---|---|---|---|
| A | 7130 | 5729 | 41 | 41 | 0.58% | 0.72% | 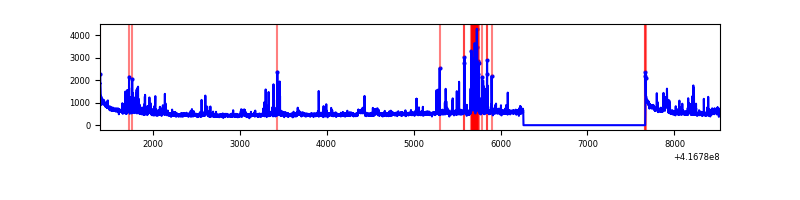 |
| B | 7130 | 5729 | 10 | 10 | 0.14% | 0.17% | 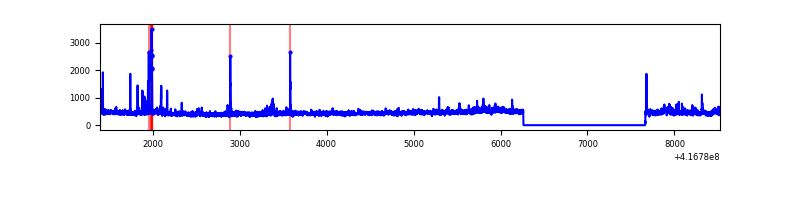 |
| C | 7130 | 5729 | 7 | 7 | 0.10% | 0.12% | 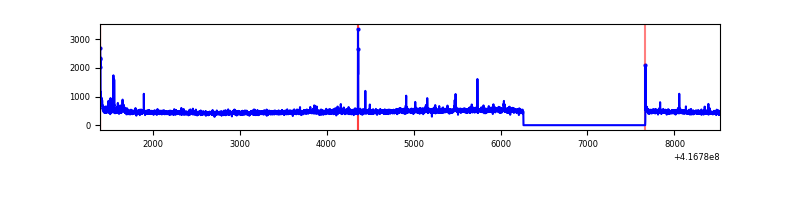 |
| D | 7130 | 5728 | 438 | 438 | 6.14% | 7.65% | 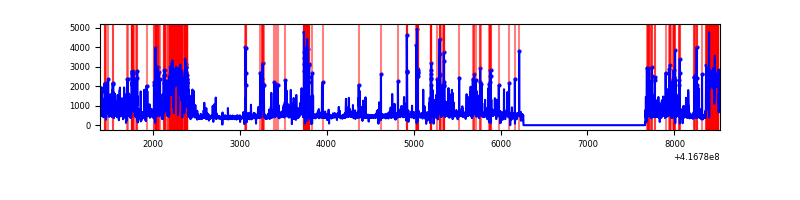 |
Top three noisy pixels from each quadrant. If the there are fewer than three noisy pixels in the level2.evt file, extra rows are filled as -1
| Pixel properties | Quadrant properties | ||||||
|---|---|---|---|---|---|---|---|
| Quadrant | DetID | PixID | Counts | Sigma | Mean | Median | Sigma |
| A | 10 | 83 | 495726 | 3869.15 | 627 | 616 | 128.0 |
| A | 13 | 248 | 317605 | 2477.18 | 627 | 616 | 128.0 |
| A | 6 | 10 | 127571 | 992.12 | 627 | 616 | 128.0 |
| B | 5 | 255 | 67027 | 552.18 | 626 | 609 | 120.3 |
| B | 4 | 171 | 52473 | 431.18 | 626 | 609 | 120.3 |
| B | 0 | 230 | 31013 | 252.77 | 626 | 609 | 120.3 |
| C | 15 | 214 | 247826 | 1723.72 | 616 | 621 | 143.4 |
| C | 12 | 249 | 33520 | 229.4 | 616 | 621 | 143.4 |
| C | 0 | 10 | 27037 | 184.19 | 616 | 621 | 143.4 |
| D | 12 | 227 | 1062658 | 7568.02 | 566 | 550 | 140.3 |
| D | 2 | 250 | 350102 | 2490.72 | 566 | 550 | 140.3 |
| D | 9 | 19 | 312011 | 2219.31 | 566 | 550 | 140.3 |
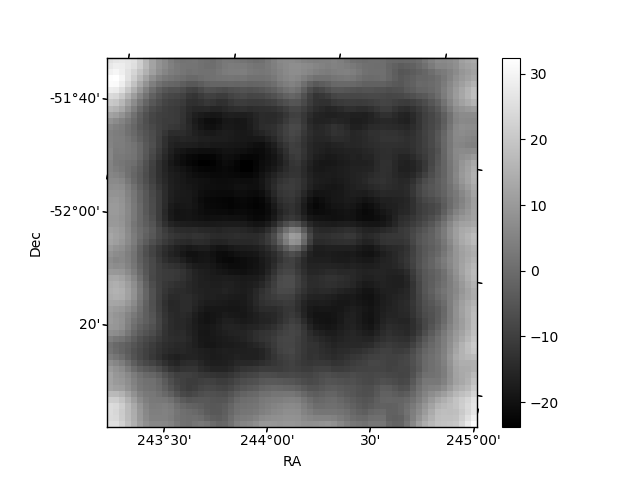
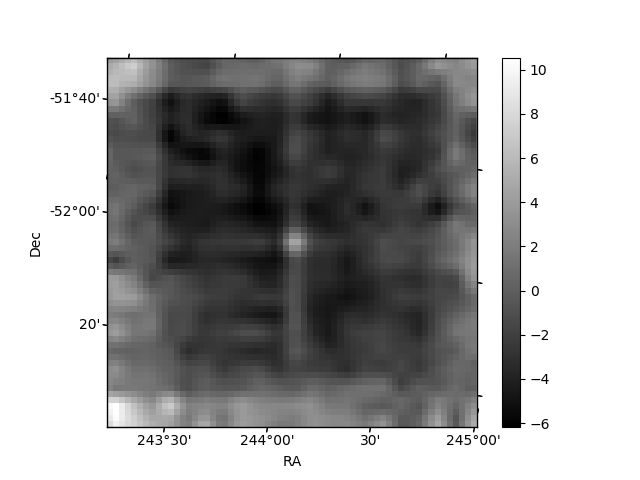
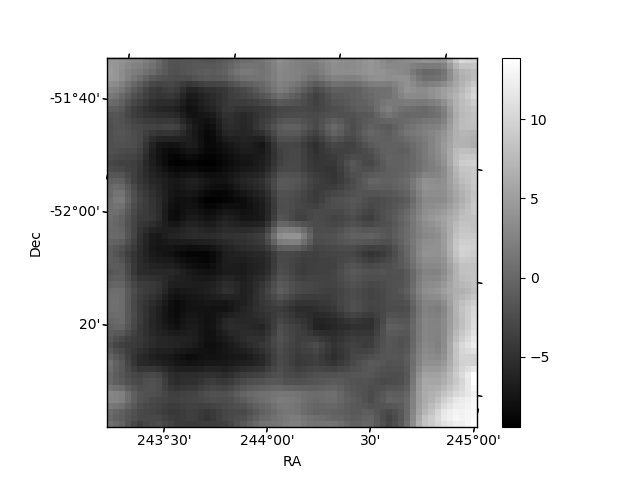
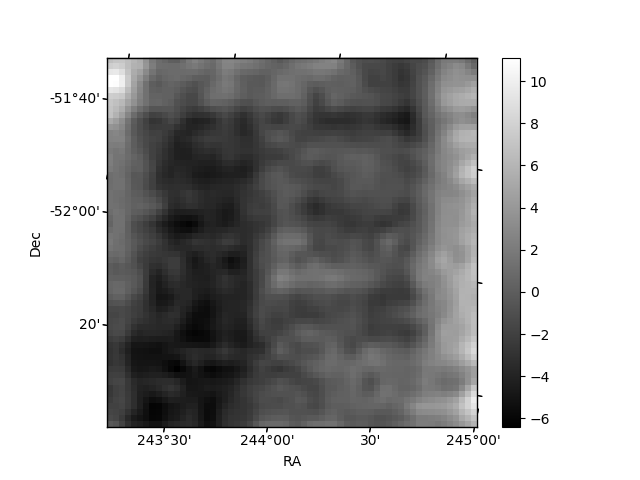
Histogram calculated using DETX and DETY for each event in the final _common_clean file
| Quadrant A | 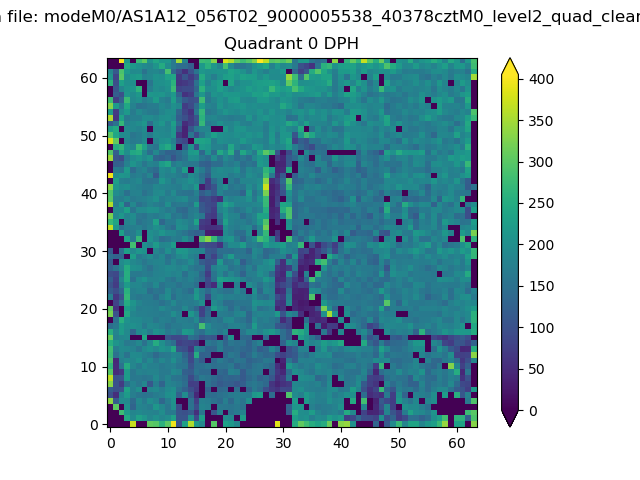 |
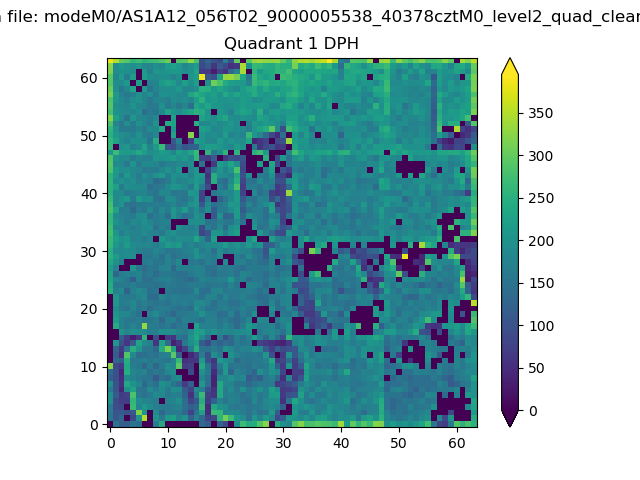 |
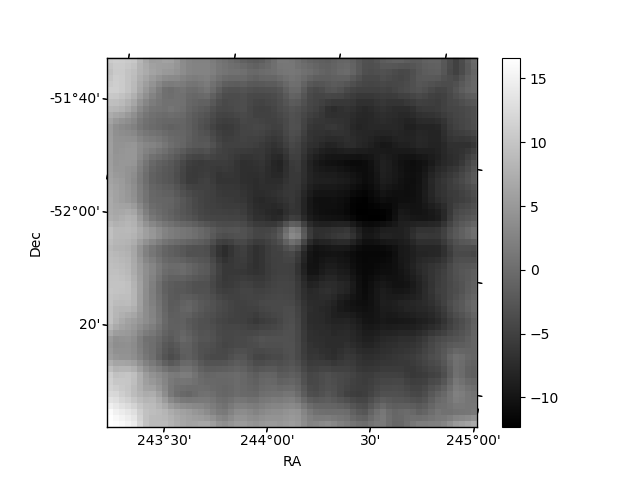
Quadrant B |
|---|---|---|---|
| Quadrant D | 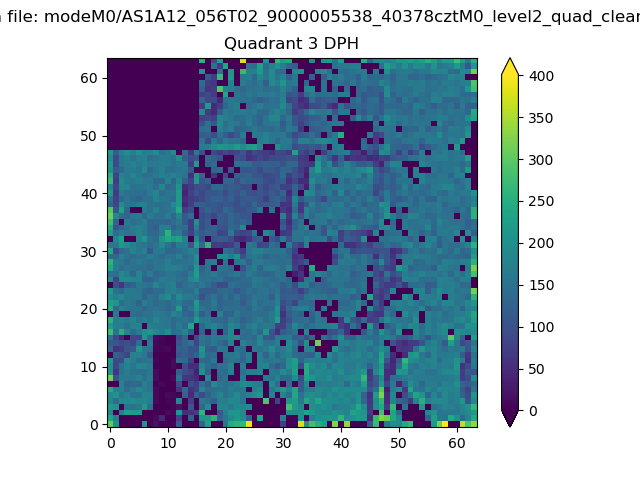 |
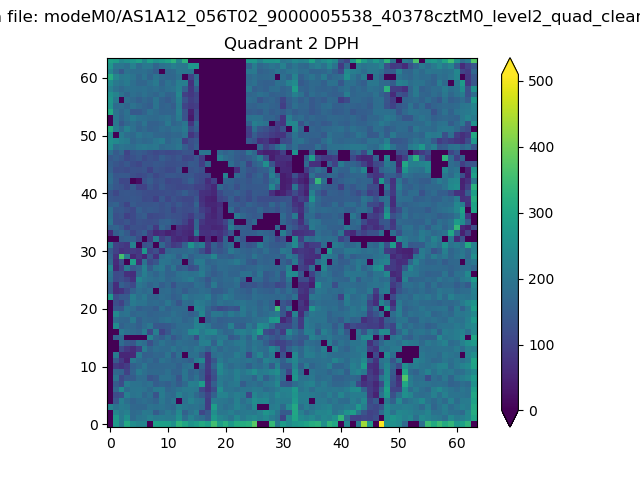 |
Quadrant C |
| Plot type | Count rate plots | Images |
|---|---|---|
| Comparison with Poisson distribution Blue bars denote a histogram of data divided into 1 sec bins. Red curve is a Poisson curve with rate = median count rate of data. |
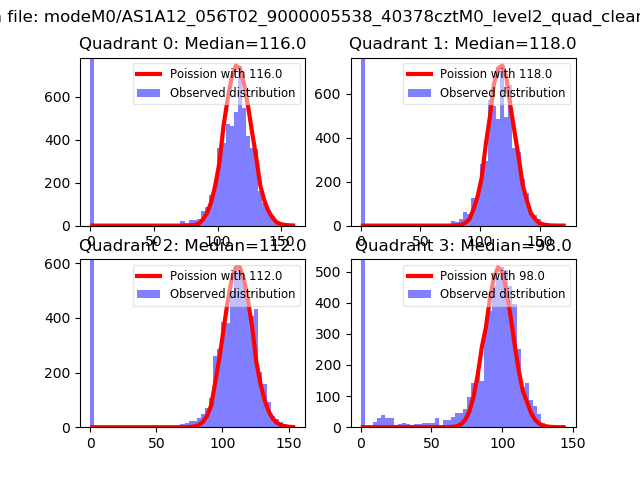 |
 |
| Quadrant-wise count rates Data is divided into 100 sec bins |
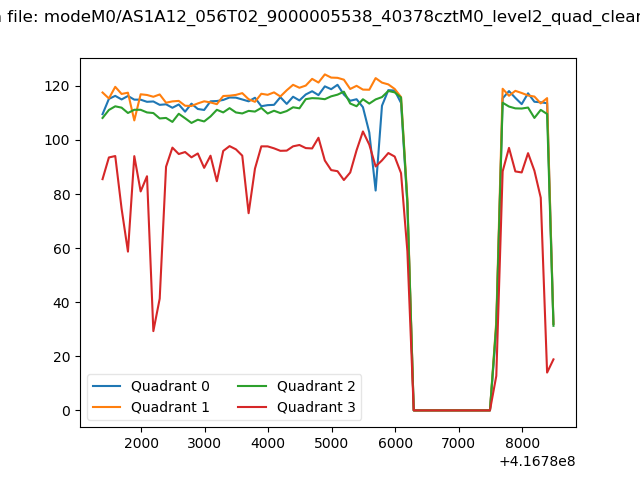 |
|
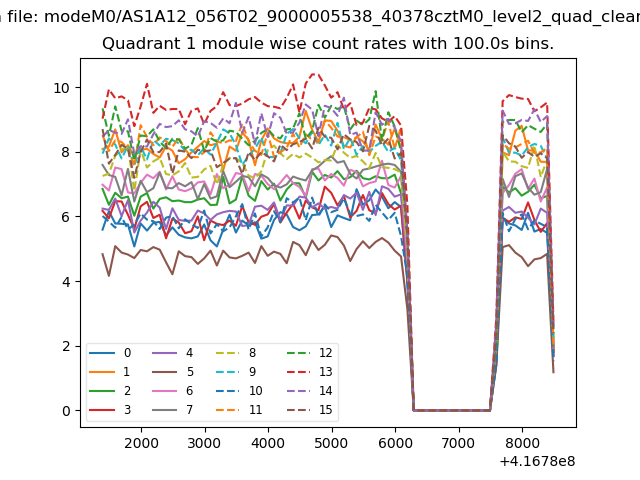
| Module-wise count rates for Quadrant A Data is divided into 100 sec bins |
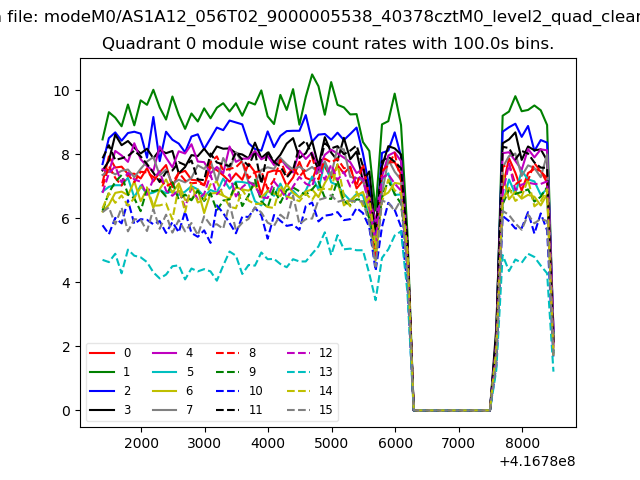 |
 |
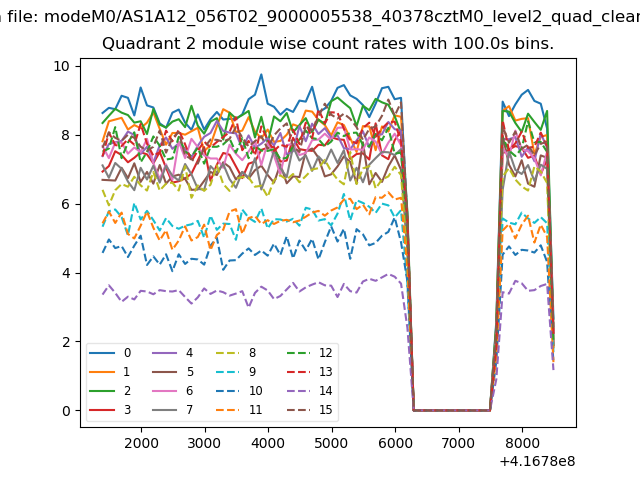
| Module-wise count rates for Quadrant B Data is divided into 100 sec bins |
 |
 |
| Module-wise count rates for Quadrant C Data is divided into 100 sec bins |
 |
 |
| Module-wise count rates for Quadrant D Data is divided into 100 sec bins |
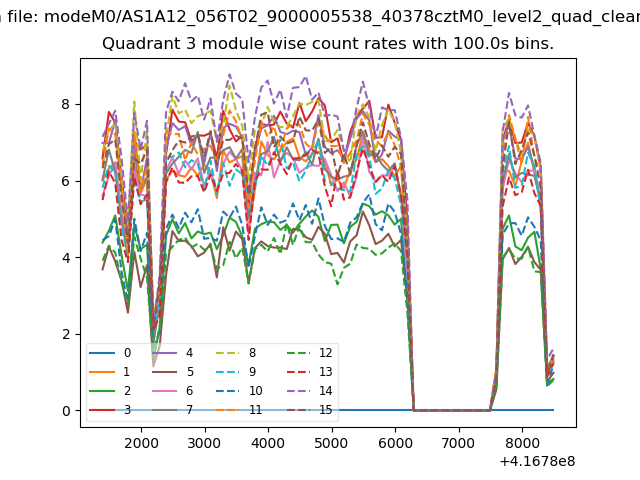 |
 |
| Parameter | Plot |
|---|---|
| CZT HV Monitor | 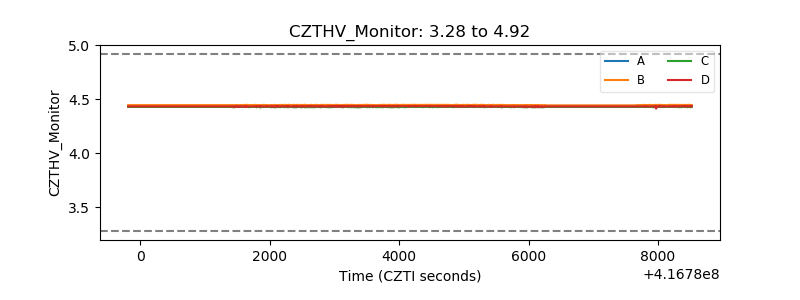 |
| D_VDD | 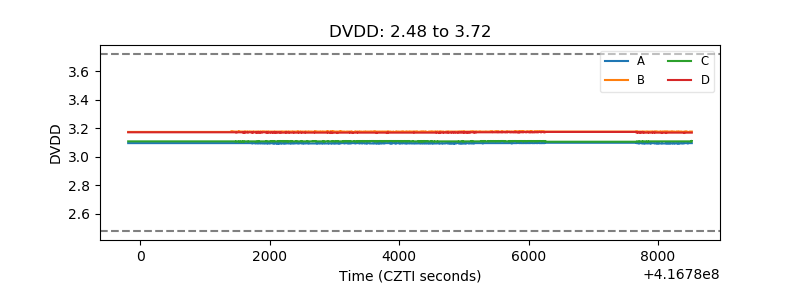 |
| Temperature 1 | 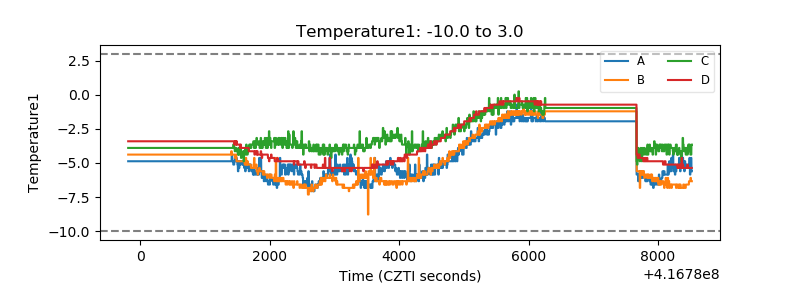 |
| Veto HV Monitor | 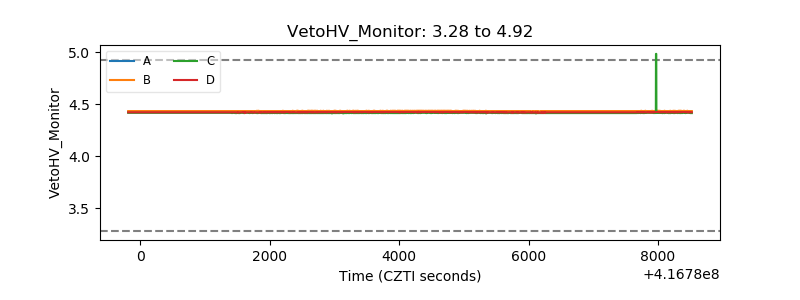 |
| Veto LLD | 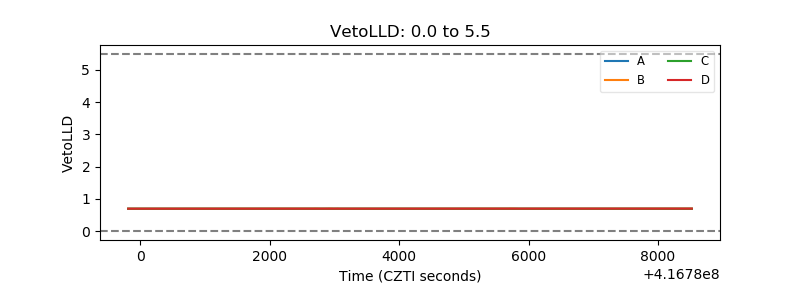 |
| Alpha Counter | 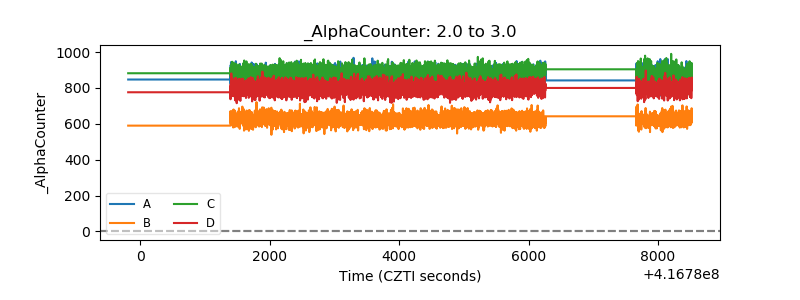 |
| _CPM_Rate | 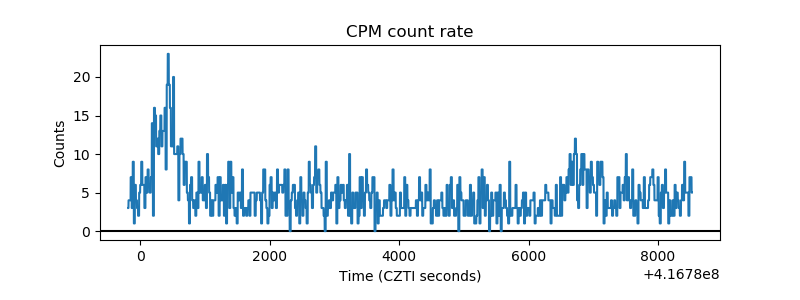 |
| CZT Counter | 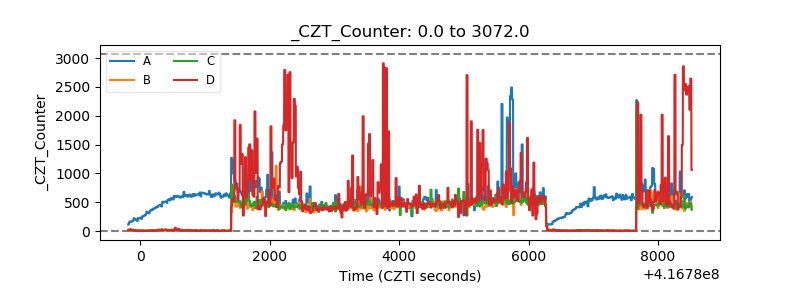 |
| +2.5 Volts monitor | 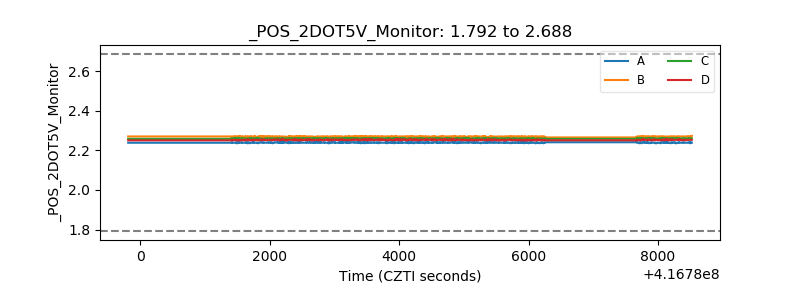 |
| +5 Volts monitor | 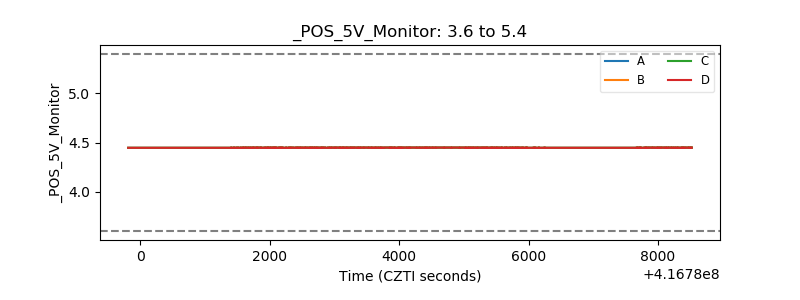 |
| _ROLL_ROT |  |
| _Roll_DEC | 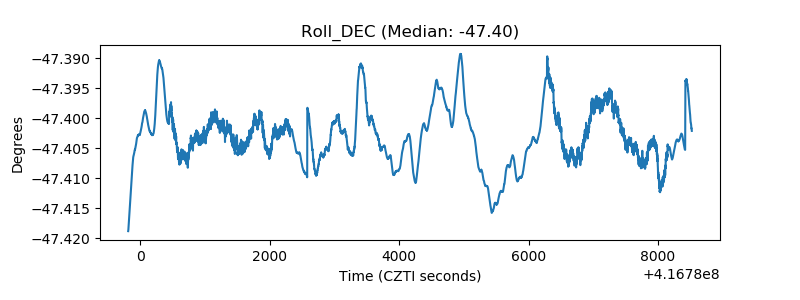 |
| _Roll_RA | 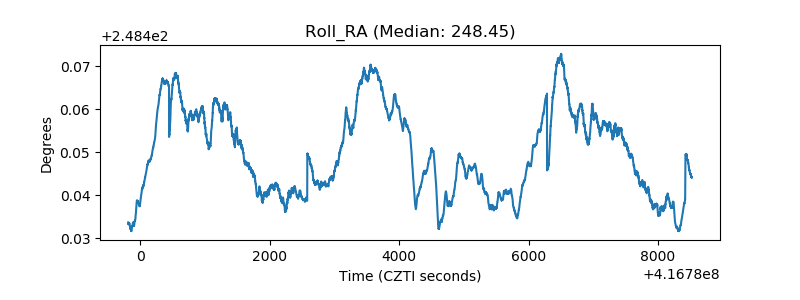 |
| Veto Counter | 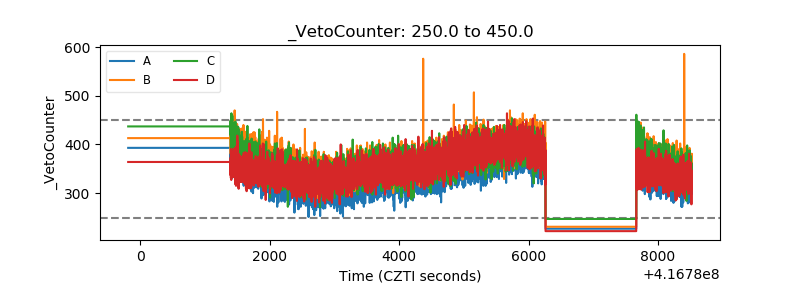 |