| Param | Original file | Final file |
|---|---|---|
| Filename | modeM0/AS1A12_056T02_9000005538_40379cztM0_level2.fits | modeM0/AS1A12_056T02_9000005538_40379cztM0_level2_quad_clean.evt |
| Size (bytes) | 424,448,640 | 94,155,840 |
| Size | 404.8 MB | 89.8 MB |
| Events in quadrant A | 3,586,365 | 662,433 |
| Events in quadrant B | 3,092,502 | 680,822 |
| Events in quadrant C | 2,848,833 | 651,936 |
| Events in quadrant D | 5,725,544 | 443,897 |
| Mode M0 | |||
|---|---|---|---|
| Quadrant | BADHDUFLAG | Total packets | Discarded packets |
| A | 0 | 14325 | 3 |
| B | 0 | 13085 | 2 |
| C | 0 | 12159 | 2 |
| D | 0 | 21191 | 2 |
| Mode M9 | |||
|---|---|---|---|
| Quadrant | BADHDUFLAG | Total packets | Discarded packets |
| A | 0 | 20 | 0 |
| B | 0 | 20 | 0 |
| C | 0 | 20 | 0 |
| D | 0 | 21 | 0 |
| Mode SS | |||
|---|---|---|---|
| Quadrant | BADHDUFLAG | Total packets | Discarded packets |
| A | 0 | 122 | 0 |
| B | 0 | 122 | 0 |
| C | 0 | 122 | 0 |
| D | 0 | 122 | 0 |
| Quadrant | Total seconds | Saturated seconds | Saturation percentage |
|---|---|---|---|
| A | 5885 | 81 | 1.376381% |
| B | 5885 | 33 | 0.560748% |
| C | 5885 | 13 | 0.220901% |
| D | 5885 | 1623 | 27.578590% |
Noise dominated data is calculated using 1-second bins in cleaned event files. If a bin has >2000 counts, and if more than 50% of those come from <1% of pixels, then it is considered to be noise-dominated and hence unusable.
| Quadrant | # 1 sec bins | Bins with >0 counts | Bins with >2000 counts | High rate bins dominated by noise | Noise dominated (total time) | Noise dominated (detector-on time) | Marked lightcurve |
|---|---|---|---|---|---|---|---|
| A | 7168 | 5886 | 48 | 48 | 0.67% | 0.82% | 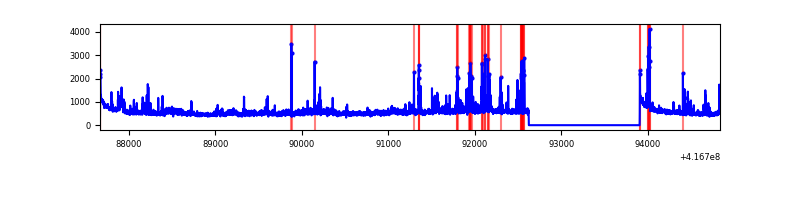 |
| B | 7168 | 5886 | 18 | 18 | 0.25% | 0.31% | 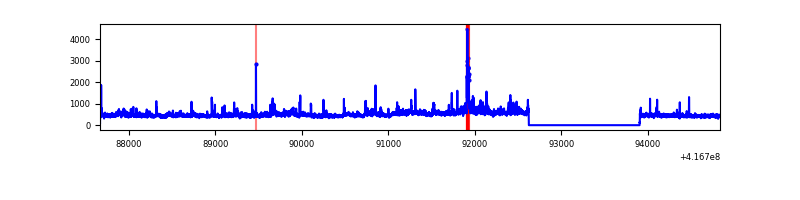 |
| C | 7168 | 5886 | 6 | 6 | 0.08% | 0.10% | 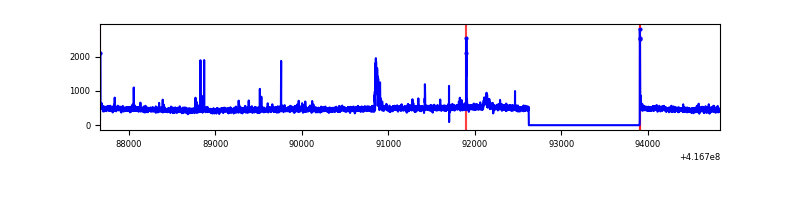 |
| D | 7168 | 5885 | 667 | 667 | 9.31% | 11.33% | 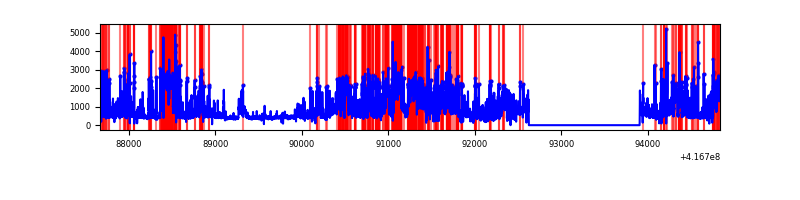 |
Top three noisy pixels from each quadrant. If the there are fewer than three noisy pixels in the level2.evt file, extra rows are filled as -1
| Pixel properties | Quadrant properties | ||||||
|---|---|---|---|---|---|---|---|
| Quadrant | DetID | PixID | Counts | Sigma | Mean | Median | Sigma |
| A | 10 | 83 | 516634 | 3896.29 | 645 | 634 | 132.4 |
| A | 6 | 10 | 270187 | 2035.38 | 645 | 634 | 132.4 |
| A | 13 | 248 | 262046 | 1973.91 | 645 | 634 | 132.4 |
| B | 3 | 112 | 357477 | 2867.93 | 642 | 624 | 124.4 |
| B | 4 | 171 | 68402 | 544.71 | 642 | 624 | 124.4 |
| B | 0 | 229 | 60361 | 480.09 | 642 | 624 | 124.4 |
| C | 15 | 214 | 253666 | 1713.76 | 635 | 639 | 147.6 |
| C | 14 | 254 | 62648 | 419.99 | 635 | 639 | 147.6 |
| C | 12 | 249 | 25462 | 168.13 | 635 | 639 | 147.6 |
| D | 12 | 227 | 2935065 | 21301.33 | 544 | 528 | 137.8 |
| D | 2 | 250 | 187341 | 1356.05 | 544 | 528 | 137.8 |
| D | 12 | 191 | 182070 | 1317.78 | 544 | 528 | 137.8 |
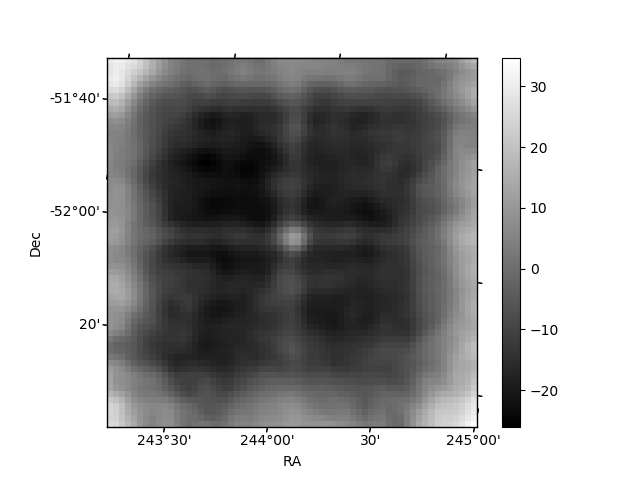
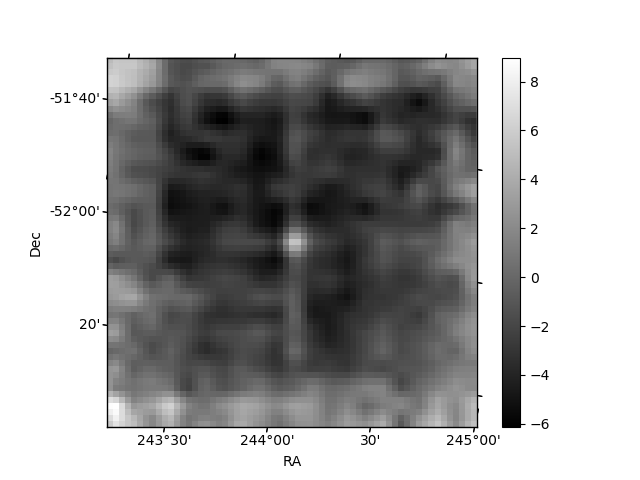
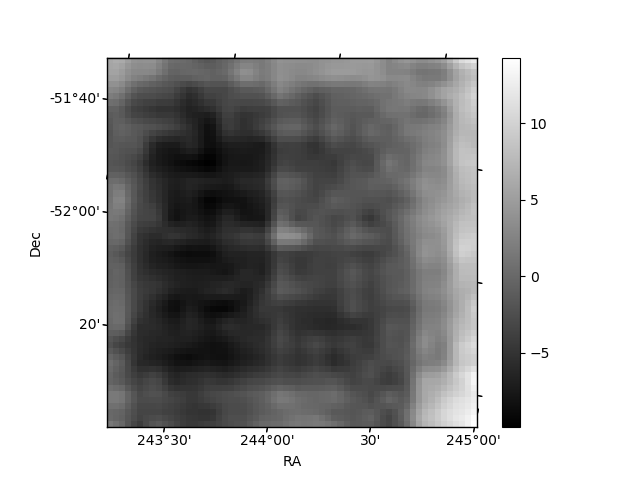
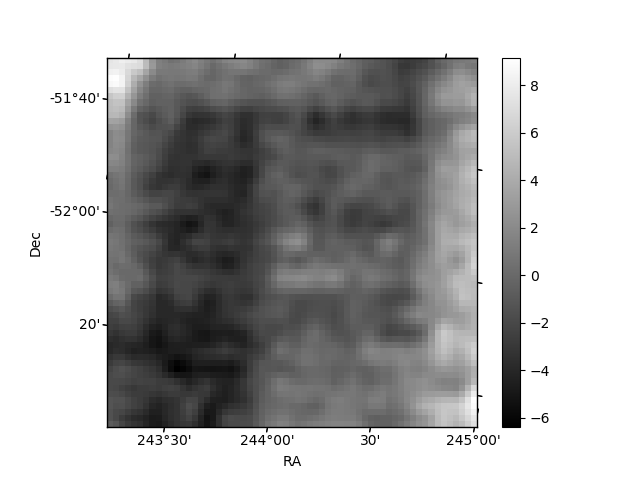
Histogram calculated using DETX and DETY for each event in the final _common_clean file
| Quadrant A | 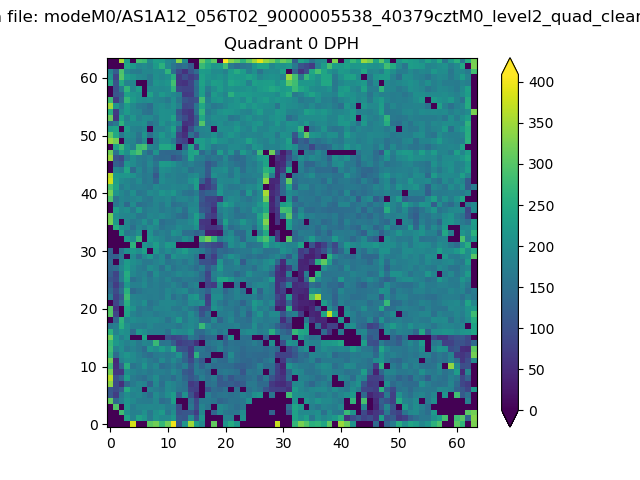 |
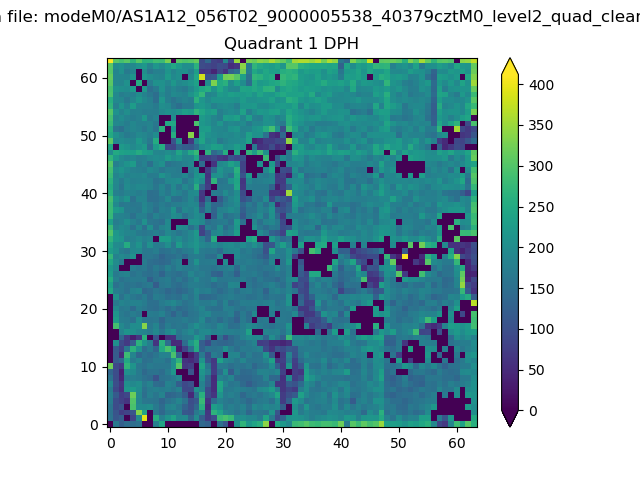 |
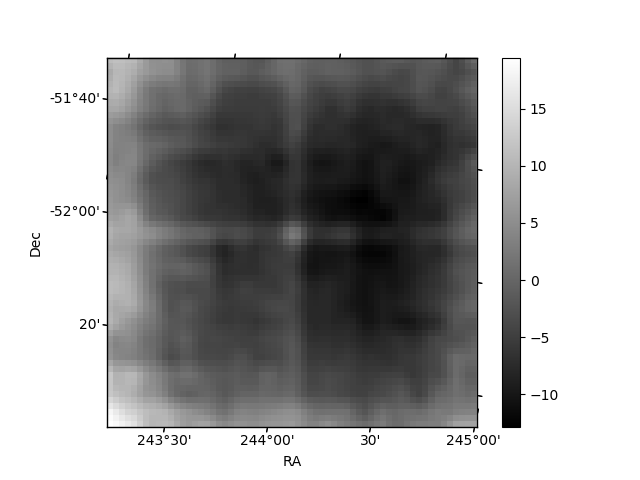
Quadrant B |
|---|---|---|---|
| Quadrant D | 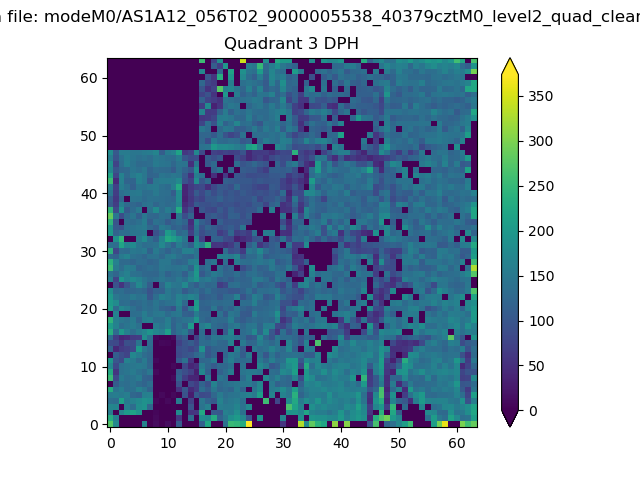 |
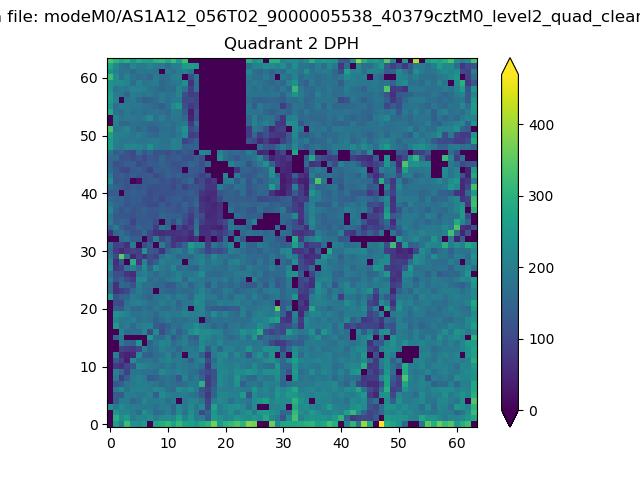 |
Quadrant C |
| Plot type | Count rate plots | Images |
|---|---|---|
| Comparison with Poisson distribution Blue bars denote a histogram of data divided into 1 sec bins. Red curve is a Poisson curve with rate = median count rate of data. |
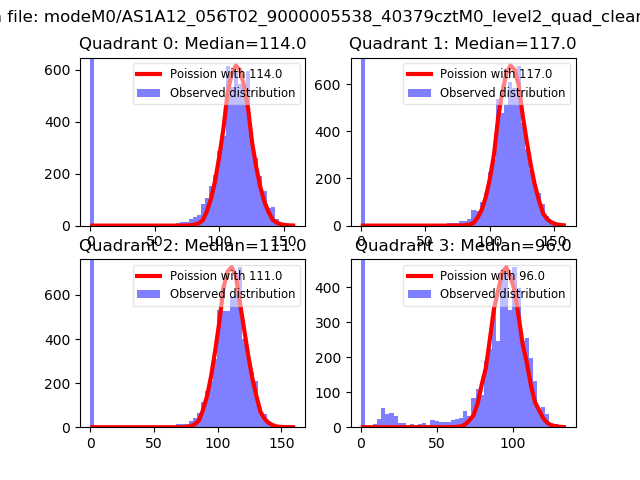 |
 |
| Quadrant-wise count rates Data is divided into 100 sec bins |
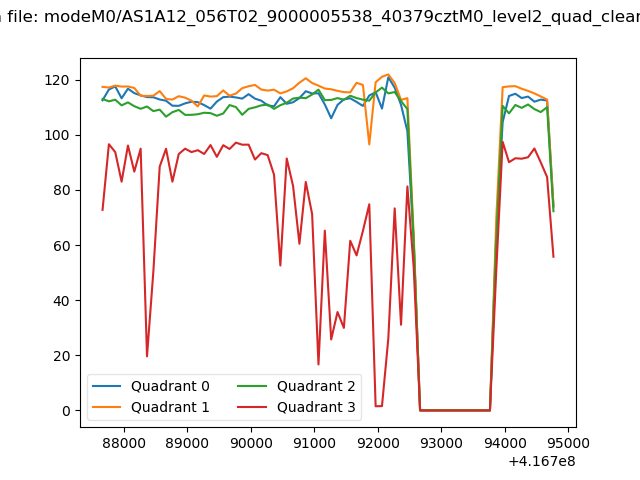 |
|
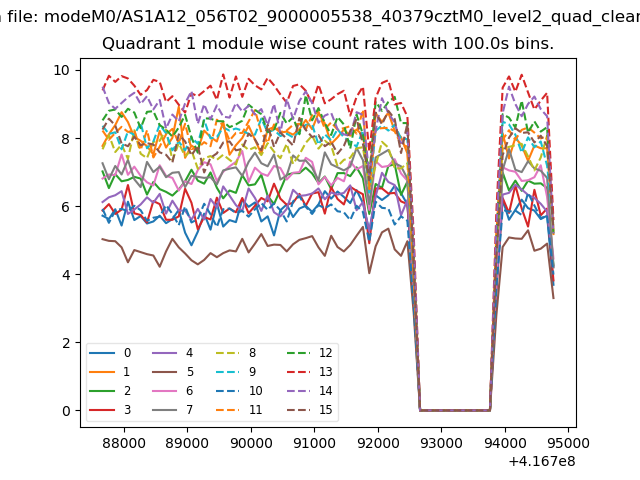
| Module-wise count rates for Quadrant A Data is divided into 100 sec bins |
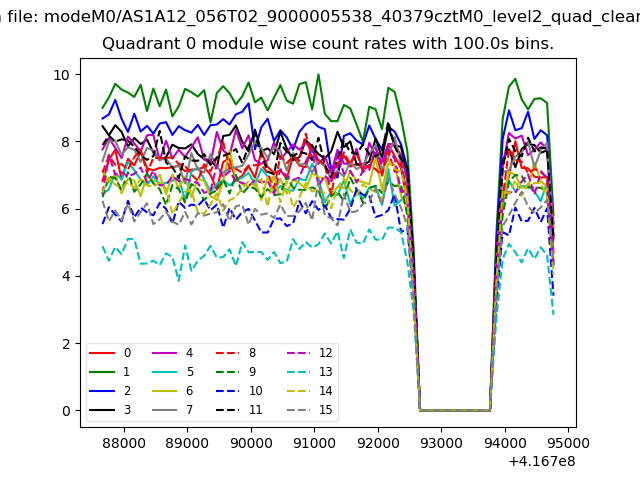 |
 |
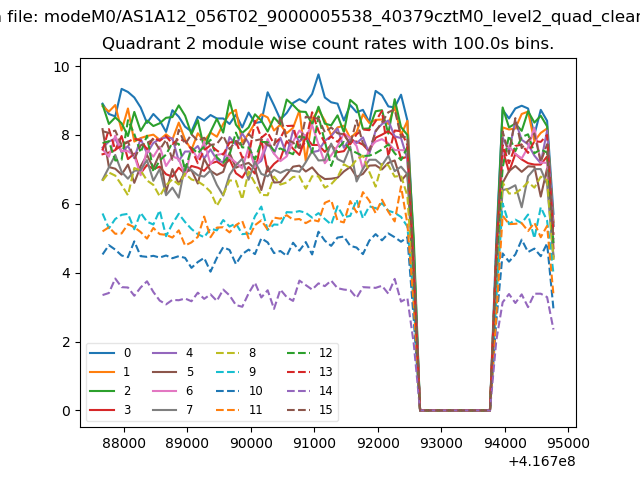
| Module-wise count rates for Quadrant B Data is divided into 100 sec bins |
 |
 |
| Module-wise count rates for Quadrant C Data is divided into 100 sec bins |
 |
 |
| Module-wise count rates for Quadrant D Data is divided into 100 sec bins |
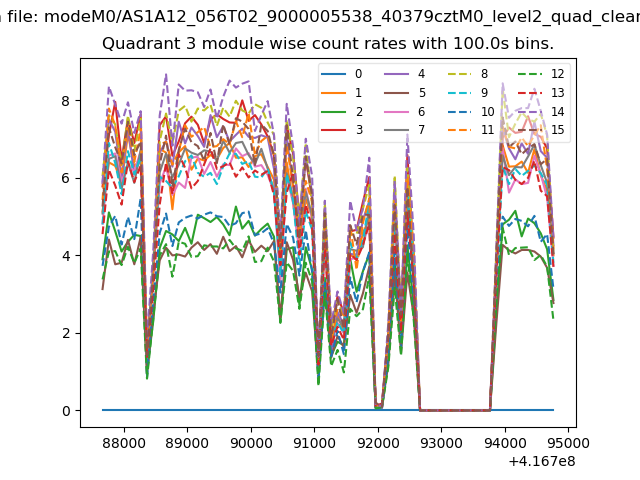 |
 |
| Parameter | Plot |
|---|---|
| CZT HV Monitor | 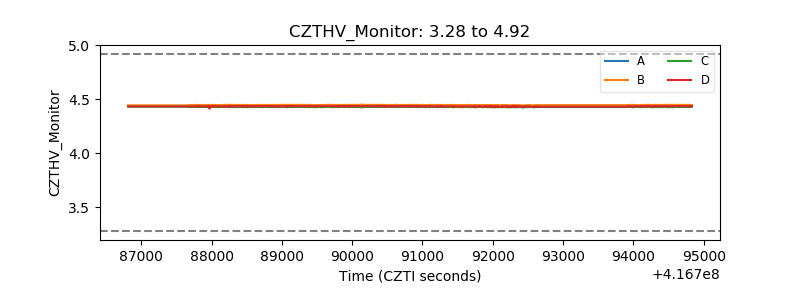 |
| D_VDD | 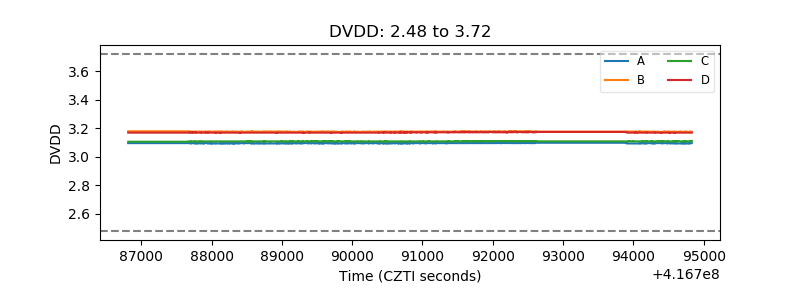 |
| Temperature 1 | 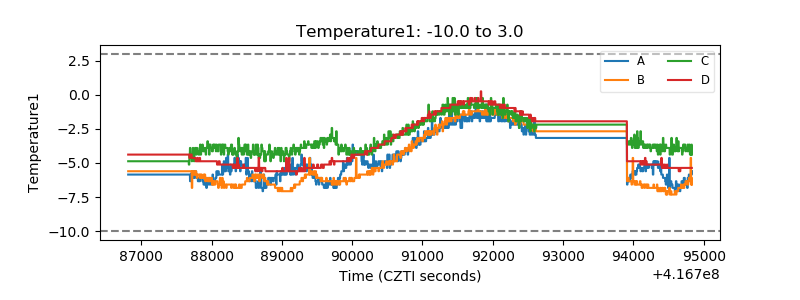 |
| Veto HV Monitor | 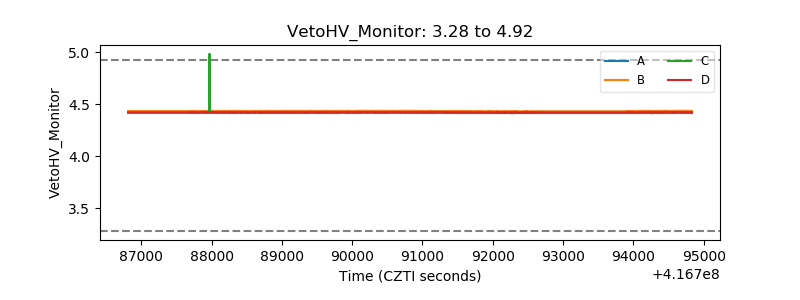 |
| Veto LLD | 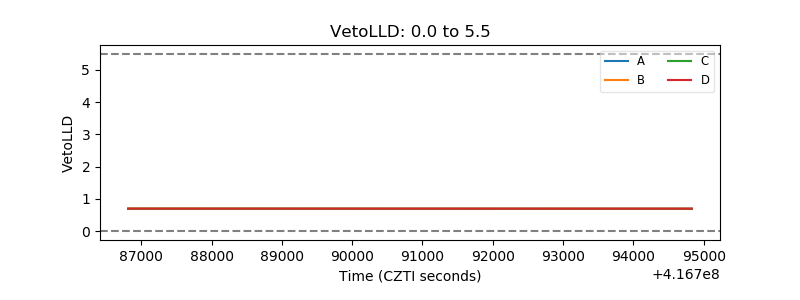 |
| Alpha Counter |  |
| _CPM_Rate | 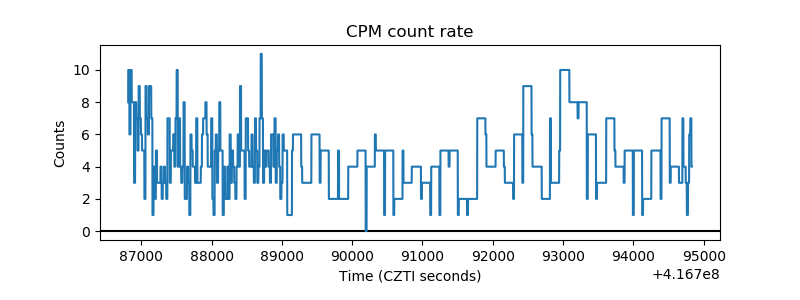 |
| CZT Counter | 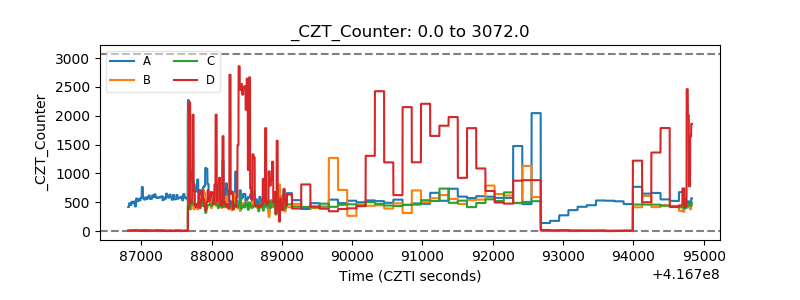 |
| +2.5 Volts monitor | 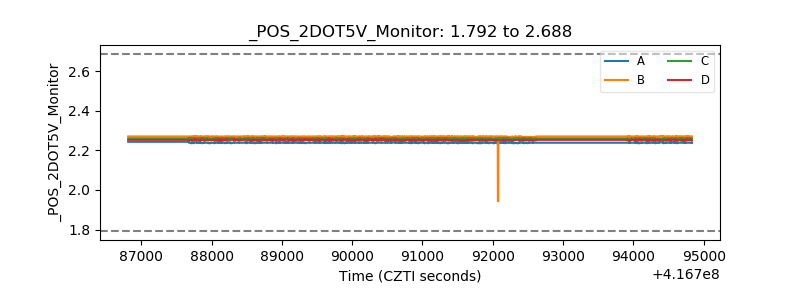 |
| +5 Volts monitor | 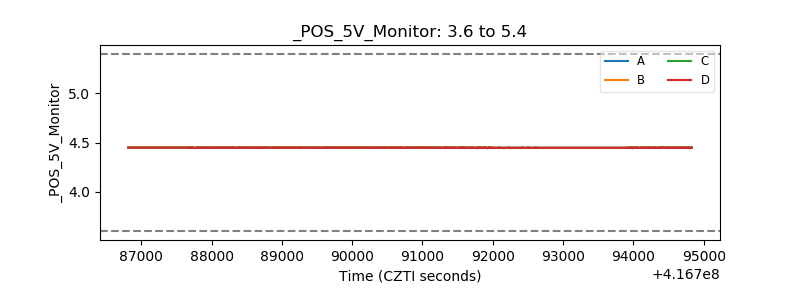 |
| _ROLL_ROT | 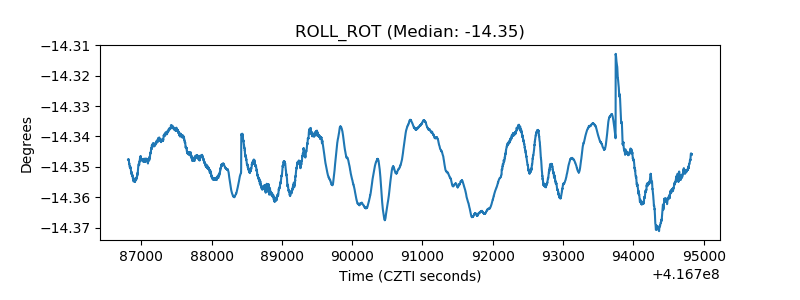 |
| _Roll_DEC | 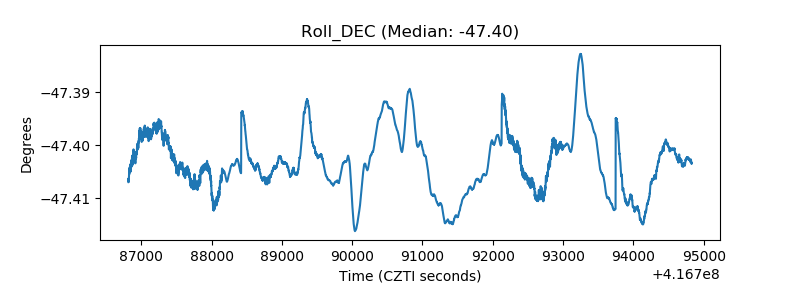 |
| _Roll_RA | 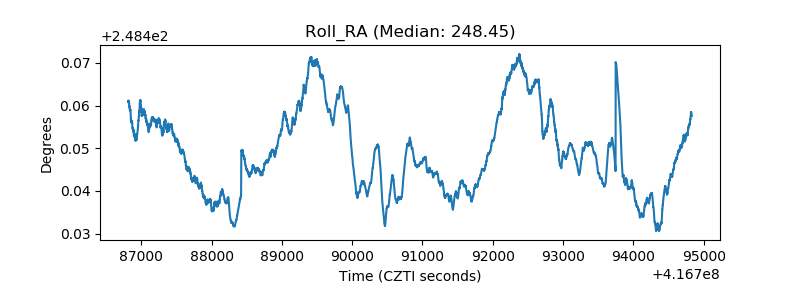 |
| Veto Counter | 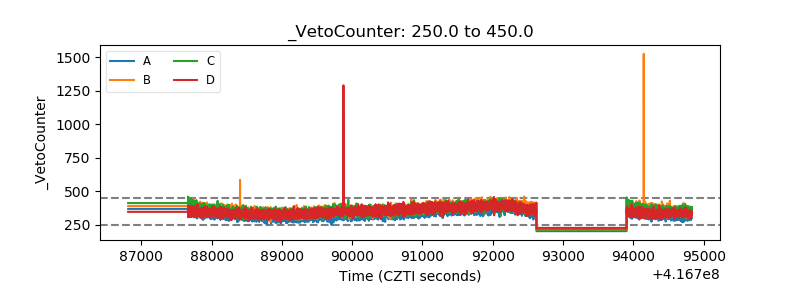 |