| Param | Original file | Final file |
|---|---|---|
| Filename | modeM0/AS1A12_056T02_9000005538_40385cztM0_level2.fits | modeM0/AS1A12_056T02_9000005538_40385cztM0_level2_quad_clean.evt |
| Size (bytes) | 1,291,996,800 | 311,040,000 |
| Size | 1.2 GB | 296.6 MB |
| Events in quadrant A | 11,040,920 | 2,158,714 |
| Events in quadrant B | 10,045,359 | 2,192,587 |
| Events in quadrant C | 9,440,492 | 2,120,305 |
| Events in quadrant D | 15,775,012 | 1,590,525 |
| Mode M0 | |||
|---|---|---|---|
| Quadrant | BADHDUFLAG | Total packets | Discarded packets |
| A | 0 | 44704 | 6 |
| B | 0 | 43196 | 5 |
| C | 0 | 40168 | 5 |
| D | 0 | 60410 | 5 |
| Mode M9 | |||
|---|---|---|---|
| Quadrant | BADHDUFLAG | Total packets | Discarded packets |
| A | 0 | 62 | 0 |
| B | 0 | 62 | 0 |
| C | 0 | 62 | 0 |
| D | 0 | 63 | 0 |
| Mode SS | |||
|---|---|---|---|
| Quadrant | BADHDUFLAG | Total packets | Discarded packets |
| A | 0 | 402 | 0 |
| B | 0 | 402 | 0 |
| C | 0 | 402 | 0 |
| D | 0 | 402 | 0 |
| Quadrant | Total seconds | Saturated seconds | Saturation percentage |
|---|---|---|---|
| A | 19663 | 194 | 0.986625% |
| B | 19663 | 238 | 1.210395% |
| C | 19663 | 36 | 0.183085% |
| D | 19663 | 3494 | 17.769415% |
Noise dominated data is calculated using 1-second bins in cleaned event files. If a bin has >2000 counts, and if more than 50% of those come from <1% of pixels, then it is considered to be noise-dominated and hence unusable.
| Quadrant | # 1 sec bins | Bins with >0 counts | Bins with >2000 counts | High rate bins dominated by noise | Noise dominated (total time) | Noise dominated (detector-on time) | Marked lightcurve |
|---|---|---|---|---|---|---|---|
| A | 25483 | 19667 | 103 | 103 | 0.40% | 0.52% | 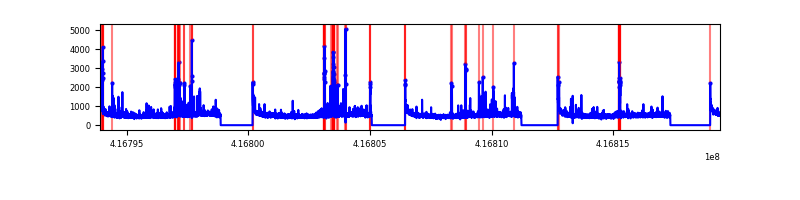 |
| B | 25483 | 19667 | 129 | 129 | 0.51% | 0.66% | 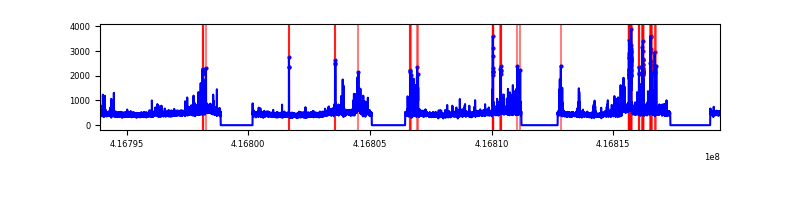 |
| C | 25483 | 19667 | 25 | 25 | 0.10% | 0.13% | 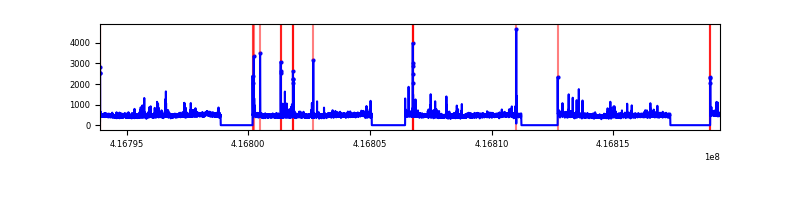 |
| D | 25483 | 19665 | 1034 | 1034 | 4.06% | 5.26% | 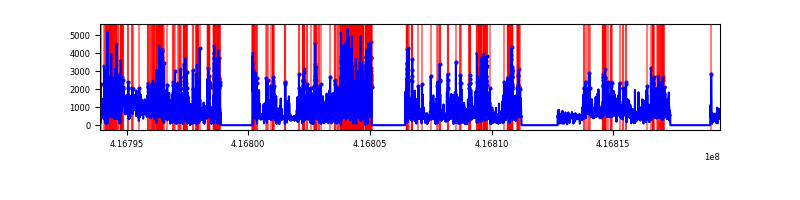 |
Top three noisy pixels from each quadrant. If the there are fewer than three noisy pixels in the level2.evt file, extra rows are filled as -1
| Pixel properties | Quadrant properties | ||||||
|---|---|---|---|---|---|---|---|
| Quadrant | DetID | PixID | Counts | Sigma | Mean | Median | Sigma |
| A | 10 | 83 | 1585944 | 3609.95 | 2174 | 2131 | 438.7 |
| A | 13 | 248 | 668611 | 1519.1 | 2174 | 2131 | 438.7 |
| A | 2 | 79 | 190445 | 429.22 | 2174 | 2131 | 438.7 |
| B | 4 | 171 | 368536 | 881.97 | 2158 | 2098 | 415.5 |
| B | 4 | 170 | 338441 | 809.54 | 2158 | 2098 | 415.5 |
| B | 3 | 112 | 283222 | 676.63 | 2158 | 2098 | 415.5 |
| C | 15 | 214 | 845298 | 1709.31 | 2134 | 2153 | 493.3 |
| C | 12 | 249 | 161951 | 323.96 | 2134 | 2153 | 493.3 |
| C | 14 | 254 | 48946 | 94.86 | 2134 | 2153 | 493.3 |
| D | 12 | 227 | 5052686 | 10702.53 | 1939 | 1885 | 471.9 |
| D | 2 | 250 | 750203 | 1585.67 | 1939 | 1885 | 471.9 |
| D | 13 | 171 | 724562 | 1531.34 | 1939 | 1885 | 471.9 |
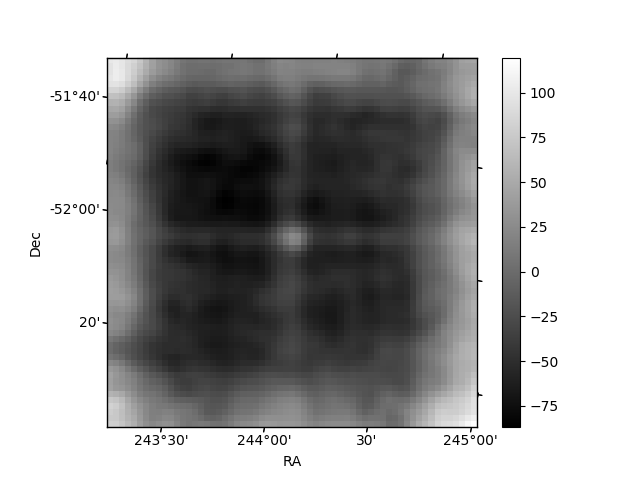
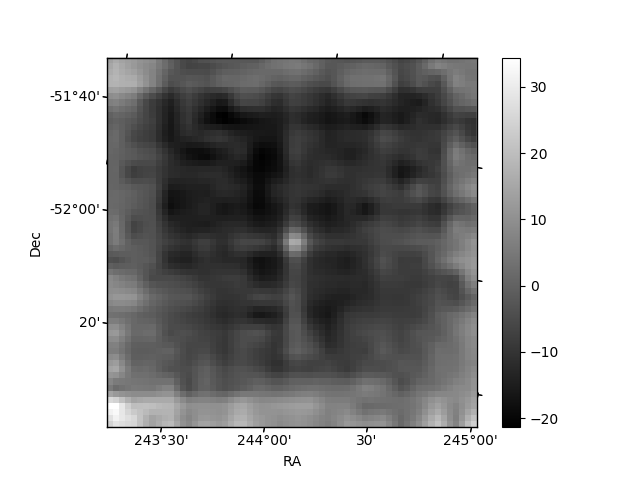
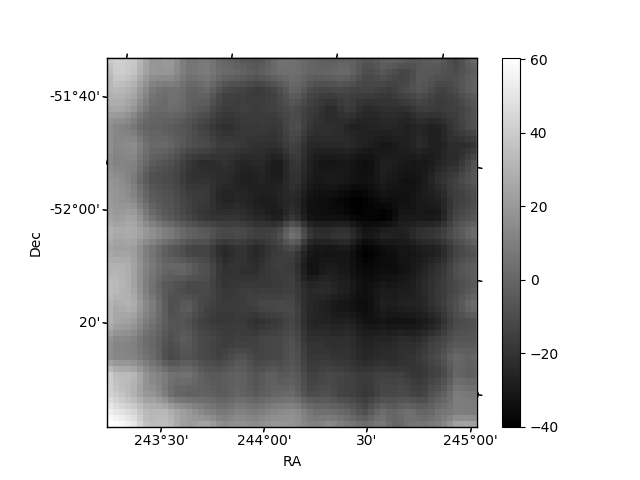
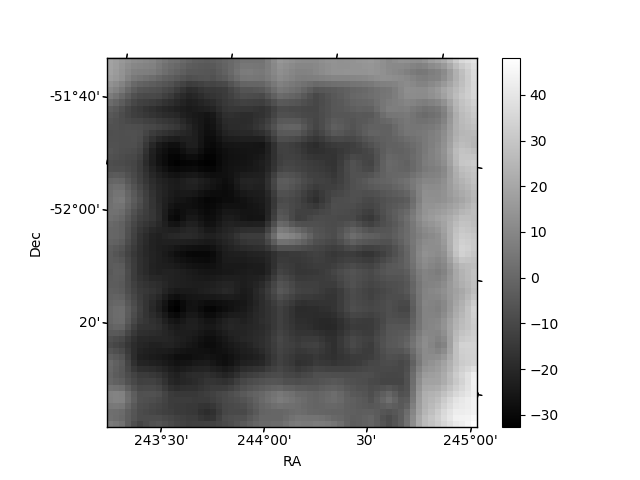
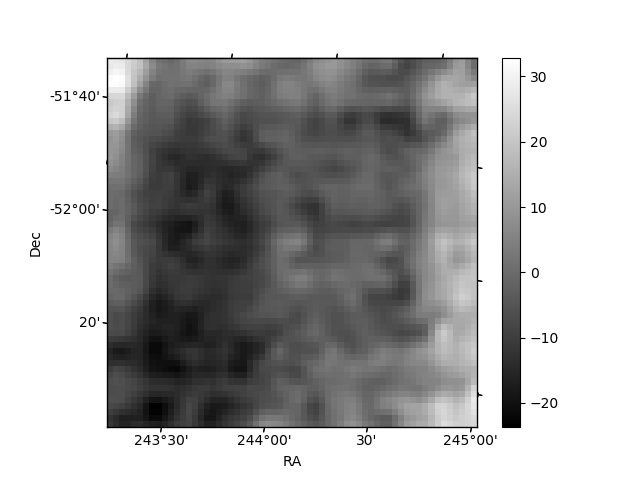
Histogram calculated using DETX and DETY for each event in the final _common_clean file
| Quadrant A | 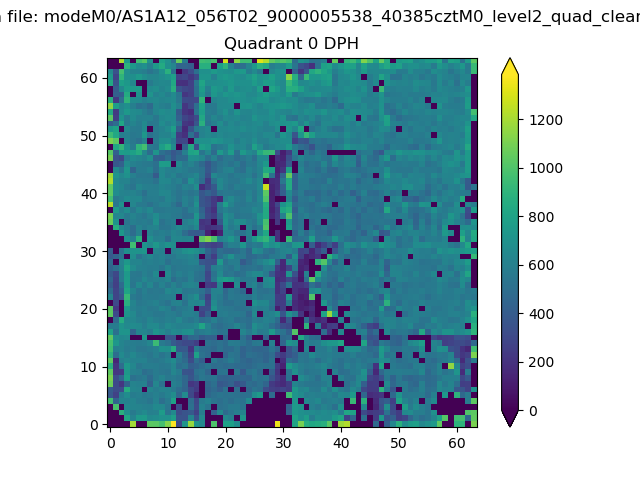 |
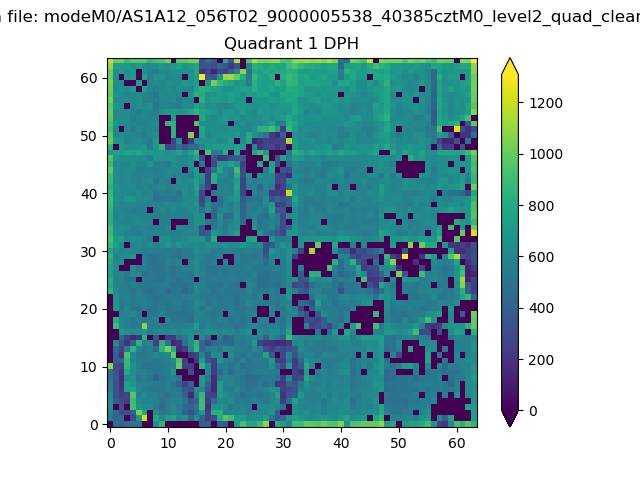 |
Quadrant B |
|---|---|---|---|
| Quadrant D | 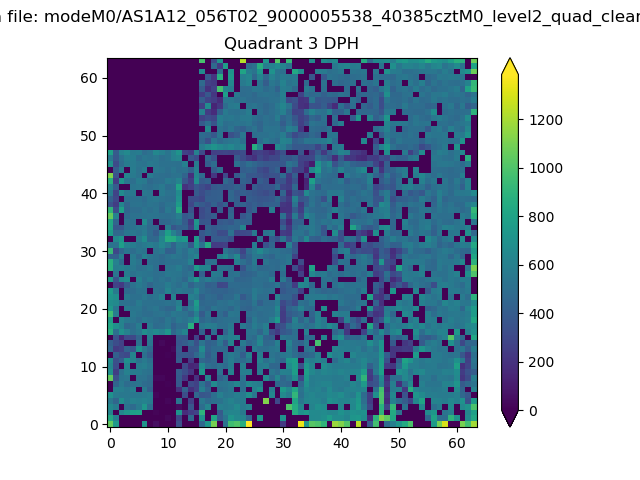 |
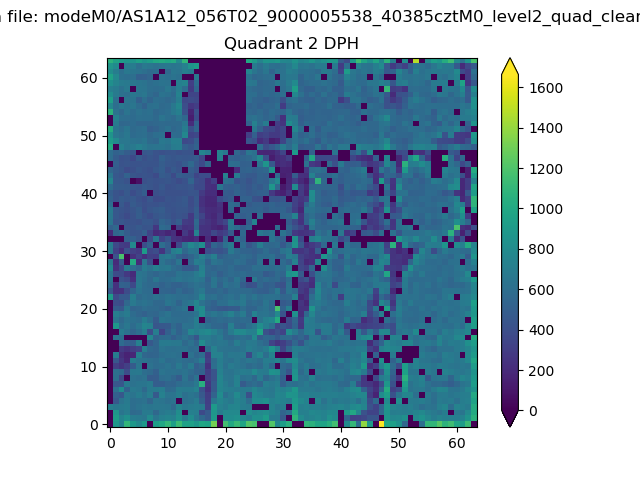 |
Quadrant C |
| Plot type | Count rate plots | Images |
|---|---|---|
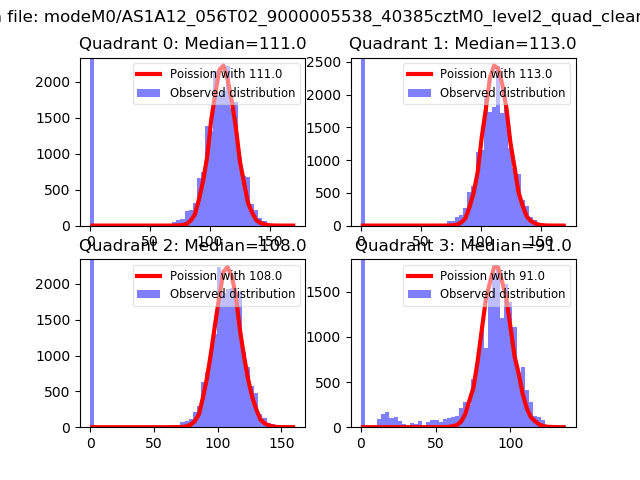
| Comparison with Poisson distribution Blue bars denote a histogram of data divided into 1 sec bins. Red curve is a Poisson curve with rate = median count rate of data. |
 |
 |
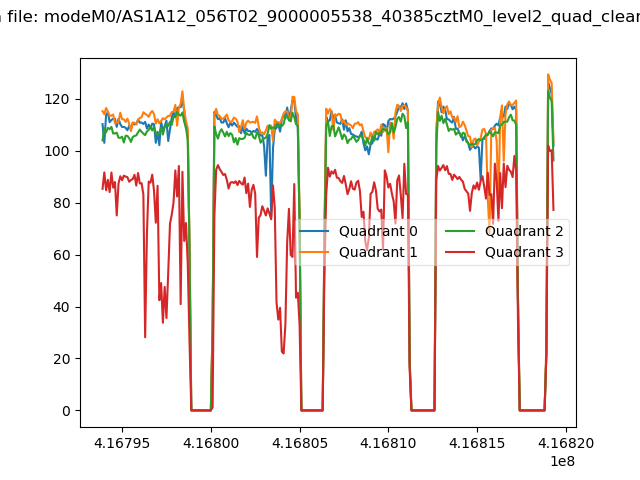
| Quadrant-wise count rates Data is divided into 100 sec bins |
 |
|
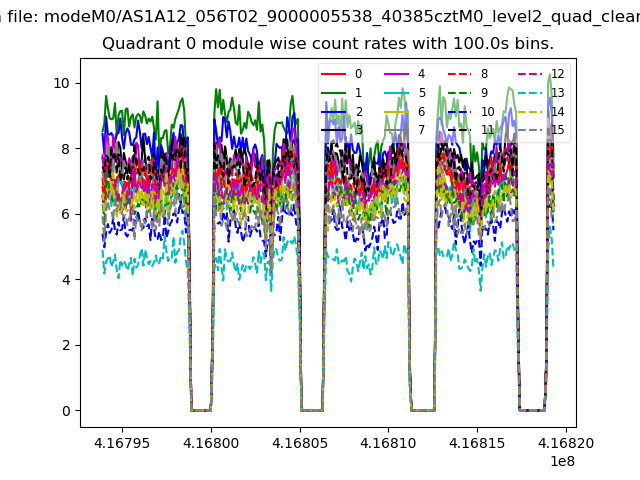
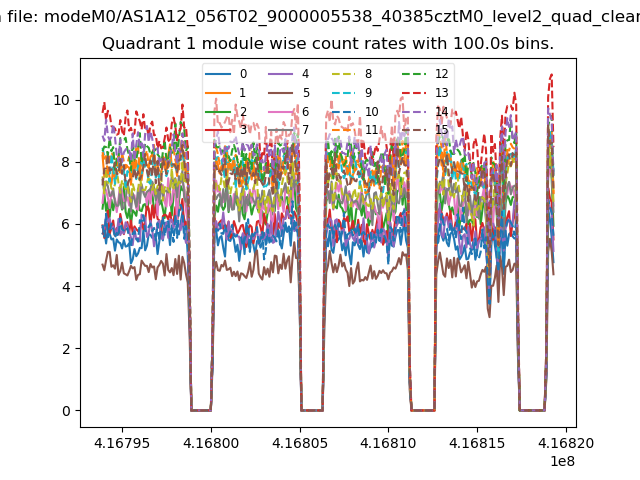
| Module-wise count rates for Quadrant A Data is divided into 100 sec bins |
 |
 |
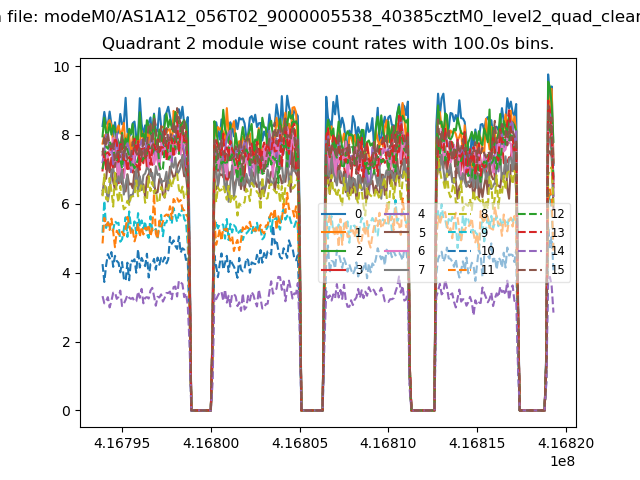
| Module-wise count rates for Quadrant B Data is divided into 100 sec bins |
 |
 |
| Module-wise count rates for Quadrant C Data is divided into 100 sec bins |
 |
 |
| Module-wise count rates for Quadrant D Data is divided into 100 sec bins |
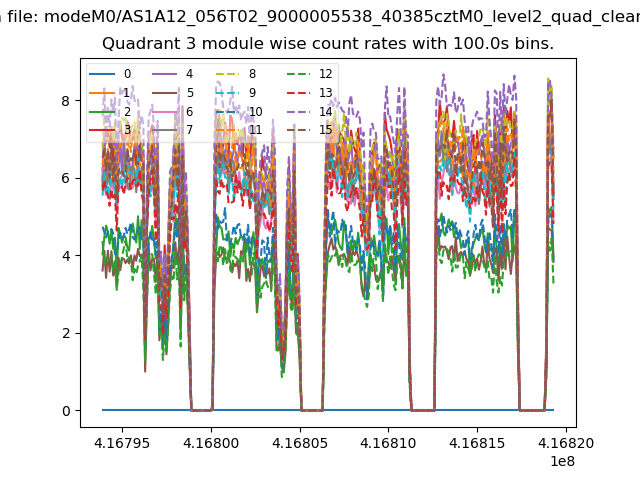 |
 |
| Parameter | Plot |
|---|---|
| CZT HV Monitor |  |
| D_VDD | 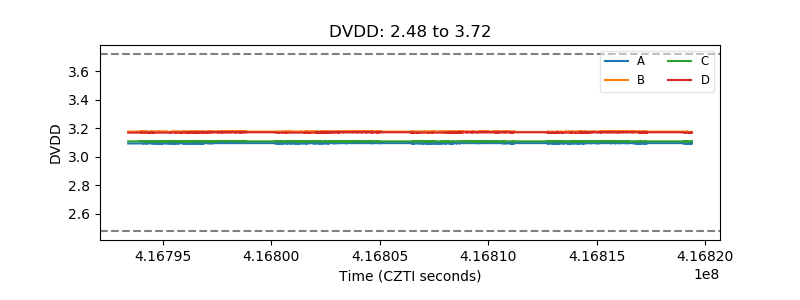 |
| Temperature 1 | 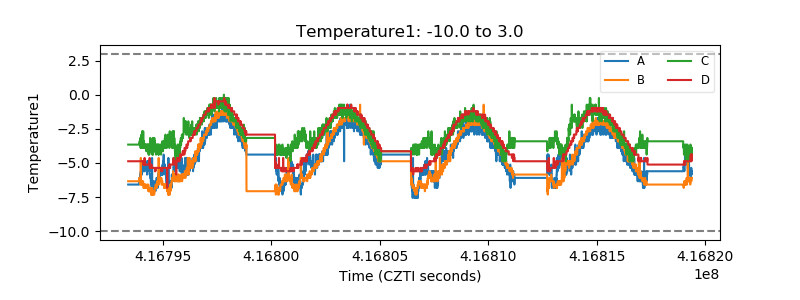 |
| Veto HV Monitor | 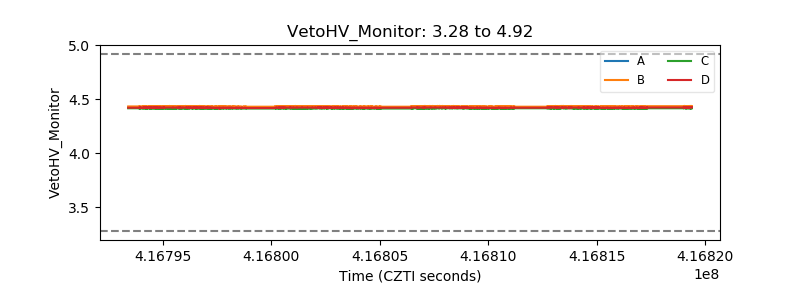 |
| Veto LLD | 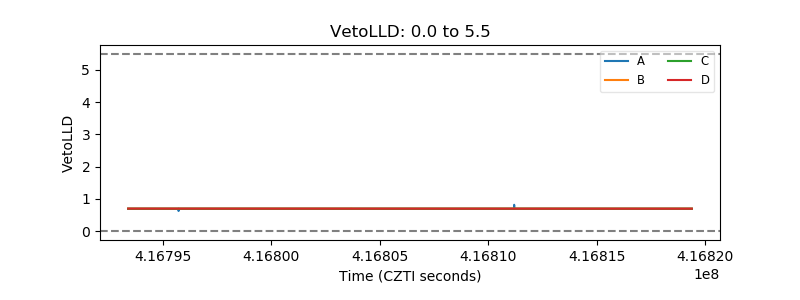 |
| Alpha Counter | 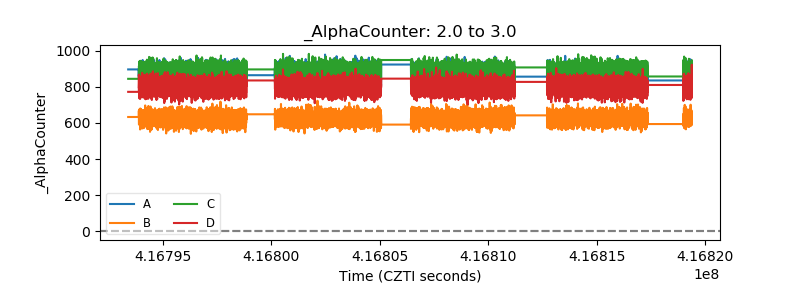 |
| _CPM_Rate | 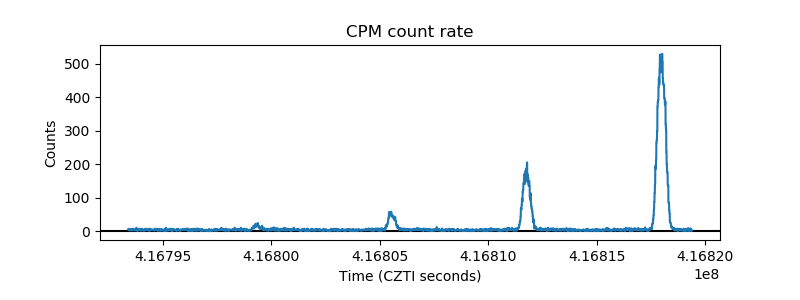 |
| CZT Counter | 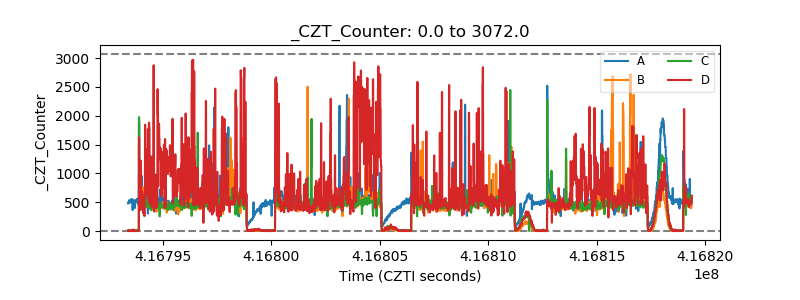 |
| +2.5 Volts monitor |  |
| +5 Volts monitor | 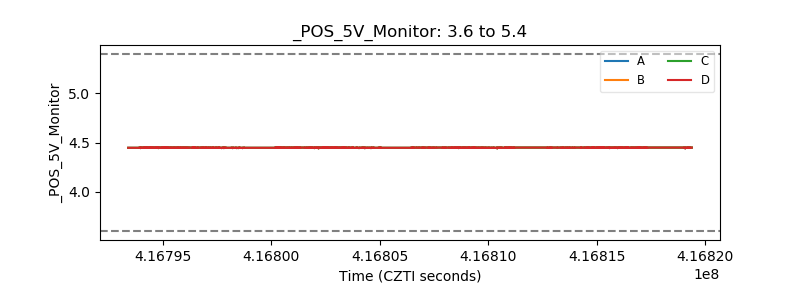 |
| _ROLL_ROT | 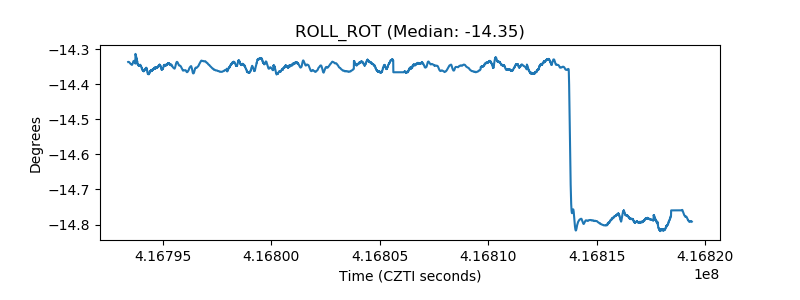 |
| _Roll_DEC | 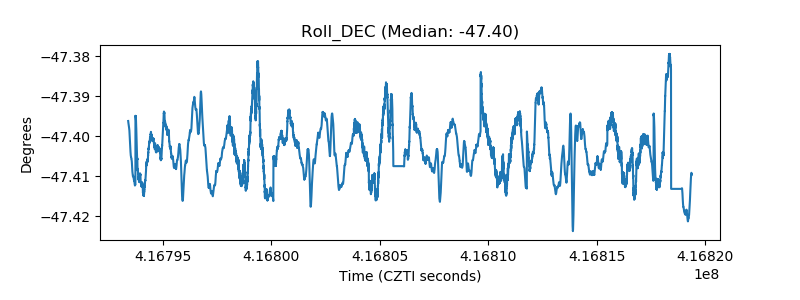 |
| _Roll_RA | 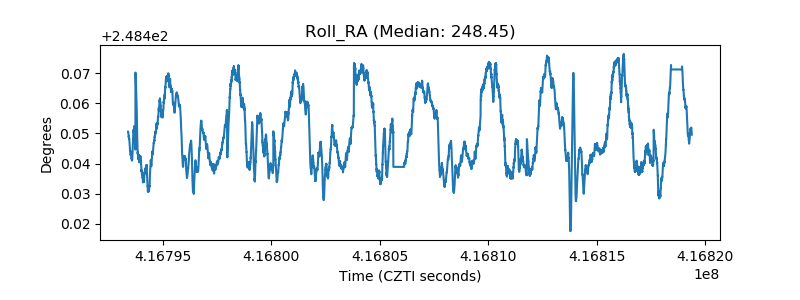 |
| Veto Counter | 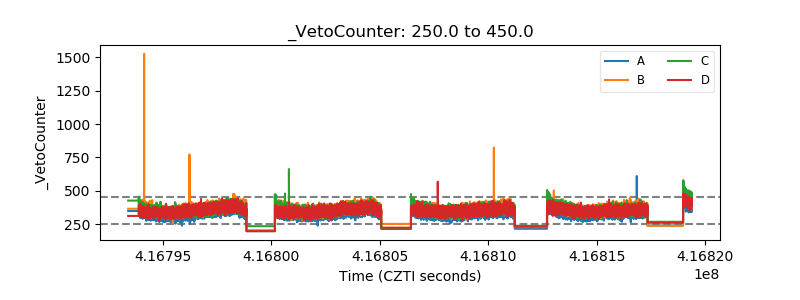 |