| Param | Original file | Final file |
|---|---|---|
| Filename | modeM0/AS1A12_056T02_9000005538_40386cztM0_level2.fits | modeM0/AS1A12_056T02_9000005538_40386cztM0_level2_quad_clean.evt |
| Size (bytes) | 609,580,800 | 170,913,600 |
| Size | 581.3 MB | 163.0 MB |
| Events in quadrant A | 5,705,474 | 1,179,021 |
| Events in quadrant B | 5,067,469 | 1,208,833 |
| Events in quadrant C | 4,973,405 | 1,162,903 |
| Events in quadrant D | 6,043,113 | 933,089 |
| Mode M0 | |||
|---|---|---|---|
| Quadrant | BADHDUFLAG | Total packets | Discarded packets |
| A | 0 | 22852 | 4 |
| B | 0 | 21384 | 3 |
| C | 0 | 20746 | 3 |
| D | 0 | 24440 | 3 |
| Mode M9 | |||
|---|---|---|---|
| Quadrant | BADHDUFLAG | Total packets | Discarded packets |
| A | 0 | 37 | 0 |
| B | 0 | 37 | 0 |
| C | 0 | 37 | 0 |
| D | 0 | 37 | 0 |
| Mode SS | |||
|---|---|---|---|
| Quadrant | BADHDUFLAG | Total packets | Discarded packets |
| A | 0 | 202 | 0 |
| B | 0 | 202 | 0 |
| C | 0 | 202 | 0 |
| D | 0 | 202 | 0 |
| Quadrant | Total seconds | Saturated seconds | Saturation percentage |
|---|---|---|---|
| A | 9974 | 96 | 0.962503% |
| B | 9974 | 30 | 0.300782% |
| C | 9974 | 21 | 0.210547% |
| D | 9975 | 1418 | 14.215539% |
Noise dominated data is calculated using 1-second bins in cleaned event files. If a bin has >2000 counts, and if more than 50% of those come from <1% of pixels, then it is considered to be noise-dominated and hence unusable.
| Quadrant | # 1 sec bins | Bins with >0 counts | Bins with >2000 counts | High rate bins dominated by noise | Noise dominated (total time) | Noise dominated (detector-on time) | Marked lightcurve |
|---|---|---|---|---|---|---|---|
| A | 13649 | 9976 | 62 | 62 | 0.45% | 0.62% | 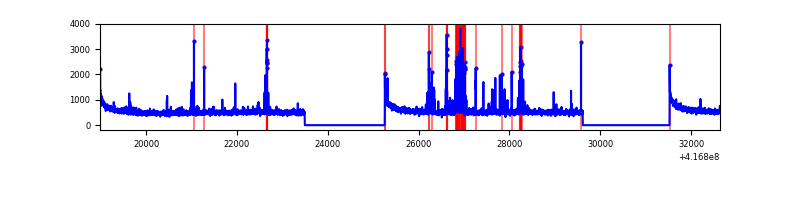 |
| B | 13649 | 9976 | 18 | 18 | 0.13% | 0.18% | 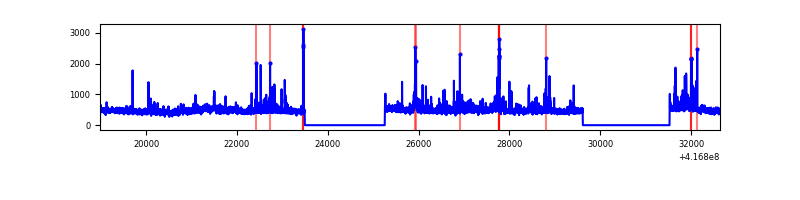 |
| C | 13649 | 9976 | 17 | 17 | 0.12% | 0.17% | 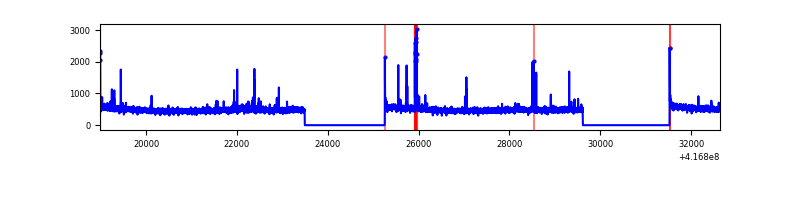 |
| D | 13650 | 9976 | 199 | 199 | 1.46% | 1.99% | 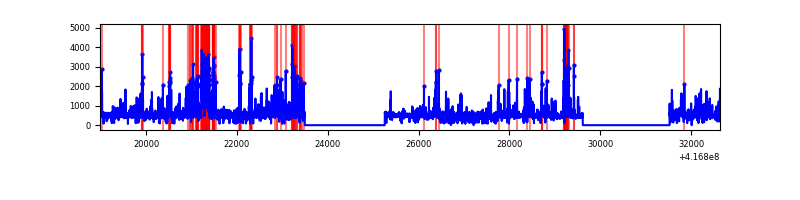 |
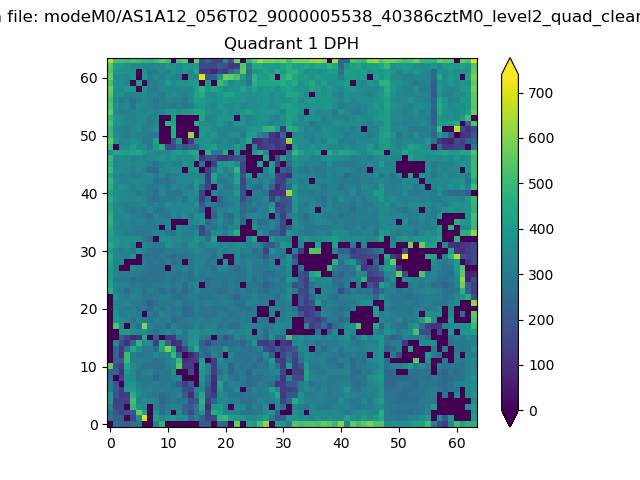
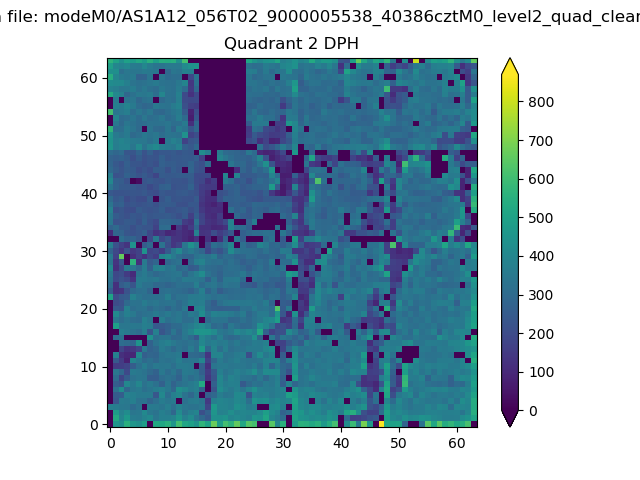
Top three noisy pixels from each quadrant. If the there are fewer than three noisy pixels in the level2.evt file, extra rows are filled as -1
| Pixel properties | Quadrant properties | ||||||
|---|---|---|---|---|---|---|---|
| Quadrant | DetID | PixID | Counts | Sigma | Mean | Median | Sigma |
| A | 10 | 83 | 830316 | 3573.18 | 1146 | 1125 | 232.1 |
| A | 13 | 248 | 350363 | 1504.95 | 1146 | 1125 | 232.1 |
| A | 2 | 79 | 44406 | 186.51 | 1146 | 1125 | 232.1 |
| B | 4 | 170 | 169554 | 781.46 | 1132 | 1101 | 215.6 |
| B | 4 | 171 | 147749 | 680.31 | 1132 | 1101 | 215.6 |
| B | 0 | 230 | 115814 | 532.16 | 1132 | 1101 | 215.6 |
| C | 15 | 214 | 430316 | 1663.7 | 1115 | 1123 | 258.0 |
| C | 14 | 254 | 83779 | 320.4 | 1115 | 1123 | 258.0 |
| C | 12 | 249 | 59872 | 227.73 | 1115 | 1123 | 258.0 |
| D | 2 | 250 | 834222 | 3311.26 | 1035 | 1009 | 251.6 |
| D | 12 | 128 | 403528 | 1599.65 | 1035 | 1009 | 251.6 |
| D | 12 | 191 | 361483 | 1432.55 | 1035 | 1009 | 251.6 |
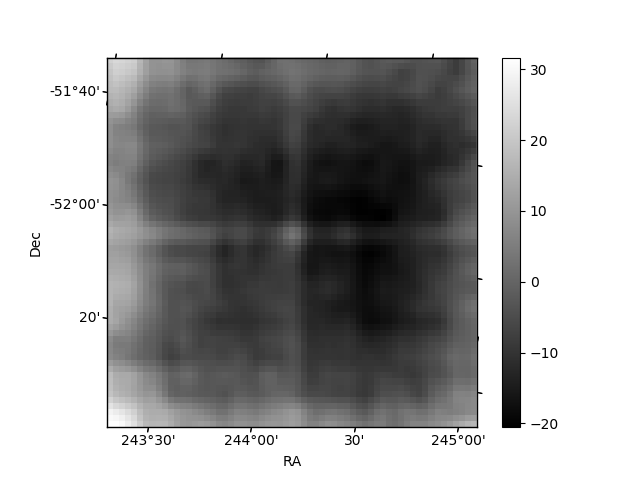
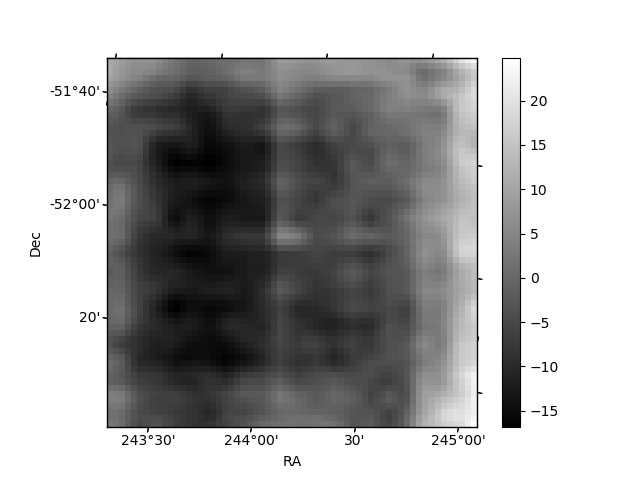
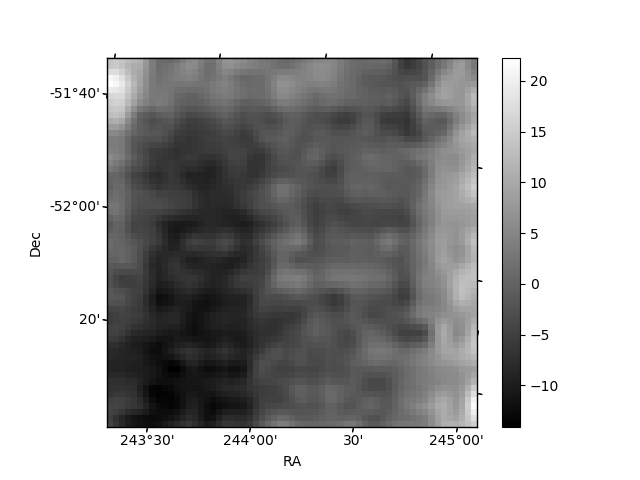
Histogram calculated using DETX and DETY for each event in the final _common_clean file
| Quadrant A | 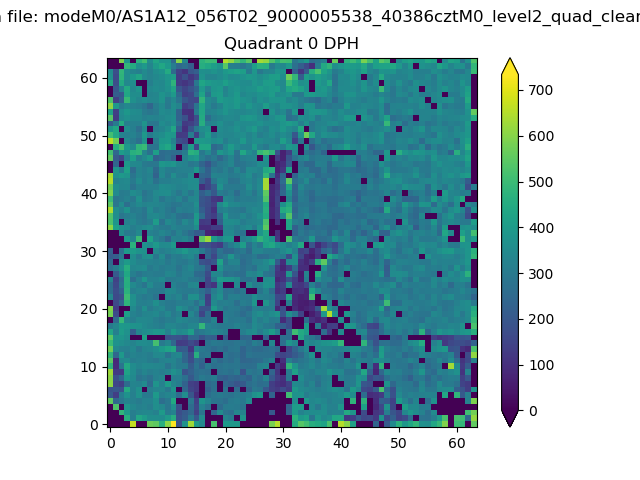 |
 |
Quadrant B |
|---|---|---|---|
| Quadrant D | 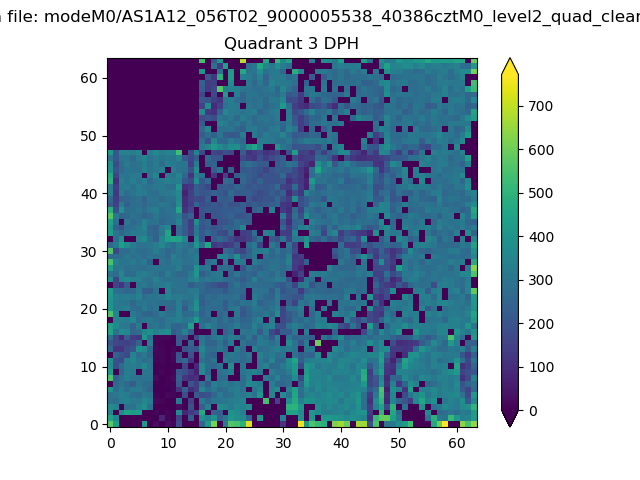 |
 |
Quadrant C |
| Plot type | Count rate plots | Images |
|---|---|---|
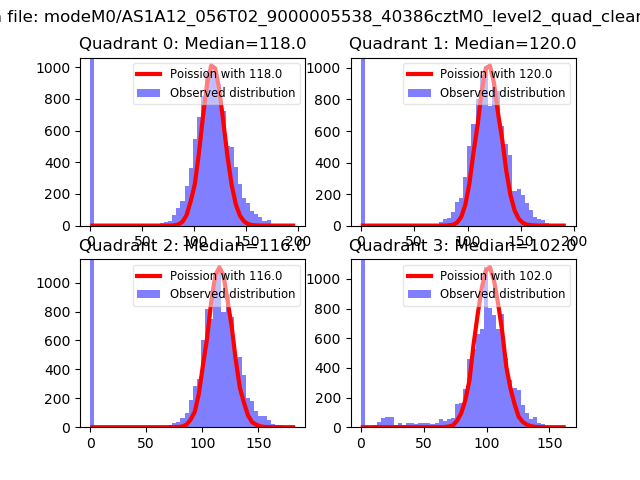
| Comparison with Poisson distribution Blue bars denote a histogram of data divided into 1 sec bins. Red curve is a Poisson curve with rate = median count rate of data. |
 |
 |
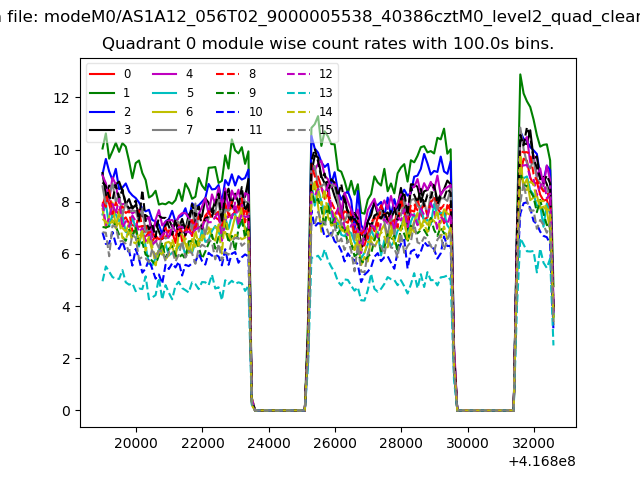
| Quadrant-wise count rates Data is divided into 100 sec bins |
 |
|
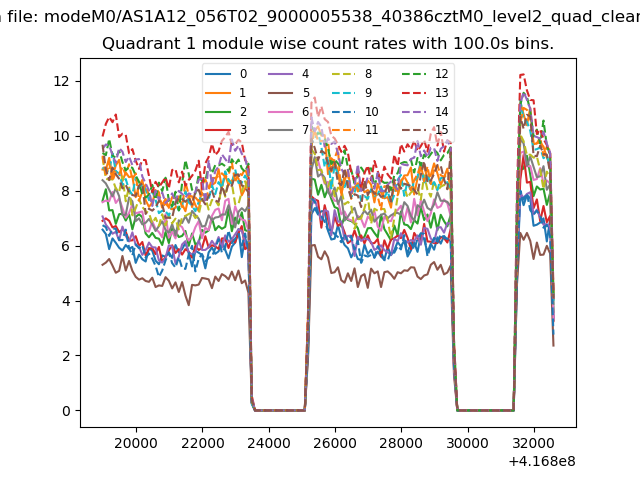
| Module-wise count rates for Quadrant A Data is divided into 100 sec bins |
 |
 |
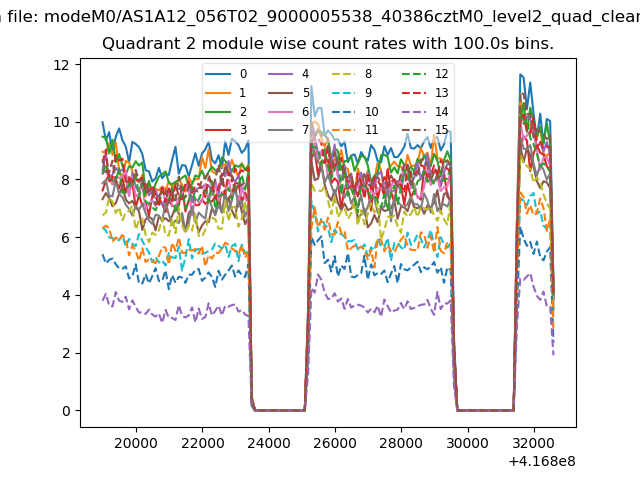
| Module-wise count rates for Quadrant B Data is divided into 100 sec bins |
 |
 |
| Module-wise count rates for Quadrant C Data is divided into 100 sec bins |
 |
 |
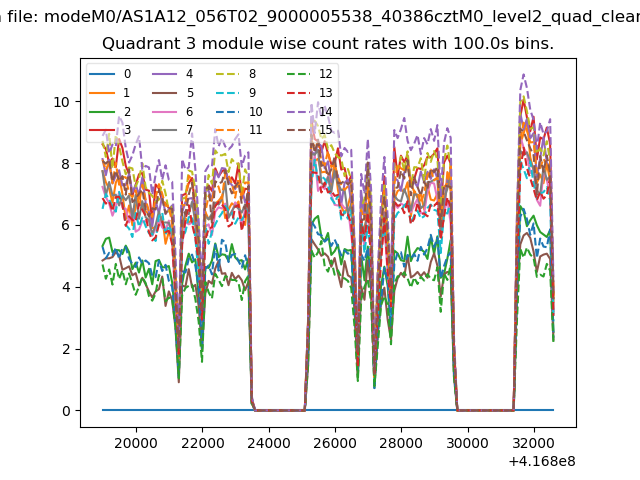
| Module-wise count rates for Quadrant D Data is divided into 100 sec bins |
 |
 |
| Parameter | Plot |
|---|---|
| CZT HV Monitor | 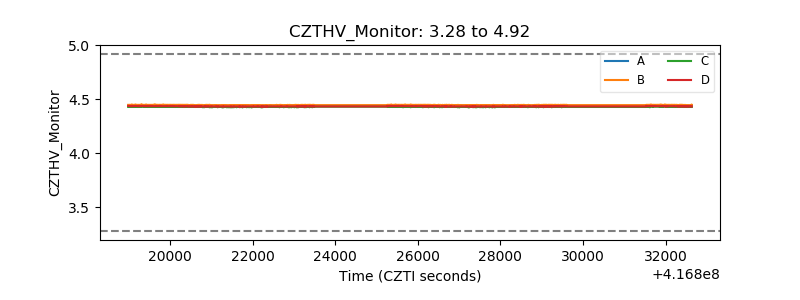 |
| D_VDD | 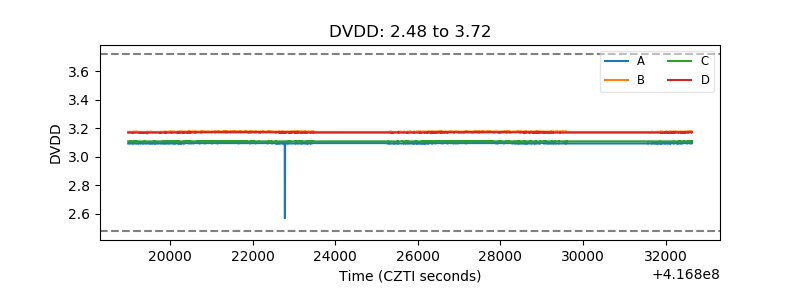 |
| Temperature 1 | 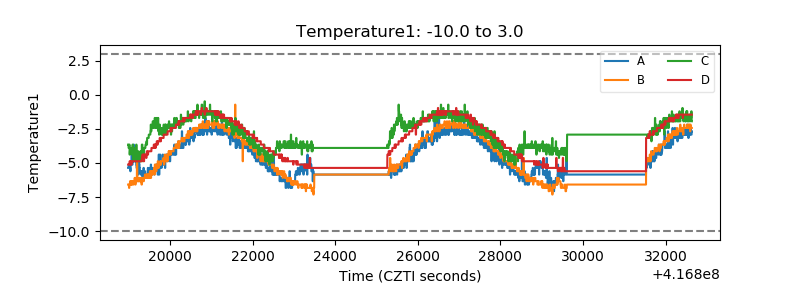 |
| Veto HV Monitor | 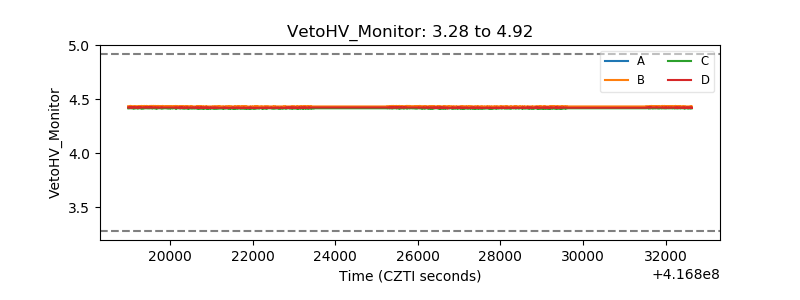 |
| Veto LLD | 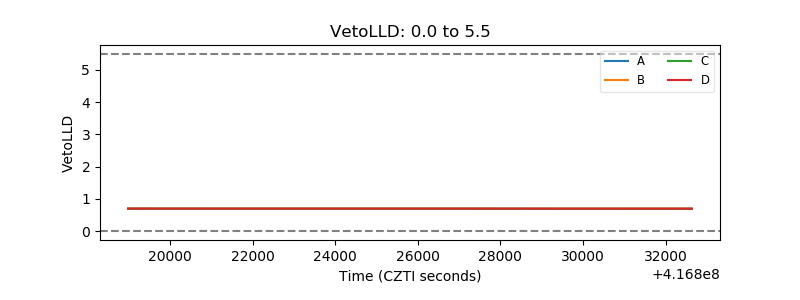 |
| Alpha Counter | 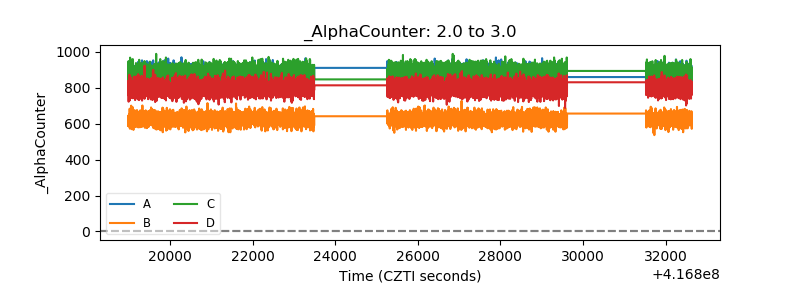 |
| _CPM_Rate | 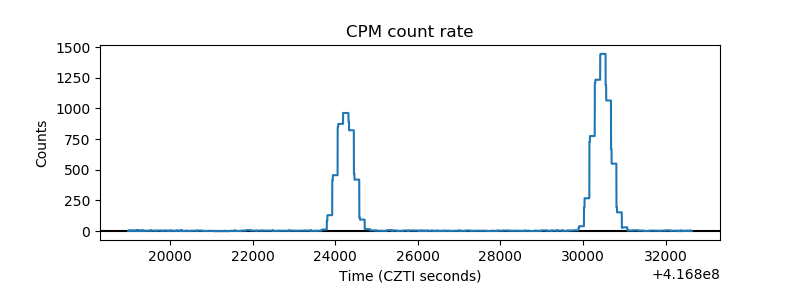 |
| CZT Counter | 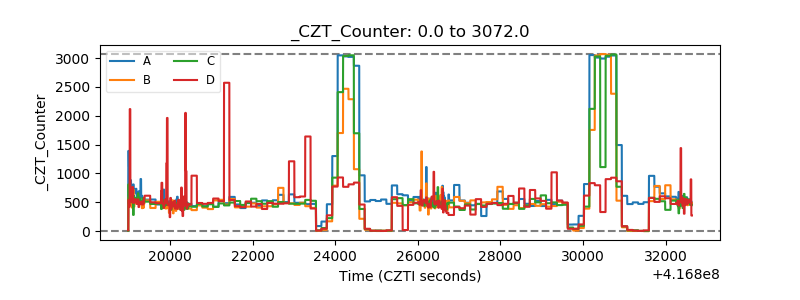 |
| +2.5 Volts monitor | 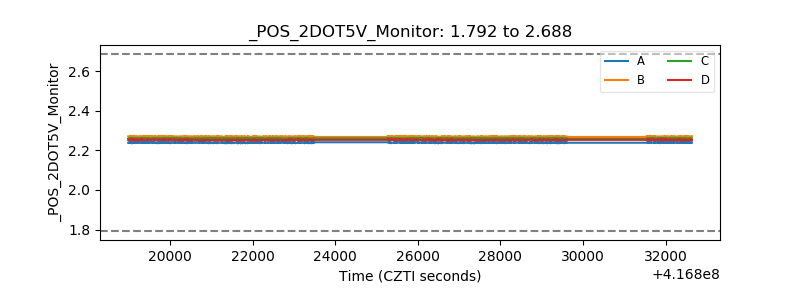 |
| +5 Volts monitor | 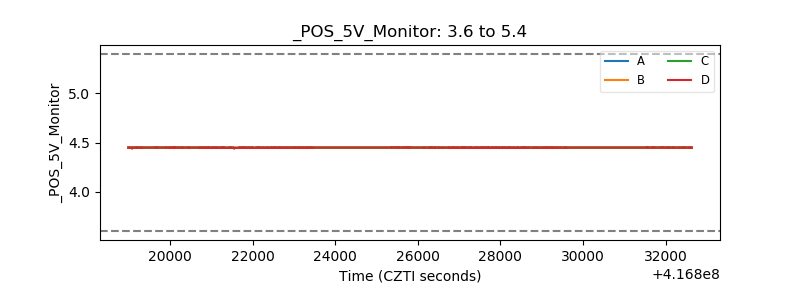 |
| _ROLL_ROT | 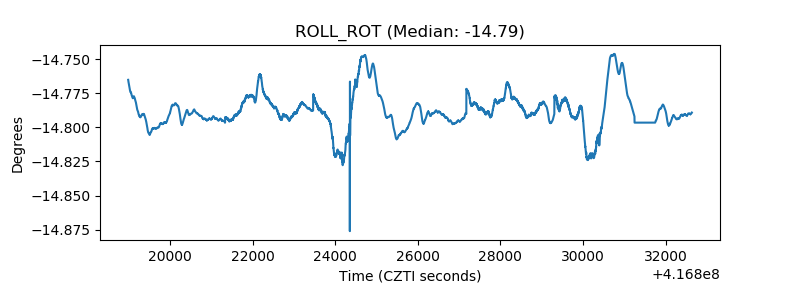 |
| _Roll_DEC | 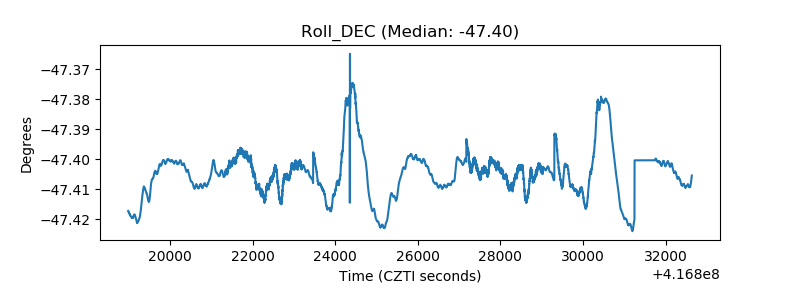 |
| _Roll_RA | 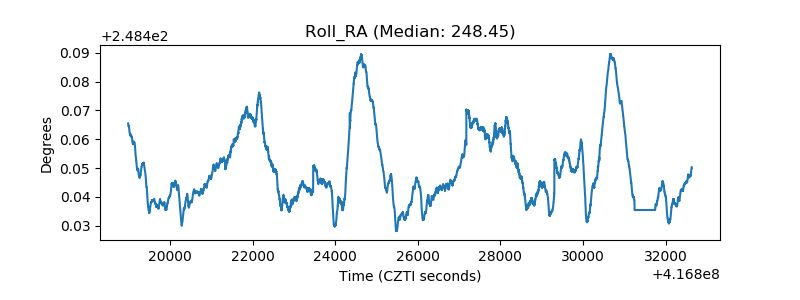 |
| Veto Counter | 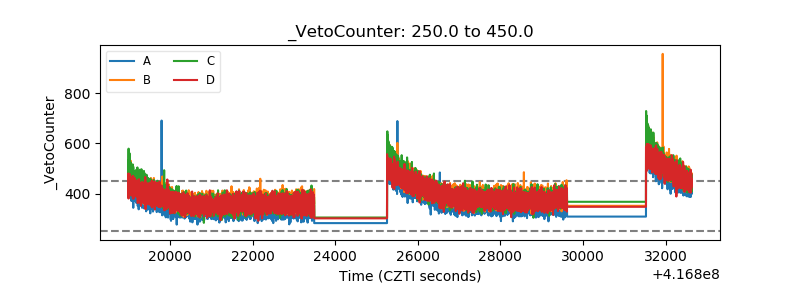 |