| Param | Original file | Final file |
|---|---|---|
| Filename | modeM0/AS1A12_056T02_9000005538_40387cztM0_level2.fits | modeM0/AS1A12_056T02_9000005538_40387cztM0_level2_quad_clean.evt |
| Size (bytes) | 354,602,880 | 99,852,480 |
| Size | 338.2 MB | 95.2 MB |
| Events in quadrant A | 3,274,912 | 698,494 |
| Events in quadrant B | 2,770,671 | 717,838 |
| Events in quadrant C | 2,739,606 | 681,467 |
| Events in quadrant D | 3,923,143 | 550,589 |
| Mode M0 | |||
|---|---|---|---|
| Quadrant | BADHDUFLAG | Total packets | Discarded packets |
| A | 0 | 13009 | 3 |
| B | 0 | 11489 | 2 |
| C | 0 | 11198 | 2 |
| D | 0 | 15077 | 2 |
| Mode M9 | |||
|---|---|---|---|
| Quadrant | BADHDUFLAG | Total packets | Discarded packets |
| A | 0 | 24 | 0 |
| B | 0 | 24 | 0 |
| C | 0 | 24 | 0 |
| D | 0 | 25 | 0 |
| Mode SS | |||
|---|---|---|---|
| Quadrant | BADHDUFLAG | Total packets | Discarded packets |
| A | 0 | 110 | 0 |
| B | 0 | 110 | 0 |
| C | 0 | 110 | 0 |
| D | 0 | 110 | 0 |
| Quadrant | Total seconds | Saturated seconds | Saturation percentage |
|---|---|---|---|
| A | 5361 | 70 | 1.305727% |
| B | 5361 | 13 | 0.242492% |
| C | 5361 | 11 | 0.205186% |
| D | 5361 | 810 | 15.109121% |
Noise dominated data is calculated using 1-second bins in cleaned event files. If a bin has >2000 counts, and if more than 50% of those come from <1% of pixels, then it is considered to be noise-dominated and hence unusable.
| Quadrant | # 1 sec bins | Bins with >0 counts | Bins with >2000 counts | High rate bins dominated by noise | Noise dominated (total time) | Noise dominated (detector-on time) | Marked lightcurve |
|---|---|---|---|---|---|---|---|
| A | 7394 | 5362 | 49 | 49 | 0.66% | 0.91% | 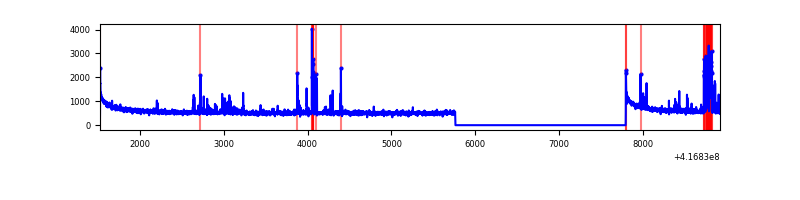 |
| B | 7394 | 5362 | 4 | 4 | 0.05% | 0.07% | 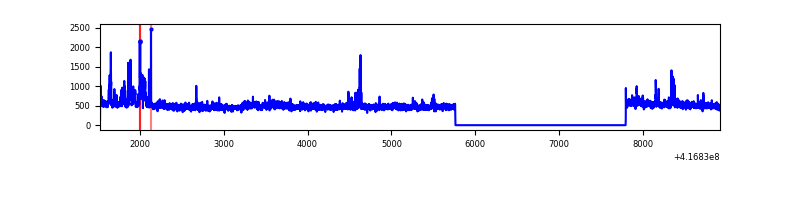 |
| C | 7394 | 5362 | 6 | 6 | 0.08% | 0.11% | 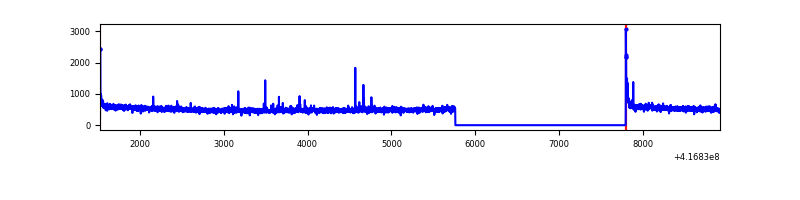 |
| D | 7394 | 5361 | 243 | 243 | 3.29% | 4.53% | 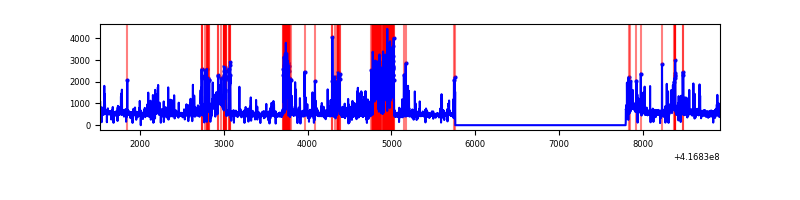 |
Top three noisy pixels from each quadrant. If the there are fewer than three noisy pixels in the level2.evt file, extra rows are filled as -1
| Pixel properties | Quadrant properties | ||||||
|---|---|---|---|---|---|---|---|
| Quadrant | DetID | PixID | Counts | Sigma | Mean | Median | Sigma |
| A | 10 | 83 | 479022 | 3666.49 | 651 | 642 | 130.5 |
| A | 13 | 248 | 228016 | 1742.68 | 651 | 642 | 130.5 |
| A | 7 | 191 | 33032 | 248.25 | 651 | 642 | 130.5 |
| B | 4 | 170 | 108362 | 888.61 | 643 | 626 | 121.2 |
| B | 0 | 245 | 66967 | 547.18 | 643 | 626 | 121.2 |
| B | 0 | 230 | 62488 | 510.24 | 643 | 626 | 121.2 |
| C | 15 | 214 | 234757 | 1628.7 | 626 | 631 | 143.7 |
| C | 0 | 10 | 36213 | 247.52 | 626 | 631 | 143.7 |
| C | 12 | 249 | 23500 | 159.09 | 626 | 631 | 143.7 |
| D | 2 | 250 | 876535 | 6103.22 | 587 | 571 | 143.5 |
| D | 13 | 249 | 245720 | 1708.06 | 587 | 571 | 143.5 |
| D | 12 | 191 | 185305 | 1287.12 | 587 | 571 | 143.5 |
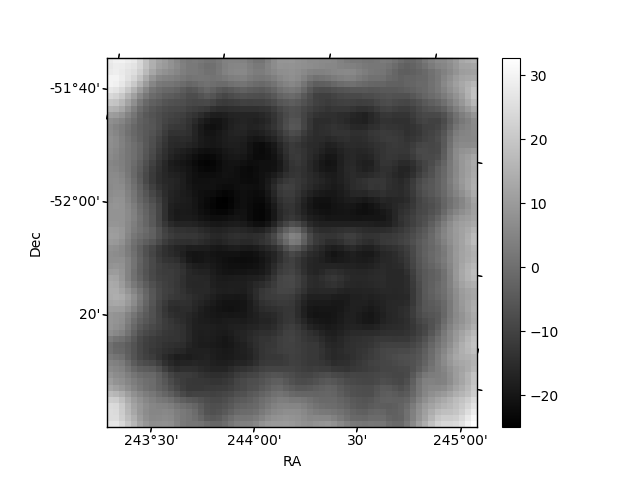
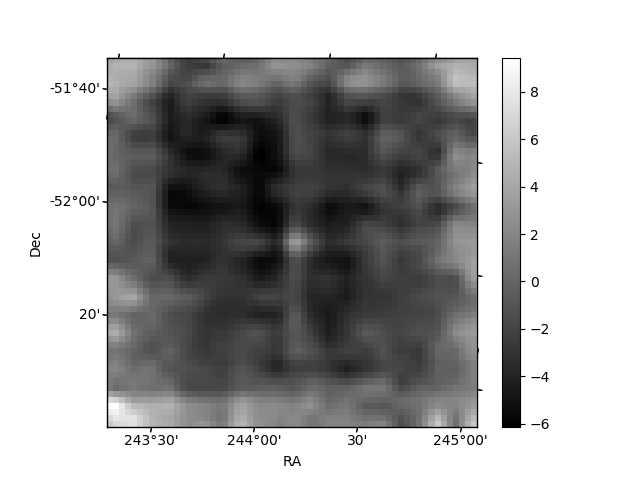
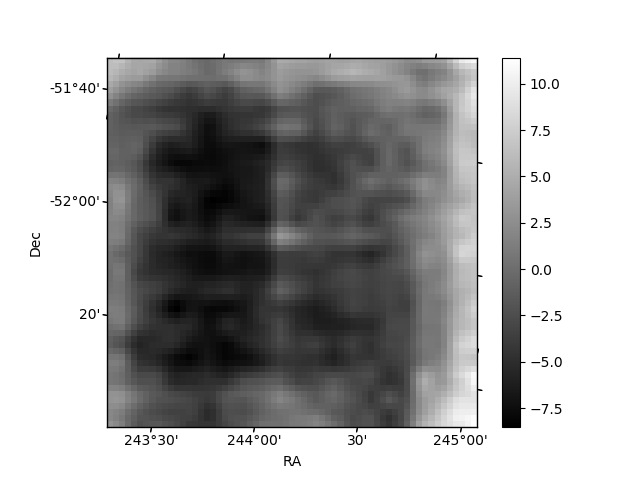
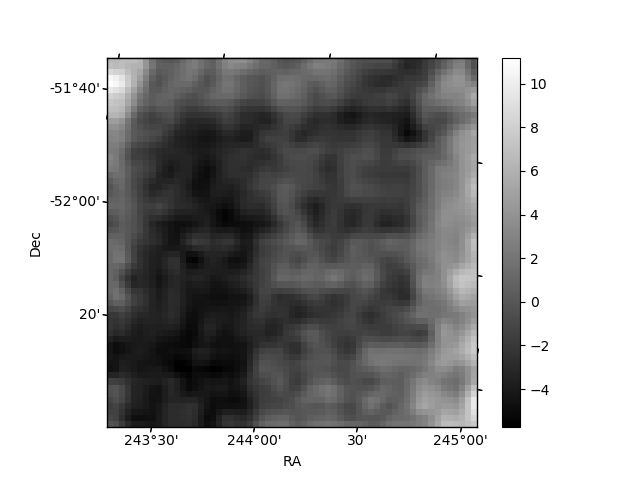
Histogram calculated using DETX and DETY for each event in the final _common_clean file
| Quadrant A | 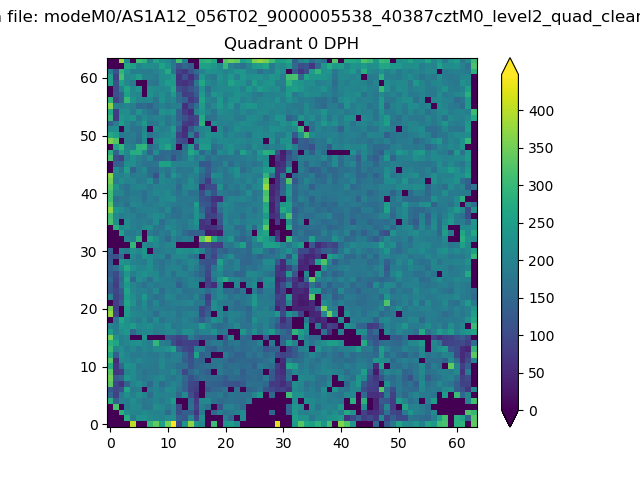 |
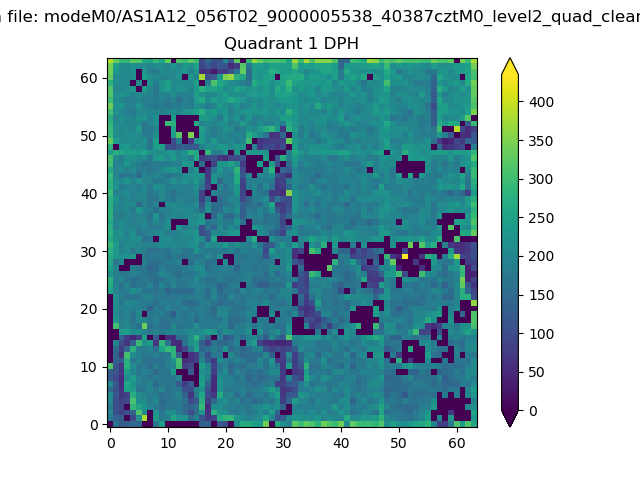 |
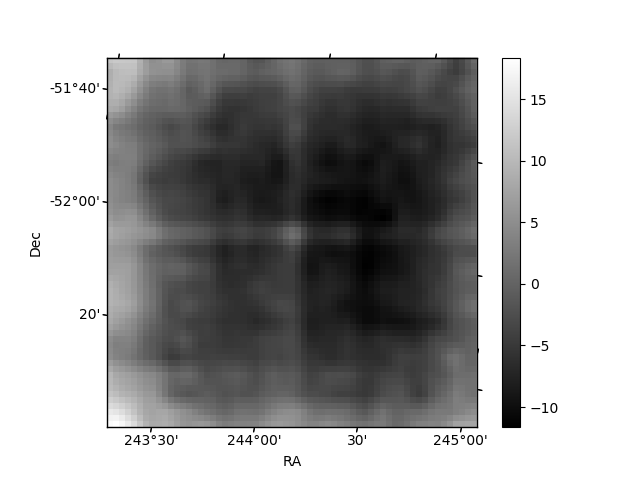
Quadrant B |
|---|---|---|---|
| Quadrant D | 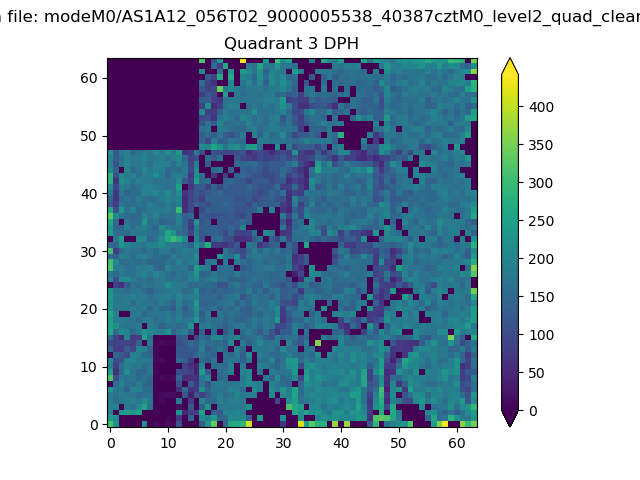 |
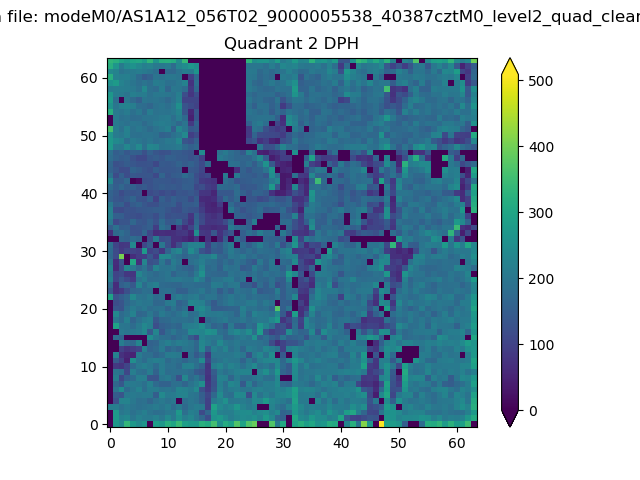 |
Quadrant C |
| Plot type | Count rate plots | Images |
|---|---|---|
| Comparison with Poisson distribution Blue bars denote a histogram of data divided into 1 sec bins. Red curve is a Poisson curve with rate = median count rate of data. |
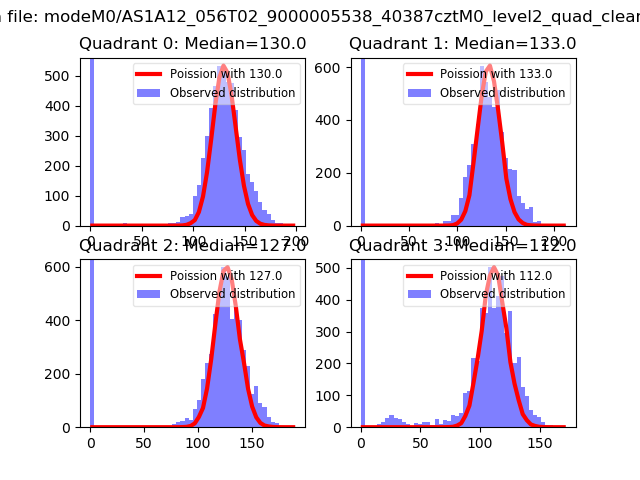 |
 |
| Quadrant-wise count rates Data is divided into 100 sec bins |
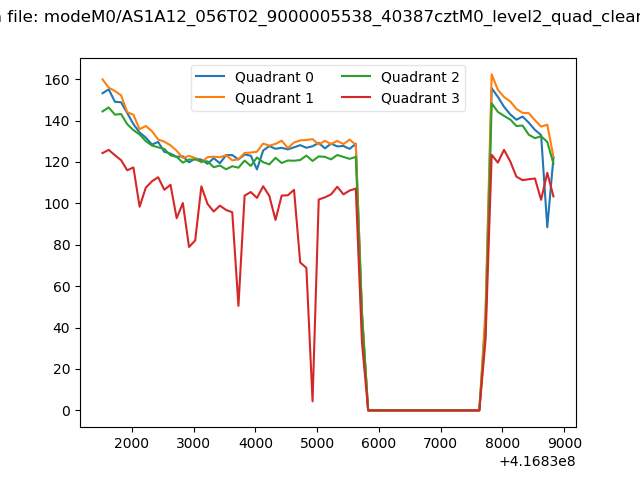 |
|
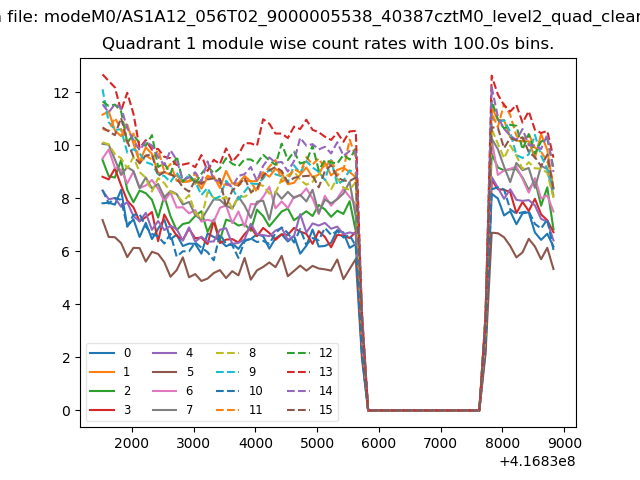
| Module-wise count rates for Quadrant A Data is divided into 100 sec bins |
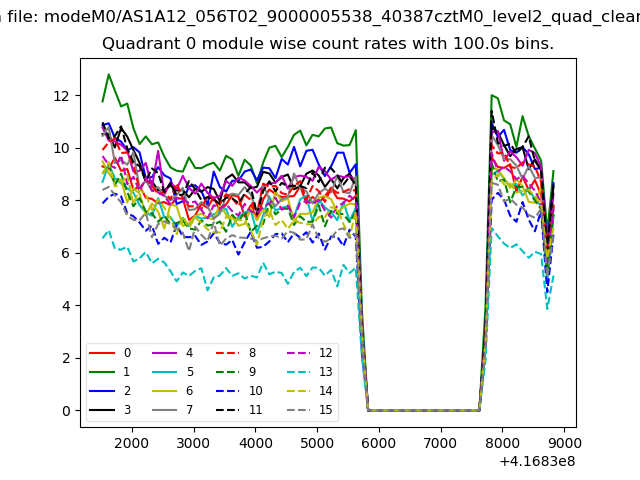 |
 |
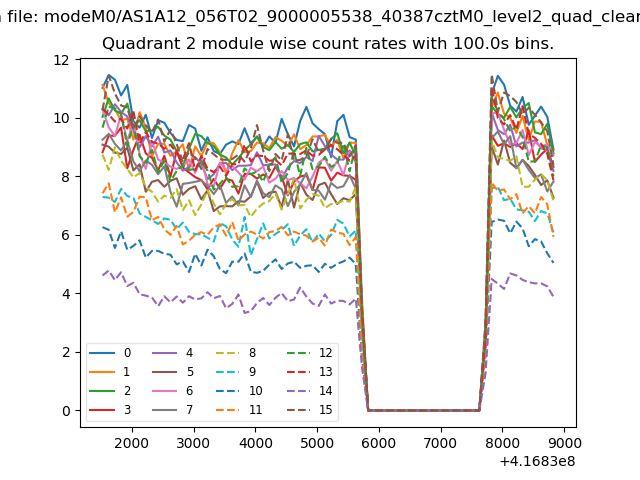
| Module-wise count rates for Quadrant B Data is divided into 100 sec bins |
 |
 |
| Module-wise count rates for Quadrant C Data is divided into 100 sec bins |
 |
 |
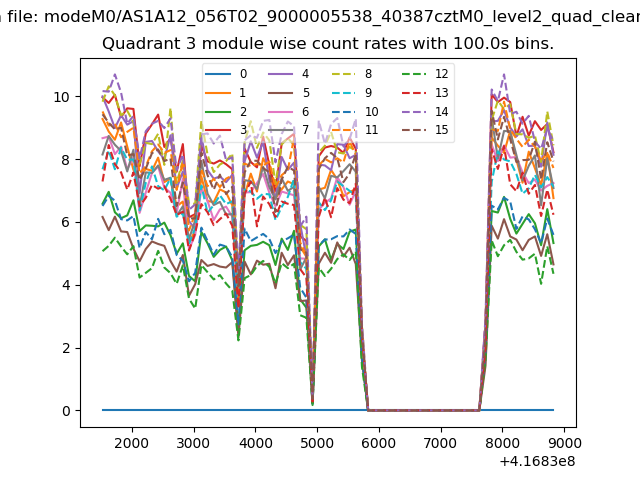
| Module-wise count rates for Quadrant D Data is divided into 100 sec bins |
 |
 |
| Parameter | Plot |
|---|---|
| CZT HV Monitor | 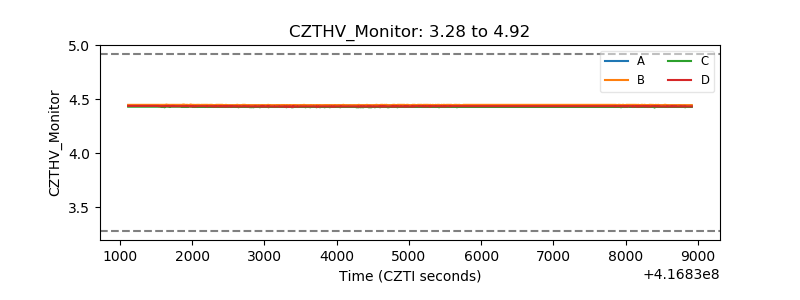 |
| D_VDD | 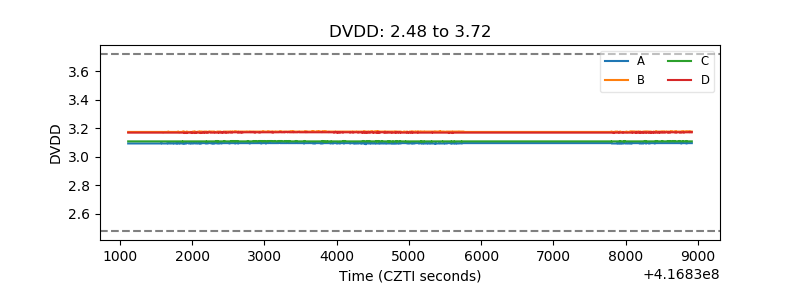 |
| Temperature 1 | 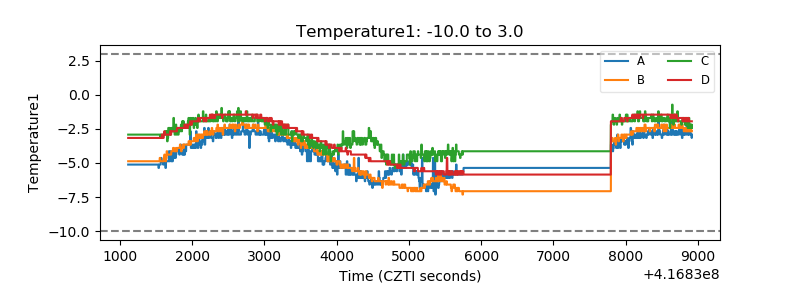 |
| Veto HV Monitor |  |
| Veto LLD | 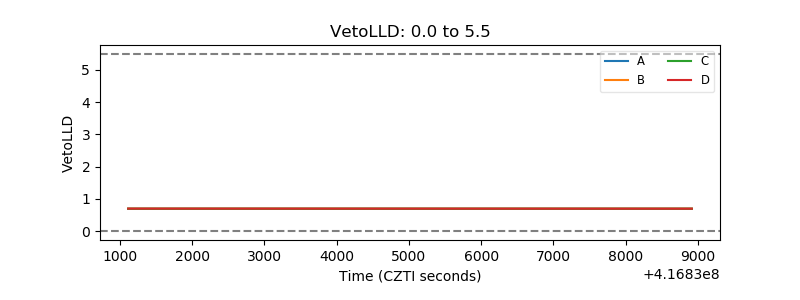 |
| Alpha Counter | 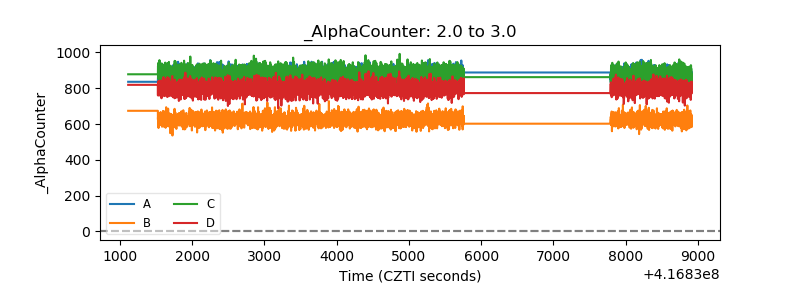 |
| _CPM_Rate | 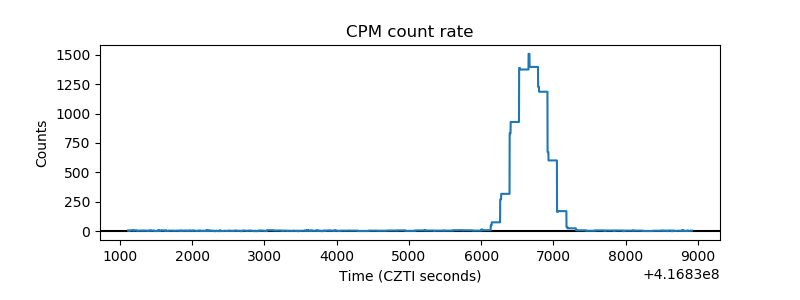 |
| CZT Counter | 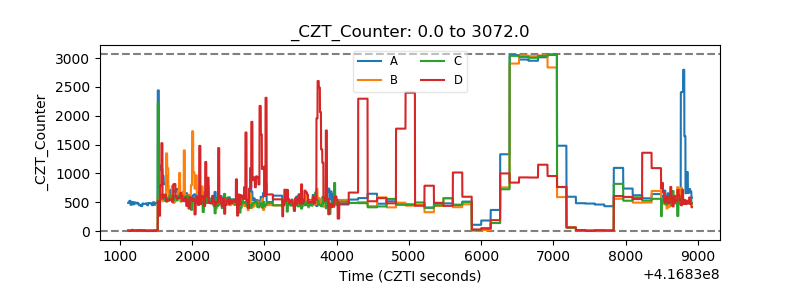 |
| +2.5 Volts monitor | 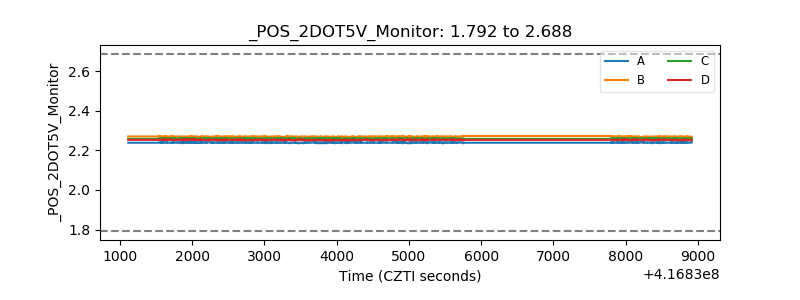 |
| +5 Volts monitor | 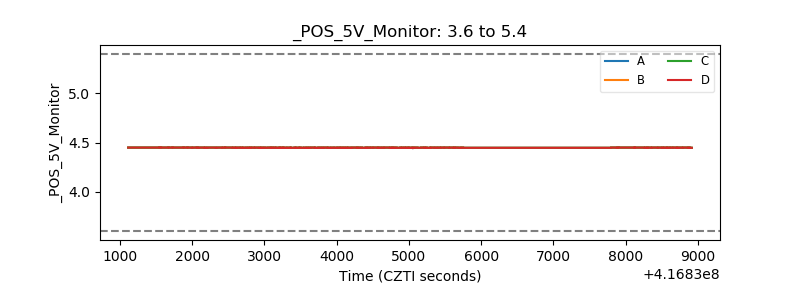 |
| _ROLL_ROT | 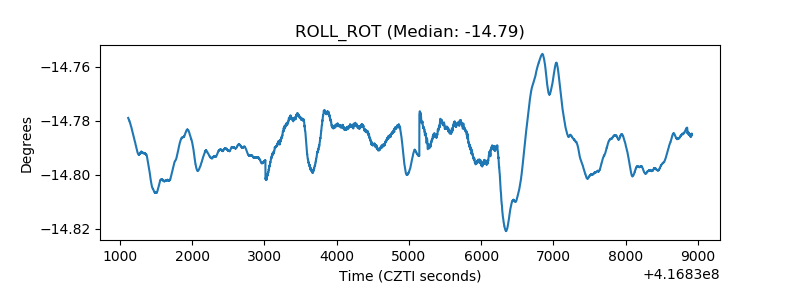 |
| _Roll_DEC | 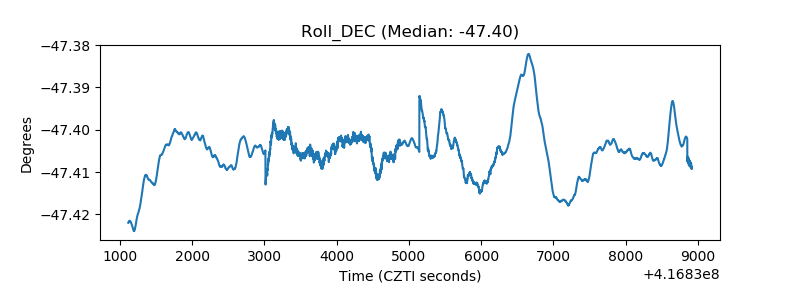 |
| _Roll_RA | 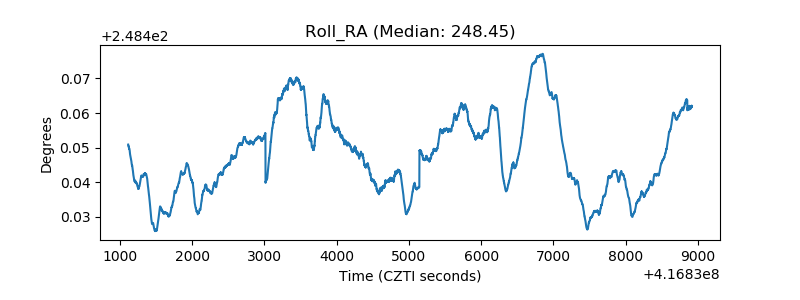 |
| Veto Counter | 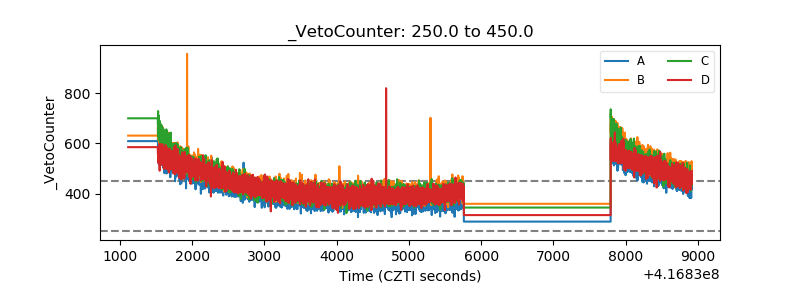 |