| Param | Original file | Final file |
|---|---|---|
| Filename | modeM0/AS1A12_056T02_9000005538_40388cztM0_level2.fits | modeM0/AS1A12_056T02_9000005538_40388cztM0_level2_quad_clean.evt |
| Size (bytes) | 323,058,240 | 98,190,720 |
| Size | 308.1 MB | 93.6 MB |
| Events in quadrant A | 3,267,261 | 681,792 |
| Events in quadrant B | 2,616,463 | 701,946 |
| Events in quadrant C | 2,663,663 | 660,572 |
| Events in quadrant D | 3,009,737 | 568,215 |
| Mode M0 | |||
|---|---|---|---|
| Quadrant | BADHDUFLAG | Total packets | Discarded packets |
| A | 0 | 12836 | 3 |
| B | 0 | 10780 | 2 |
| C | 0 | 10804 | 2 |
| D | 0 | 12188 | 2 |
| Mode M9 | |||
|---|---|---|---|
| Quadrant | BADHDUFLAG | Total packets | Discarded packets |
| A | 0 | 29 | 0 |
| B | 0 | 29 | 0 |
| C | 0 | 29 | 0 |
| D | 0 | 30 | 0 |
| Mode SS | |||
|---|---|---|---|
| Quadrant | BADHDUFLAG | Total packets | Discarded packets |
| A | 0 | 106 | 0 |
| B | 0 | 106 | 0 |
| C | 0 | 106 | 0 |
| D | 0 | 106 | 0 |
| Quadrant | Total seconds | Saturated seconds | Saturation percentage |
|---|---|---|---|
| A | 5148 | 103 | 2.000777% |
| B | 5148 | 14 | 0.271950% |
| C | 5148 | 17 | 0.330225% |
| D | 5148 | 441 | 8.566434% |
Noise dominated data is calculated using 1-second bins in cleaned event files. If a bin has >2000 counts, and if more than 50% of those come from <1% of pixels, then it is considered to be noise-dominated and hence unusable.
| Quadrant | # 1 sec bins | Bins with >0 counts | Bins with >2000 counts | High rate bins dominated by noise | Noise dominated (total time) | Noise dominated (detector-on time) | Marked lightcurve |
|---|---|---|---|---|---|---|---|
| A | 7240 | 5149 | 68 | 68 | 0.94% | 1.32% | 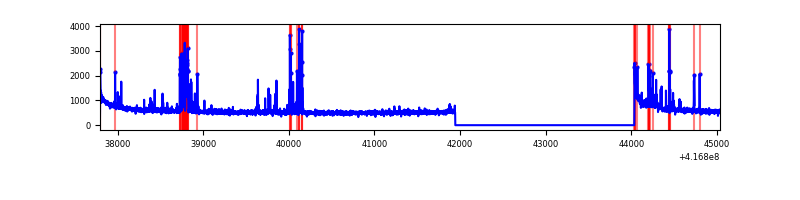 |
| B | 7240 | 5149 | 5 | 5 | 0.07% | 0.10% | 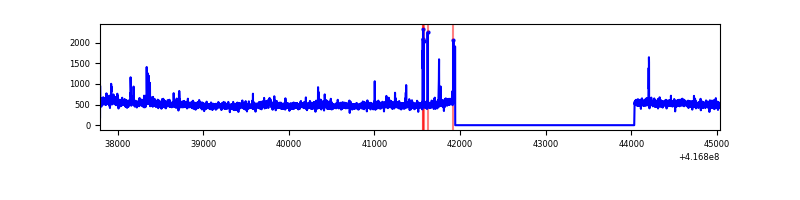 |
| C | 7240 | 5149 | 8 | 8 | 0.11% | 0.16% | 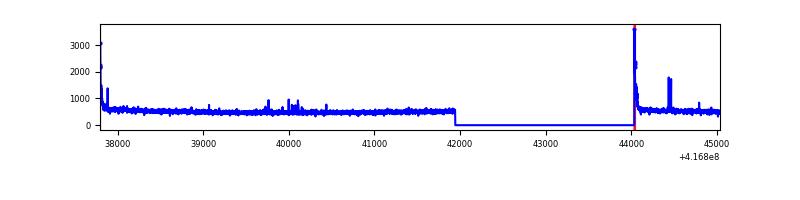 |
| D | 7240 | 5149 | 33 | 33 | 0.46% | 0.64% | 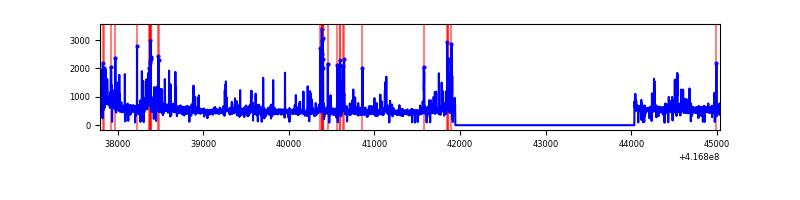 |
Top three noisy pixels from each quadrant. If the there are fewer than three noisy pixels in the level2.evt file, extra rows are filled as -1
| Pixel properties | Quadrant properties | ||||||
|---|---|---|---|---|---|---|---|
| Quadrant | DetID | PixID | Counts | Sigma | Mean | Median | Sigma |
| A | 10 | 83 | 477054 | 3774.89 | 628 | 619 | 126.2 |
| A | 13 | 248 | 301802 | 2386.33 | 628 | 619 | 126.2 |
| A | 7 | 191 | 42393 | 330.98 | 628 | 619 | 126.2 |
| B | 4 | 170 | 66313 | 557.39 | 624 | 610 | 117.9 |
| B | 0 | 230 | 43385 | 362.88 | 624 | 610 | 117.9 |
| B | 4 | 171 | 32464 | 270.23 | 624 | 610 | 117.9 |
| C | 15 | 214 | 223921 | 1602.75 | 604 | 609 | 139.3 |
| C | 0 | 10 | 64329 | 457.33 | 604 | 609 | 139.3 |
| C | 12 | 249 | 17393 | 120.46 | 604 | 609 | 139.3 |
| D | 2 | 250 | 179124 | 1249.64 | 584 | 570 | 142.9 |
| D | 12 | 191 | 169535 | 1182.53 | 584 | 570 | 142.9 |
| D | 13 | 171 | 109147 | 759.89 | 584 | 570 | 142.9 |
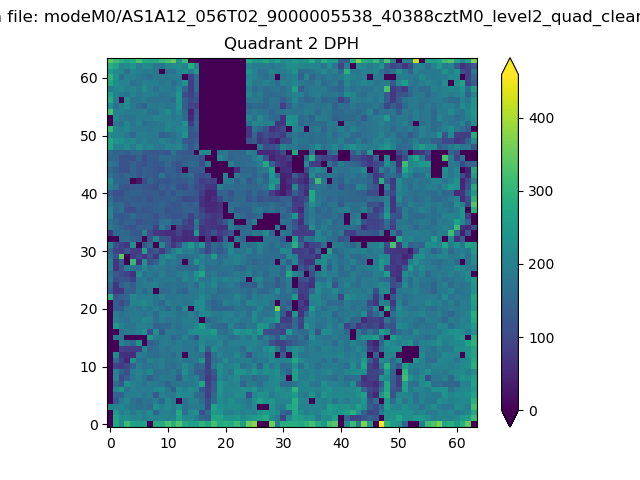
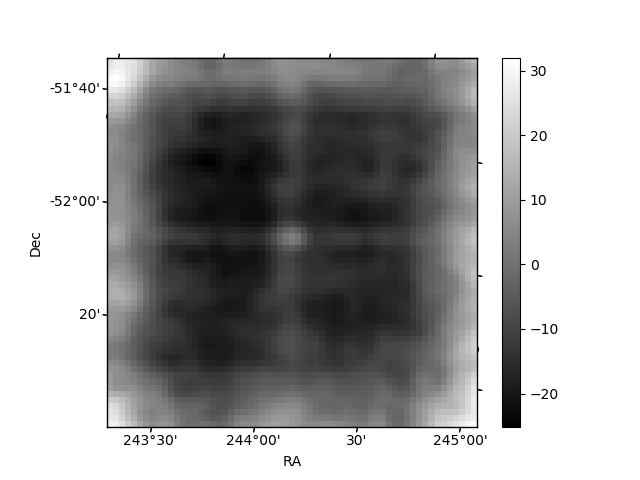
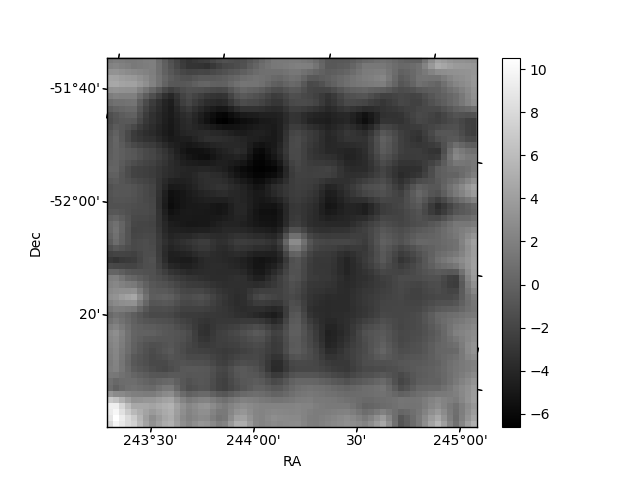
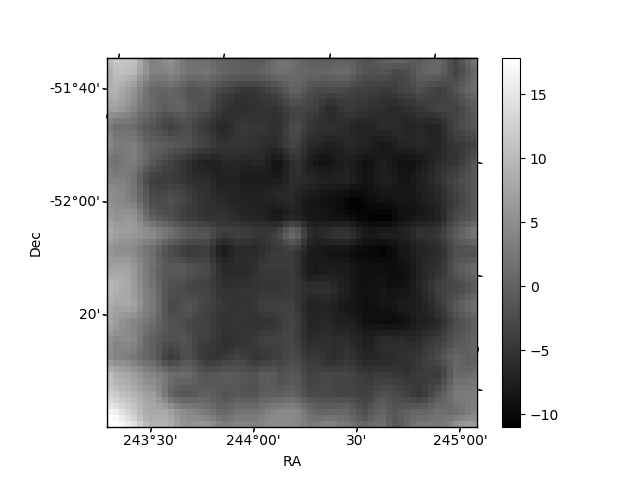
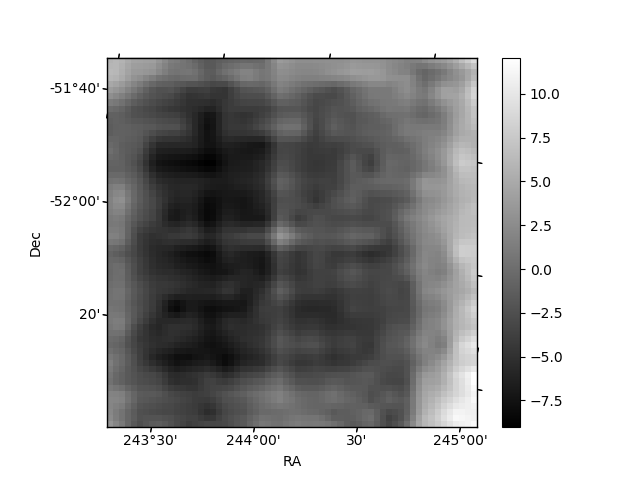
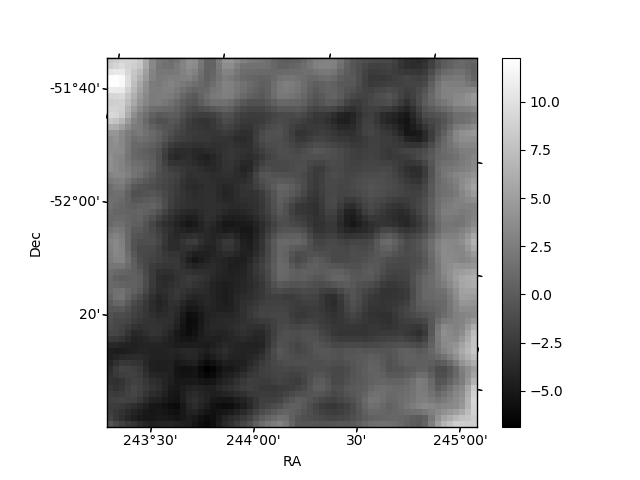
Histogram calculated using DETX and DETY for each event in the final _common_clean file
| Quadrant A | 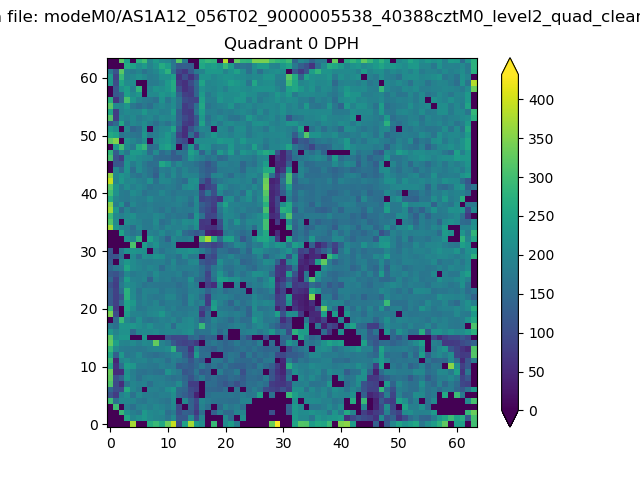 |
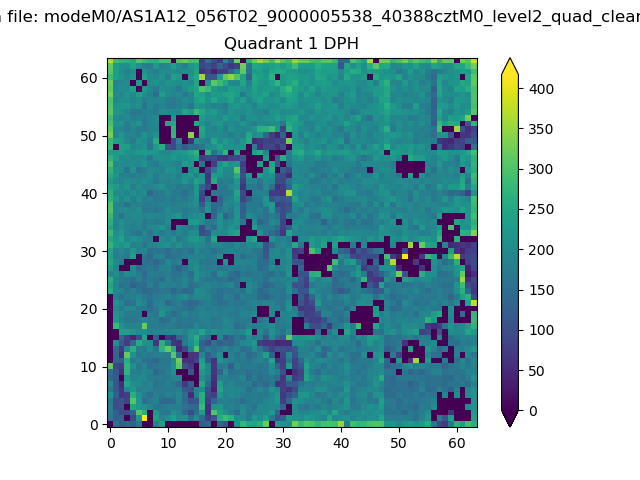 |
Quadrant B |
|---|---|---|---|
| Quadrant D | 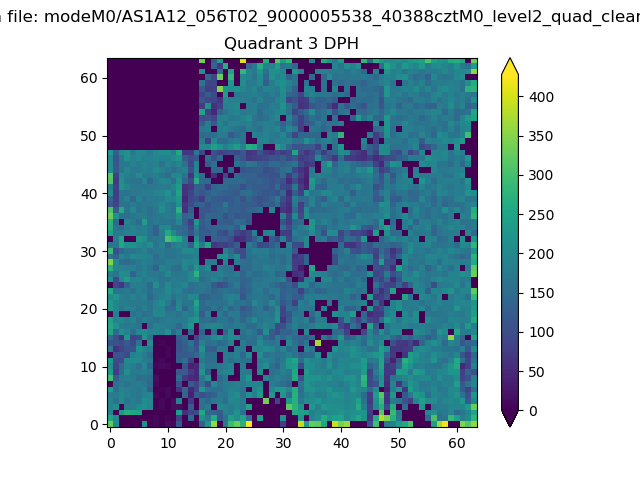 |
 |
Quadrant C |
| Plot type | Count rate plots | Images |
|---|---|---|
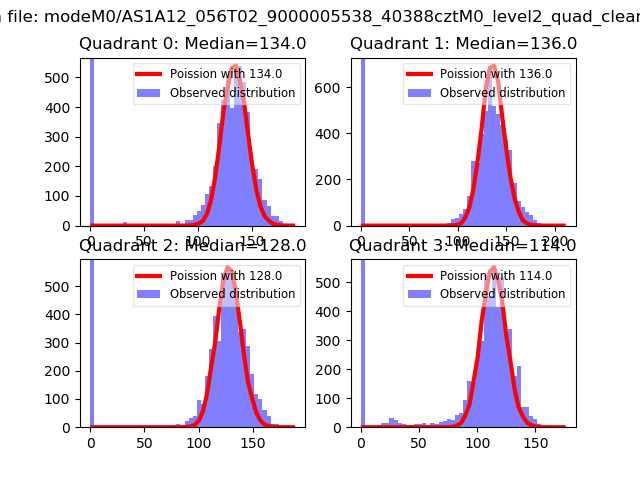
| Comparison with Poisson distribution Blue bars denote a histogram of data divided into 1 sec bins. Red curve is a Poisson curve with rate = median count rate of data. |
 |
 |
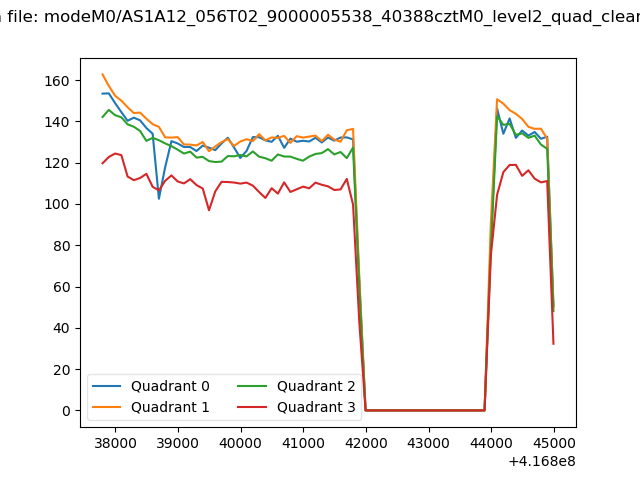
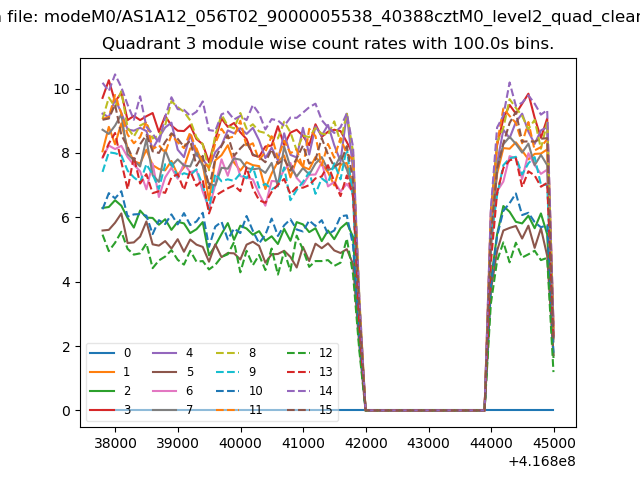
| Quadrant-wise count rates Data is divided into 100 sec bins |
 |
|
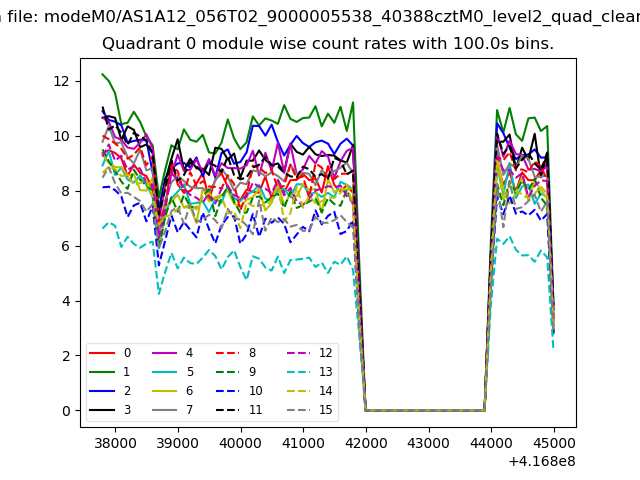
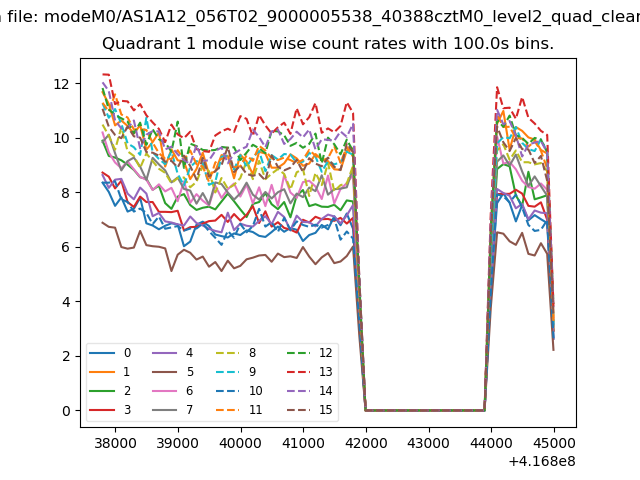
| Module-wise count rates for Quadrant A Data is divided into 100 sec bins |
 |
 |
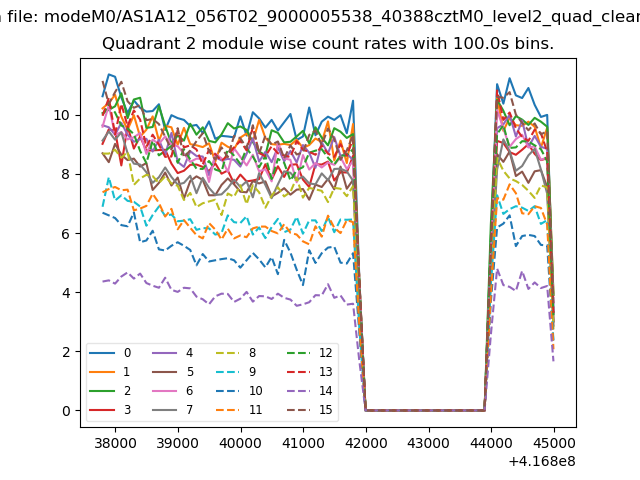
| Module-wise count rates for Quadrant B Data is divided into 100 sec bins |
 |
 |
| Module-wise count rates for Quadrant C Data is divided into 100 sec bins |
 |
 |
| Module-wise count rates for Quadrant D Data is divided into 100 sec bins |
 |
 |
| Parameter | Plot |
|---|---|
| CZT HV Monitor | 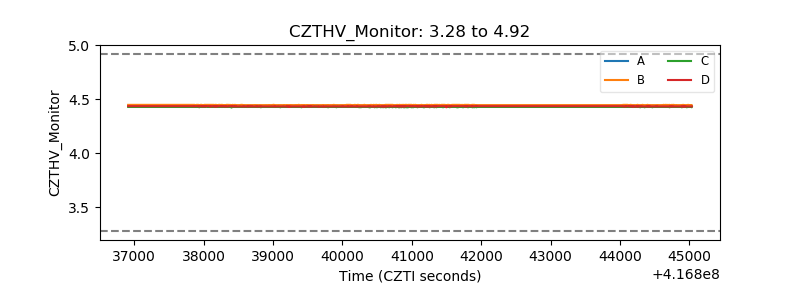 |
| D_VDD | 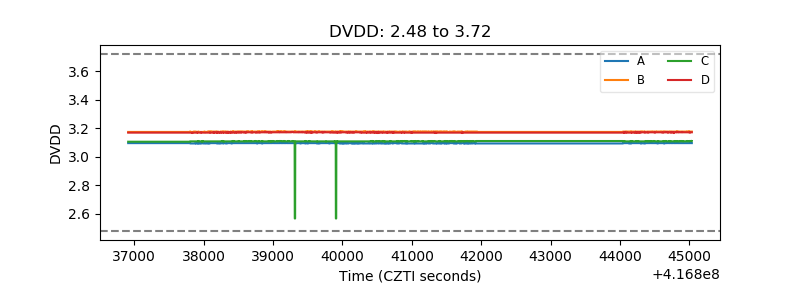 |
| Temperature 1 | 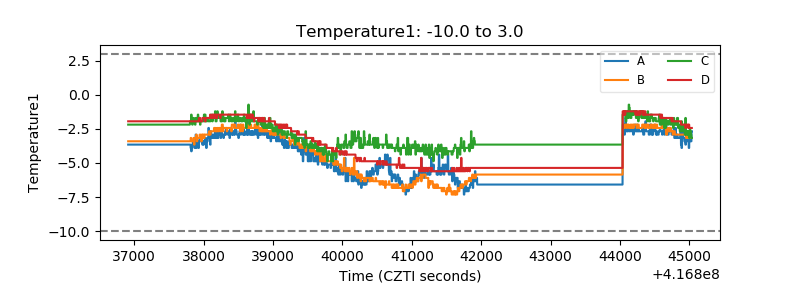 |
| Veto HV Monitor | 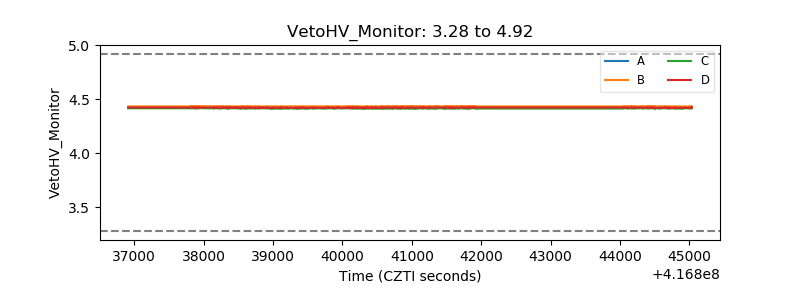 |
| Veto LLD | 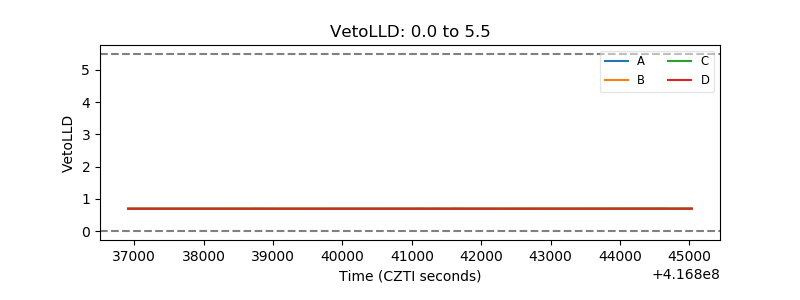 |
| Alpha Counter | 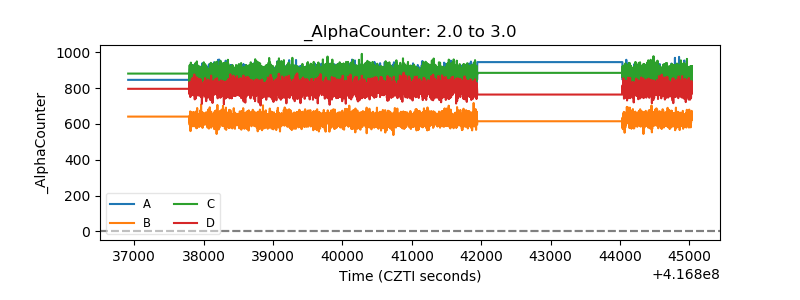 |
| _CPM_Rate | 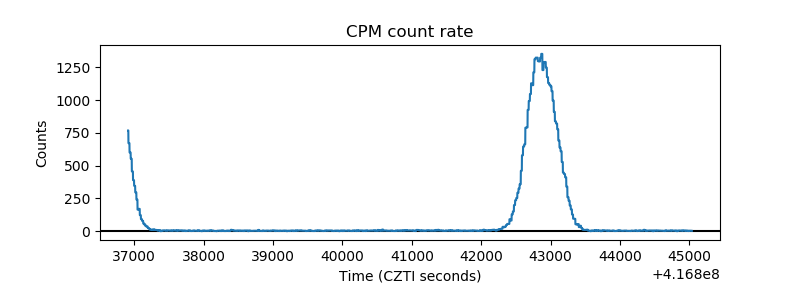 |
| CZT Counter | 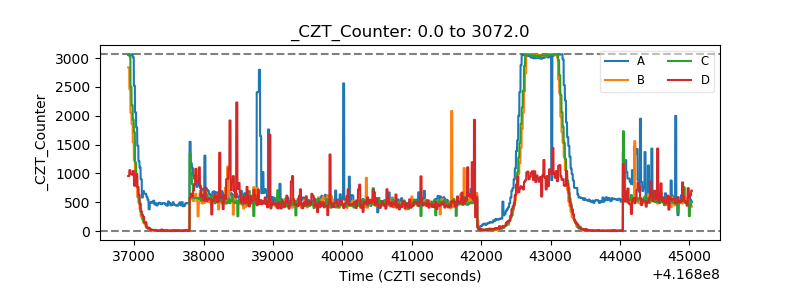 |
| +2.5 Volts monitor | 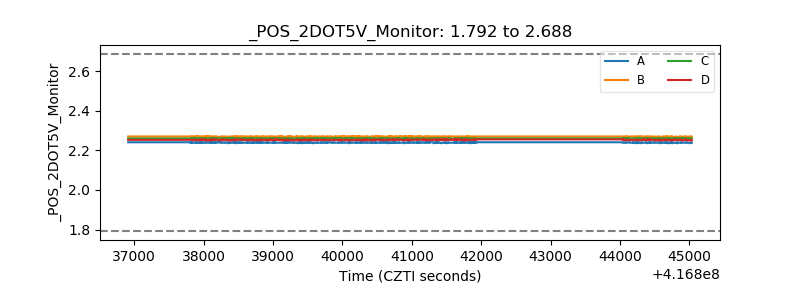 |
| +5 Volts monitor | 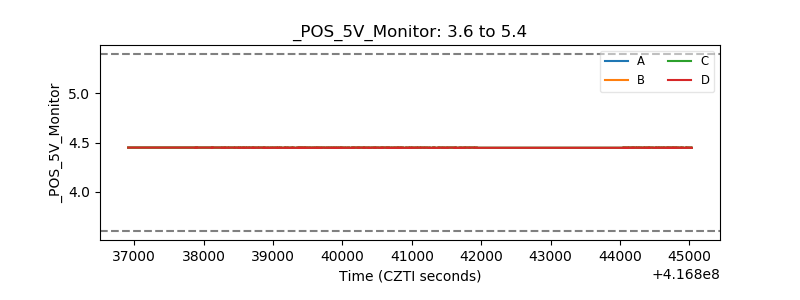 |
| _ROLL_ROT | 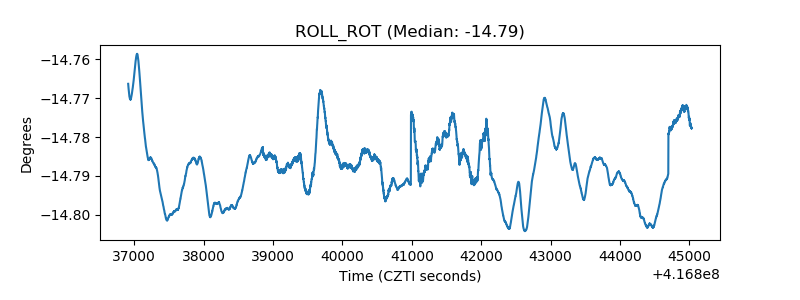 |
| _Roll_DEC | 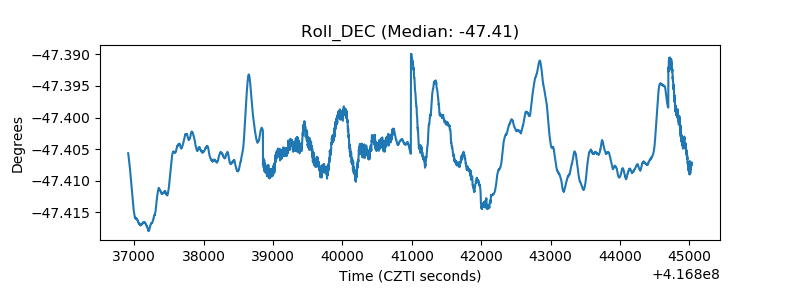 |
| _Roll_RA | 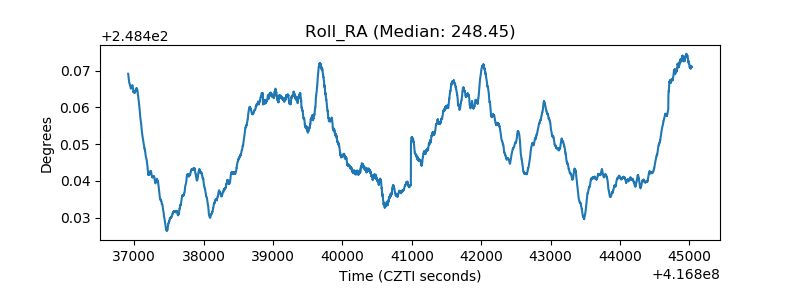 |
| Veto Counter | 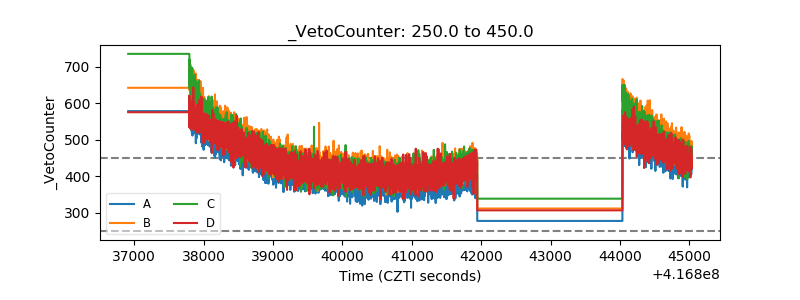 |