| Param | Original file | Final file |
|---|---|---|
| Filename | modeM0/AS1A12_056T02_9000005538_40389cztM0_level2.fits | modeM0/AS1A12_056T02_9000005538_40389cztM0_level2_quad_clean.evt |
| Size (bytes) | 305,035,200 | 93,467,520 |
| Size | 290.9 MB | 89.1 MB |
| Events in quadrant A | 3,004,809 | 646,591 |
| Events in quadrant B | 2,485,769 | 667,181 |
| Events in quadrant C | 2,557,731 | 627,224 |
| Events in quadrant D | 2,851,598 | 537,835 |
| Mode M0 | |||
|---|---|---|---|
| Quadrant | BADHDUFLAG | Total packets | Discarded packets |
| A | 0 | 11898 | 3 |
| B | 0 | 10317 | 2 |
| C | 0 | 10465 | 2 |
| D | 0 | 11691 | 2 |
| Mode M9 | |||
|---|---|---|---|
| Quadrant | BADHDUFLAG | Total packets | Discarded packets |
| A | 0 | 33 | 0 |
| B | 0 | 33 | 0 |
| C | 0 | 33 | 0 |
| D | 0 | 34 | 0 |
| Mode SS | |||
|---|---|---|---|
| Quadrant | BADHDUFLAG | Total packets | Discarded packets |
| A | 0 | 102 | 0 |
| B | 0 | 102 | 0 |
| C | 0 | 102 | 0 |
| D | 0 | 102 | 0 |
| Quadrant | Total seconds | Saturated seconds | Saturation percentage |
|---|---|---|---|
| A | 5018 | 69 | 1.375050% |
| B | 5018 | 9 | 0.179354% |
| C | 5018 | 15 | 0.298924% |
| D | 5018 | 418 | 8.330012% |
Noise dominated data is calculated using 1-second bins in cleaned event files. If a bin has >2000 counts, and if more than 50% of those come from <1% of pixels, then it is considered to be noise-dominated and hence unusable.
| Quadrant | # 1 sec bins | Bins with >0 counts | Bins with >2000 counts | High rate bins dominated by noise | Noise dominated (total time) | Noise dominated (detector-on time) | Marked lightcurve |
|---|---|---|---|---|---|---|---|
| A | 7141 | 5019 | 36 | 36 | 0.50% | 0.72% | 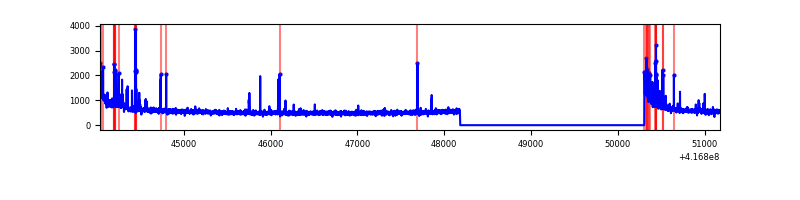 |
| B | 7141 | 5019 | 0 | 0 | 0.00% | 0.00% | 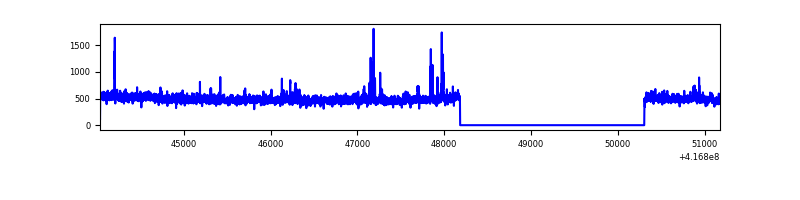 |
| C | 7141 | 5019 | 8 | 8 | 0.11% | 0.16% | 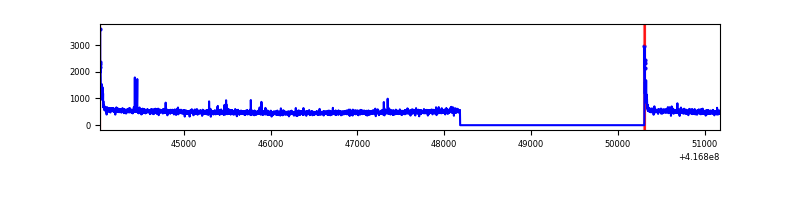 |
| D | 7141 | 5019 | 27 | 27 | 0.38% | 0.54% | 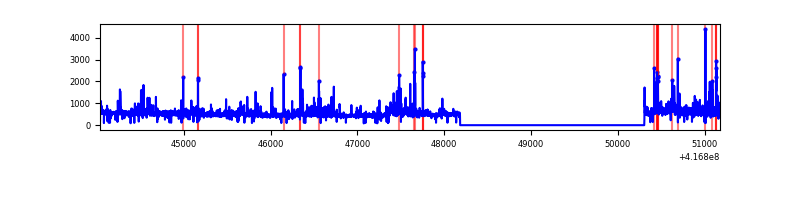 |
Top three noisy pixels from each quadrant. If the there are fewer than three noisy pixels in the level2.evt file, extra rows are filled as -1
| Pixel properties | Quadrant properties | ||||||
|---|---|---|---|---|---|---|---|
| Quadrant | DetID | PixID | Counts | Sigma | Mean | Median | Sigma |
| A | 10 | 83 | 472933 | 3950.25 | 597 | 588 | 119.6 |
| A | 13 | 248 | 175533 | 1463.08 | 597 | 588 | 119.6 |
| A | 7 | 191 | 27565 | 225.61 | 597 | 588 | 119.6 |
| B | 0 | 230 | 68241 | 598.49 | 595 | 581 | 113.1 |
| B | 4 | 170 | 42954 | 374.81 | 595 | 581 | 113.1 |
| B | 4 | 171 | 19393 | 166.4 | 595 | 581 | 113.1 |
| C | 15 | 214 | 218603 | 1637.57 | 574 | 578 | 133.1 |
| C | 0 | 10 | 70377 | 524.26 | 574 | 578 | 133.1 |
| C | 12 | 249 | 25759 | 189.13 | 574 | 578 | 133.1 |
| D | 12 | 191 | 161431 | 1178.37 | 552 | 538 | 136.5 |
| D | 13 | 171 | 138278 | 1008.8 | 552 | 538 | 136.5 |
| D | 12 | 128 | 128706 | 938.7 | 552 | 538 | 136.5 |
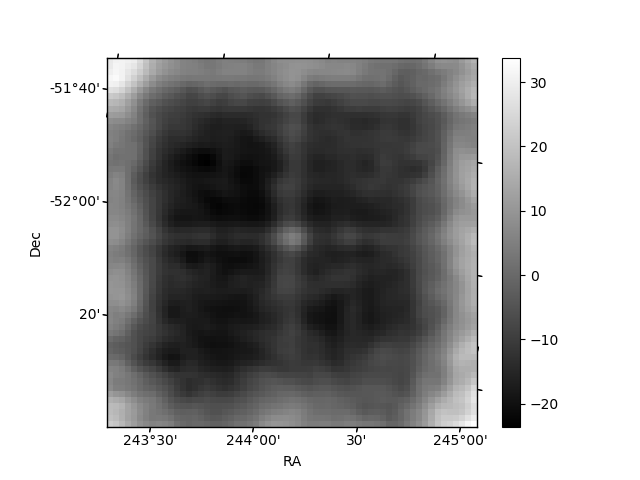
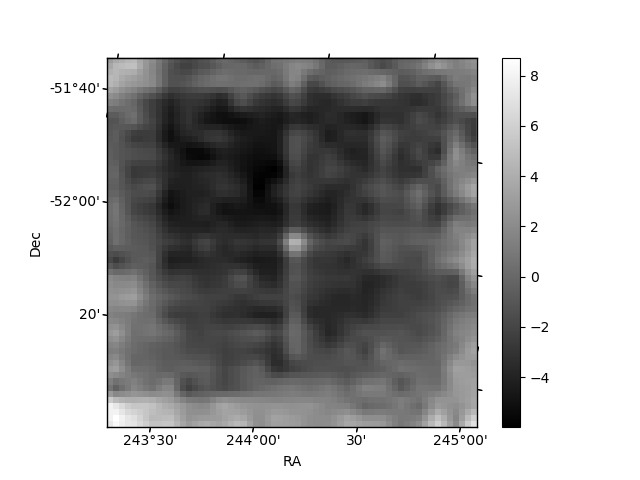
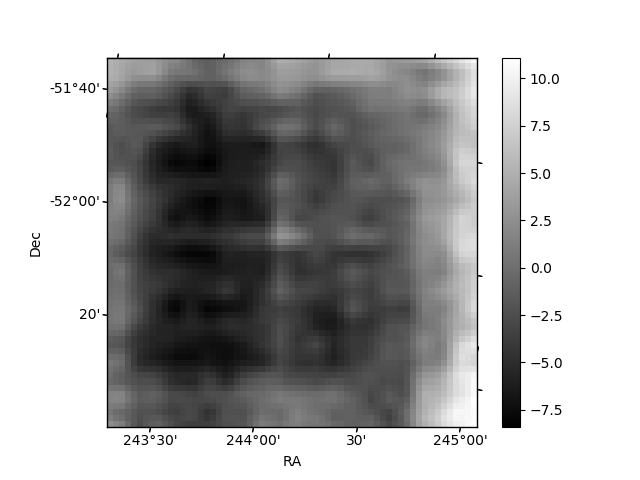
Histogram calculated using DETX and DETY for each event in the final _common_clean file
| Quadrant A | 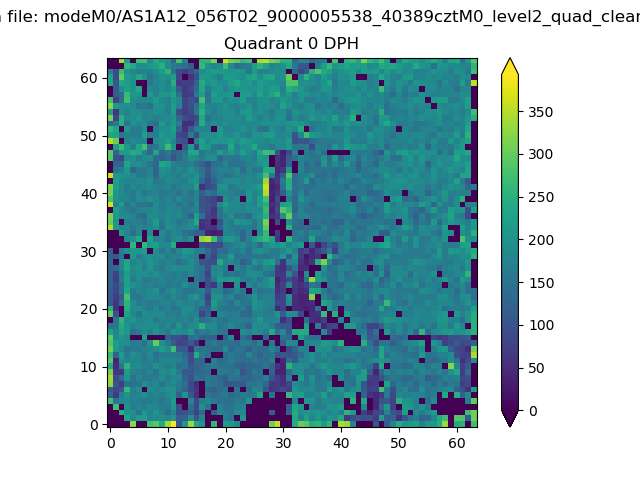 |
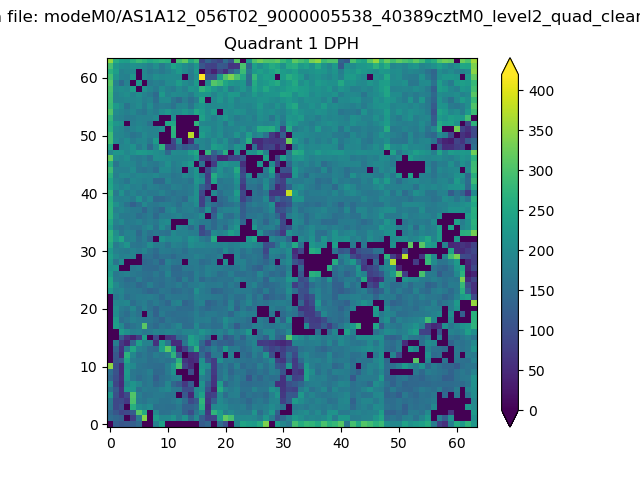 |
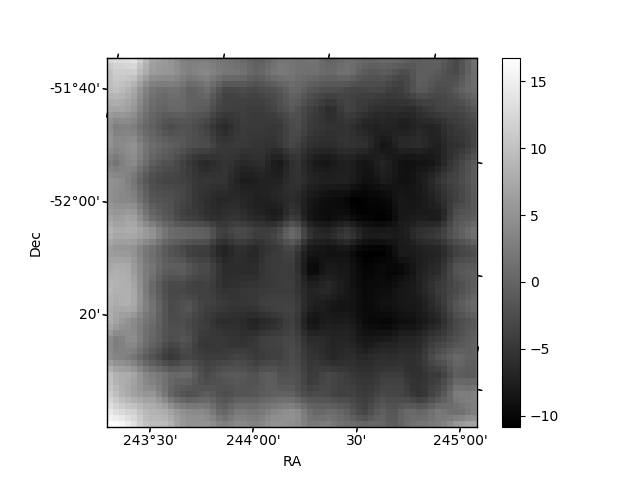
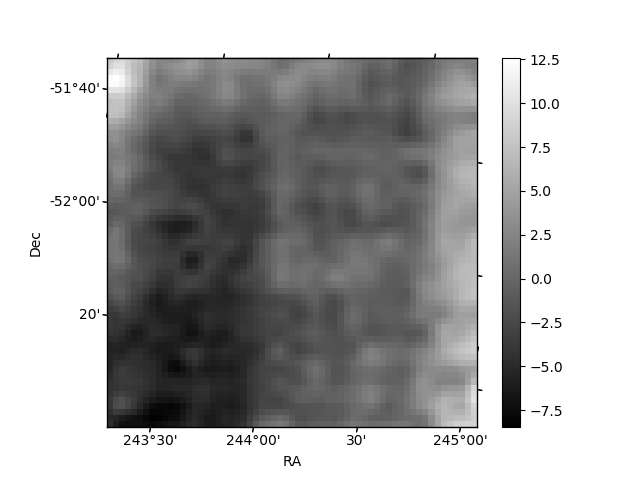
Quadrant B |
|---|---|---|---|
| Quadrant D | 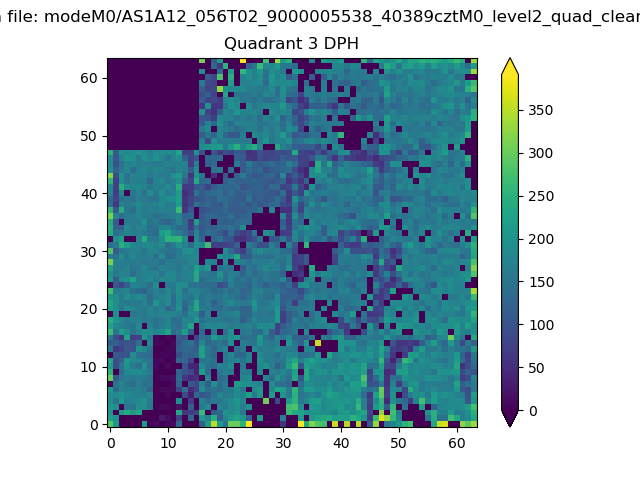 |
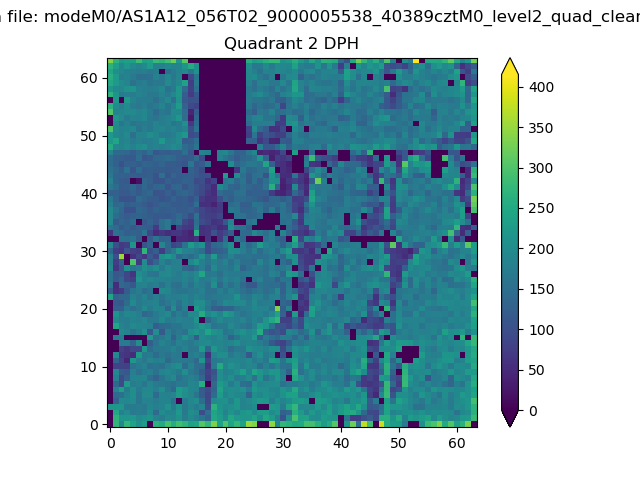 |
Quadrant C |
| Plot type | Count rate plots | Images |
|---|---|---|
| Comparison with Poisson distribution Blue bars denote a histogram of data divided into 1 sec bins. Red curve is a Poisson curve with rate = median count rate of data. |
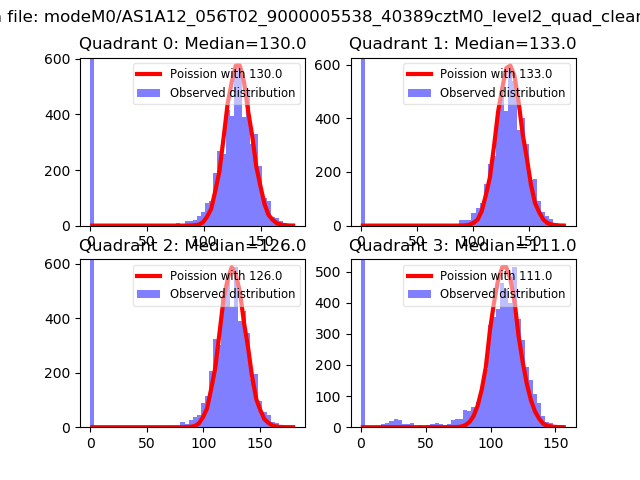 |
 |
| Quadrant-wise count rates Data is divided into 100 sec bins |
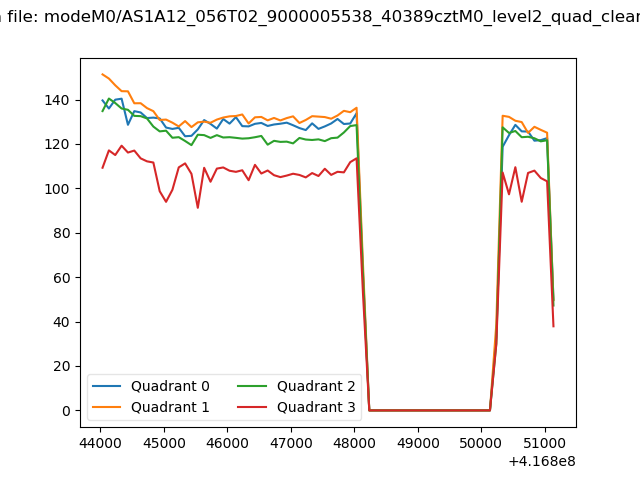 |
|
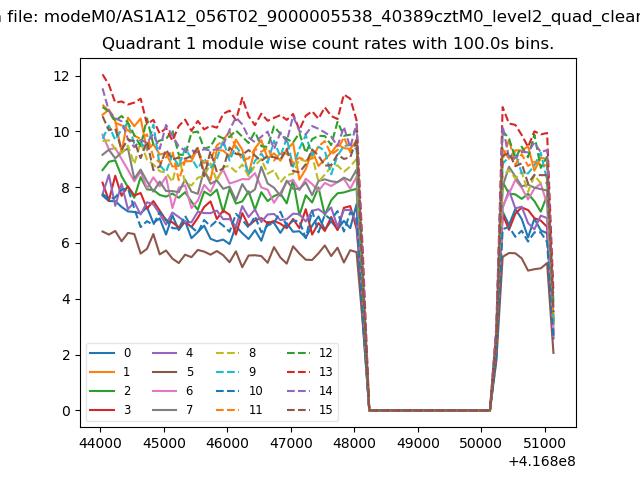
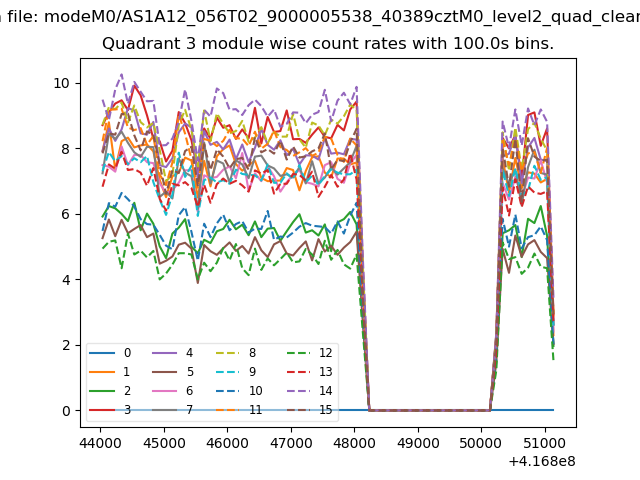
| Module-wise count rates for Quadrant A Data is divided into 100 sec bins |
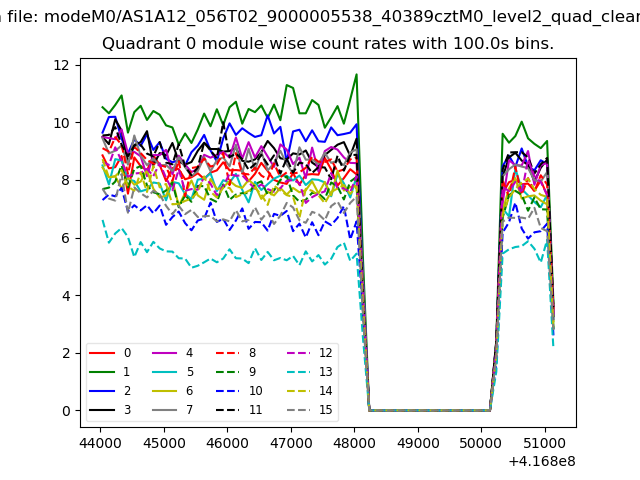 |
 |
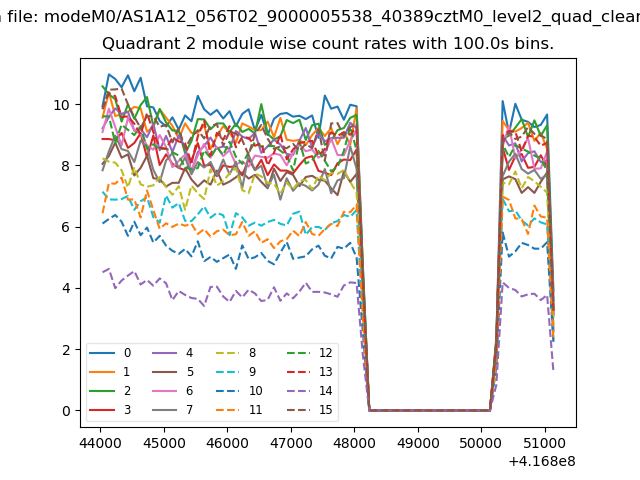
| Module-wise count rates for Quadrant B Data is divided into 100 sec bins |
 |
 |
| Module-wise count rates for Quadrant C Data is divided into 100 sec bins |
 |
 |
| Module-wise count rates for Quadrant D Data is divided into 100 sec bins |
 |
 |
| Parameter | Plot |
|---|---|
| CZT HV Monitor | 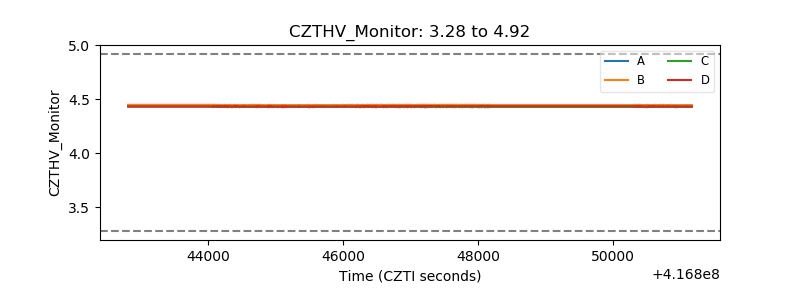 |
| D_VDD | 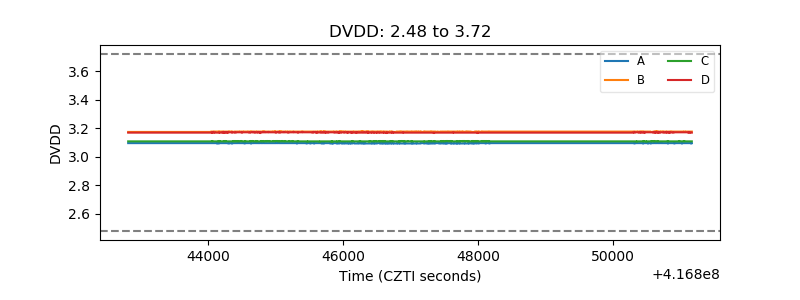 |
| Temperature 1 | 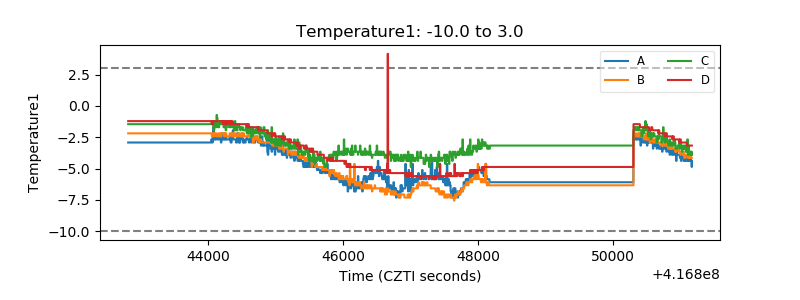 |
| Veto HV Monitor | 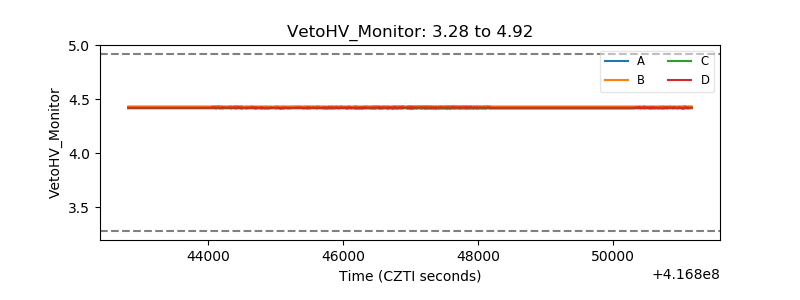 |
| Veto LLD | 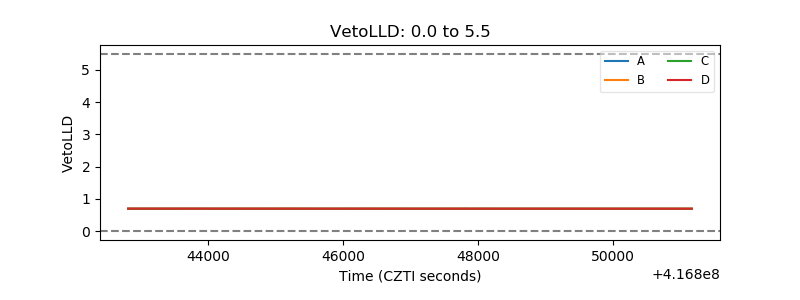 |
| Alpha Counter | 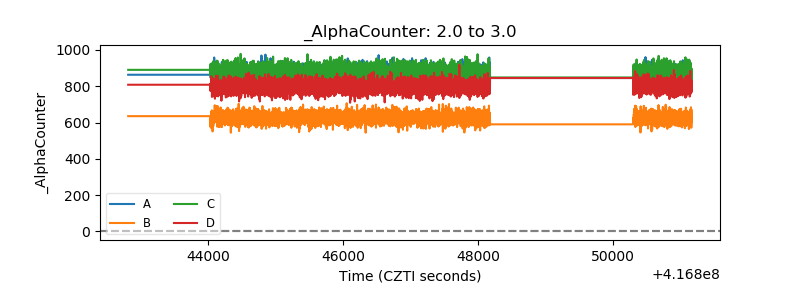 |
| _CPM_Rate | 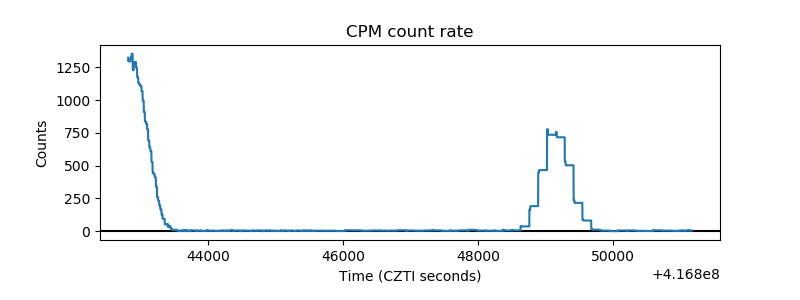 |
| CZT Counter | 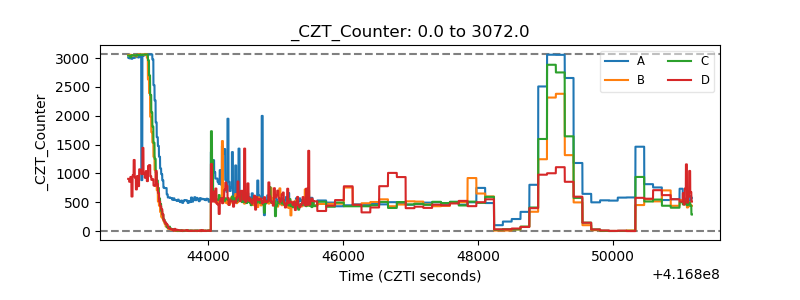 |
| +2.5 Volts monitor | 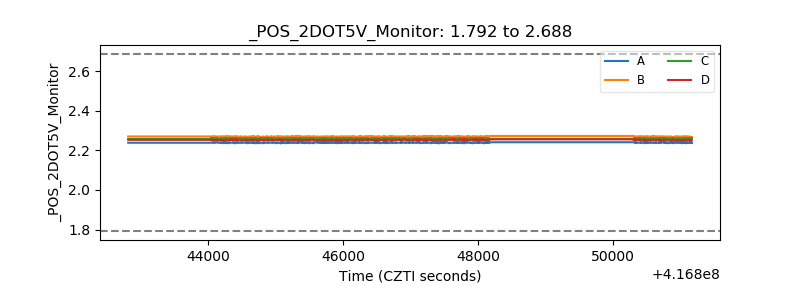 |
| +5 Volts monitor | 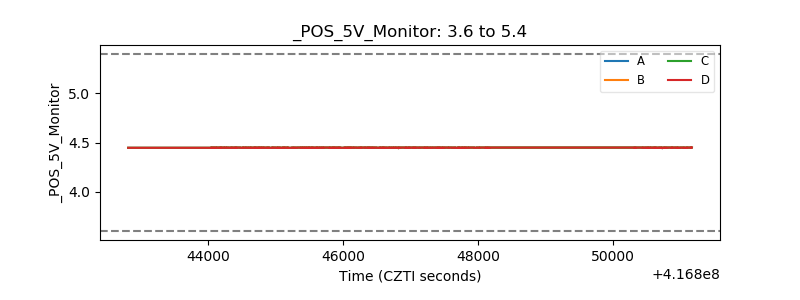 |
| _ROLL_ROT | 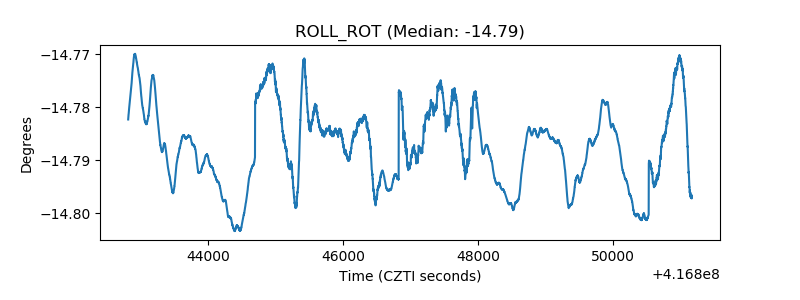 |
| _Roll_DEC | 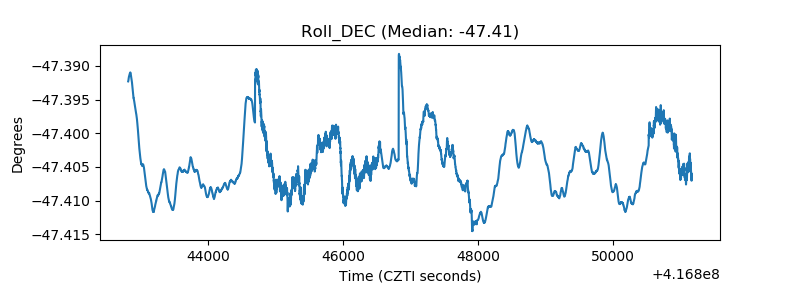 |
| _Roll_RA | 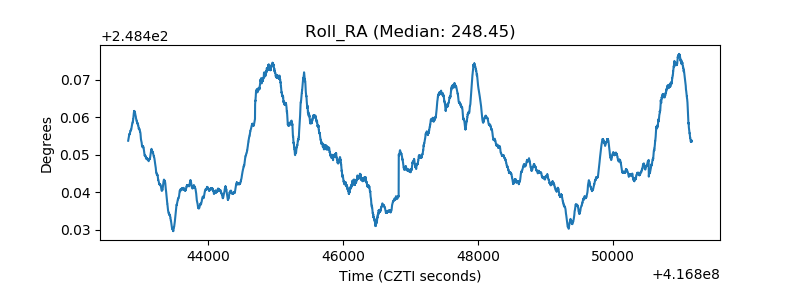 |
| Veto Counter | 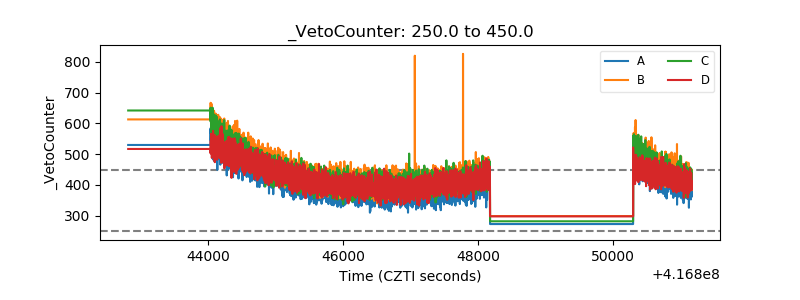 |