| Param | Original file | Final file |
|---|---|---|
| Filename | modeM0/AS1A12_056T02_9000005538_40390cztM0_level2.fits | modeM0/AS1A12_056T02_9000005538_40390cztM0_level2_quad_clean.evt |
| Size (bytes) | 293,371,200 | 86,181,120 |
| Size | 279.8 MB | 82.2 MB |
| Events in quadrant A | 2,843,014 | 598,403 |
| Events in quadrant B | 2,380,348 | 610,524 |
| Events in quadrant C | 2,402,074 | 578,173 |
| Events in quadrant D | 2,852,919 | 480,062 |
| Mode M0 | |||
|---|---|---|---|
| Quadrant | BADHDUFLAG | Total packets | Discarded packets |
| A | 0 | 11433 | 3 |
| B | 0 | 10255 | 2 |
| C | 0 | 10083 | 2 |
| D | 0 | 11777 | 2 |
| Mode M9 | |||
|---|---|---|---|
| Quadrant | BADHDUFLAG | Total packets | Discarded packets |
| A | 0 | 36 | 0 |
| B | 0 | 36 | 0 |
| C | 0 | 36 | 0 |
| D | 0 | 37 | 0 |
| Mode SS | |||
|---|---|---|---|
| Quadrant | BADHDUFLAG | Total packets | Discarded packets |
| A | 0 | 100 | 0 |
| B | 0 | 100 | 0 |
| C | 0 | 100 | 0 |
| D | 0 | 100 | 0 |
| Quadrant | Total seconds | Saturated seconds | Saturation percentage |
|---|---|---|---|
| A | 4881 | 50 | 1.024380% |
| B | 4881 | 22 | 0.450727% |
| C | 4881 | 13 | 0.266339% |
| D | 4881 | 556 | 11.391108% |
Noise dominated data is calculated using 1-second bins in cleaned event files. If a bin has >2000 counts, and if more than 50% of those come from <1% of pixels, then it is considered to be noise-dominated and hence unusable.
| Quadrant | # 1 sec bins | Bins with >0 counts | Bins with >2000 counts | High rate bins dominated by noise | Noise dominated (total time) | Noise dominated (detector-on time) | Marked lightcurve |
|---|---|---|---|---|---|---|---|
| A | 6973 | 4882 | 30 | 30 | 0.43% | 0.61% | 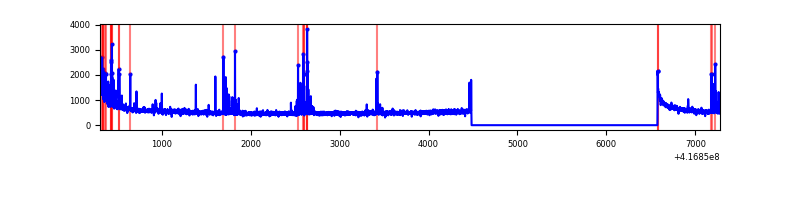 |
| B | 6973 | 4882 | 5 | 5 | 0.07% | 0.10% | 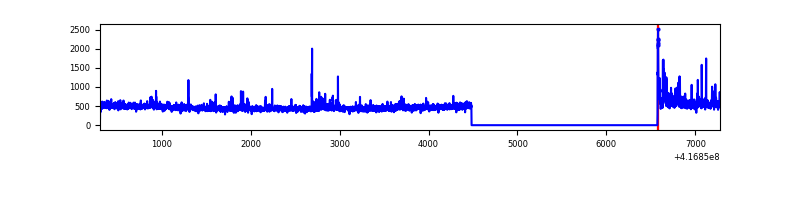 |
| C | 6973 | 4882 | 7 | 7 | 0.10% | 0.14% | 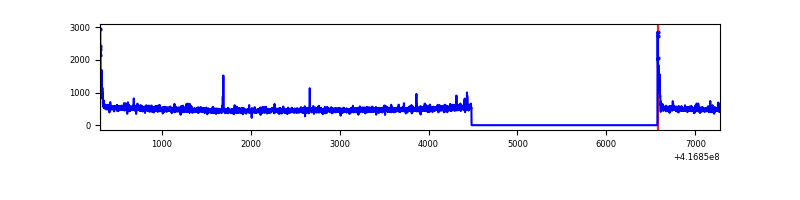 |
| D | 6973 | 4881 | 61 | 61 | 0.87% | 1.25% | 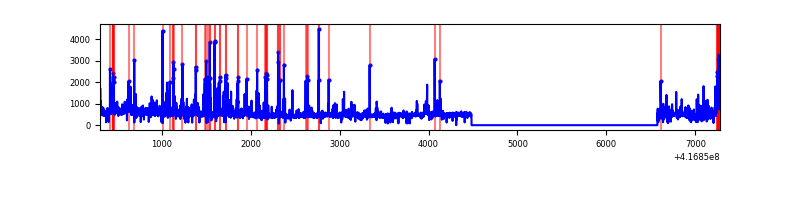 |
Top three noisy pixels from each quadrant. If the there are fewer than three noisy pixels in the level2.evt file, extra rows are filled as -1
| Pixel properties | Quadrant properties | ||||||
|---|---|---|---|---|---|---|---|
| Quadrant | DetID | PixID | Counts | Sigma | Mean | Median | Sigma |
| A | 10 | 83 | 458768 | 4042.48 | 555 | 545 | 113.4 |
| A | 13 | 248 | 198840 | 1749.38 | 555 | 545 | 113.4 |
| A | 2 | 79 | 29963 | 259.53 | 555 | 545 | 113.4 |
| B | 4 | 170 | 138911 | 1297.02 | 554 | 541 | 106.7 |
| B | 4 | 171 | 24868 | 228.03 | 554 | 541 | 106.7 |
| B | 0 | 230 | 20073 | 183.08 | 554 | 541 | 106.7 |
| C | 15 | 214 | 213520 | 1706.68 | 538 | 545 | 124.8 |
| C | 0 | 10 | 60421 | 479.82 | 538 | 545 | 124.8 |
| C | 12 | 249 | 19732 | 153.76 | 538 | 545 | 124.8 |
| D | 2 | 250 | 242756 | 1949.72 | 505 | 491 | 124.3 |
| D | 12 | 128 | 216731 | 1740.27 | 505 | 491 | 124.3 |
| D | 12 | 191 | 155499 | 1247.49 | 505 | 491 | 124.3 |
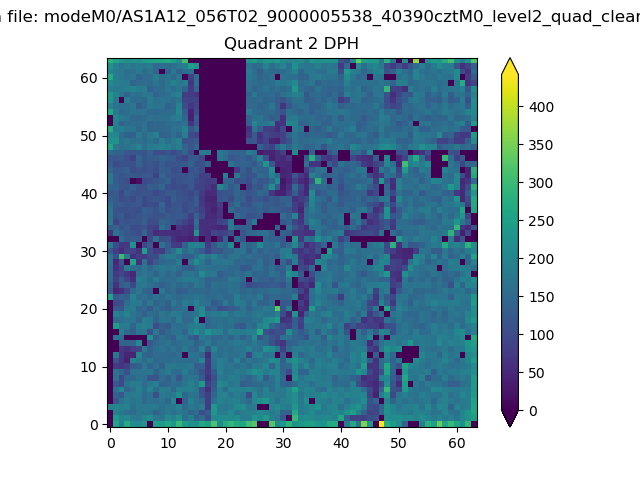
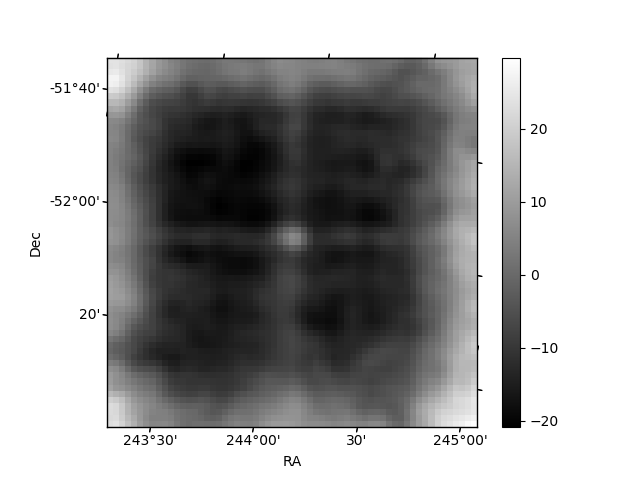
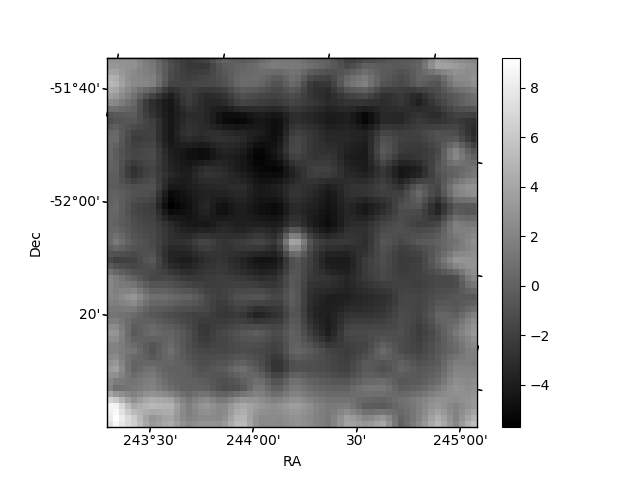
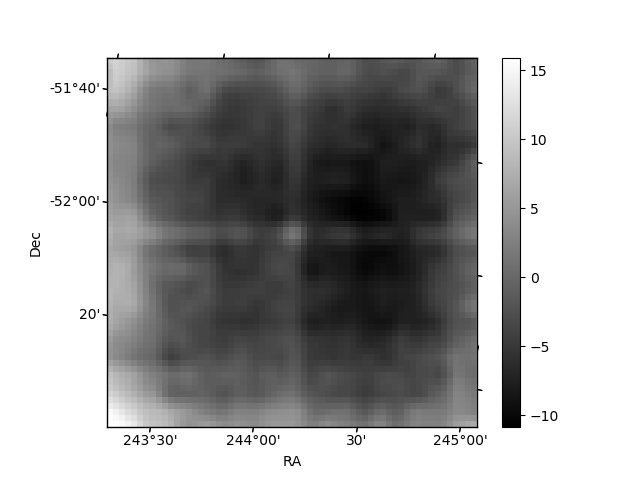
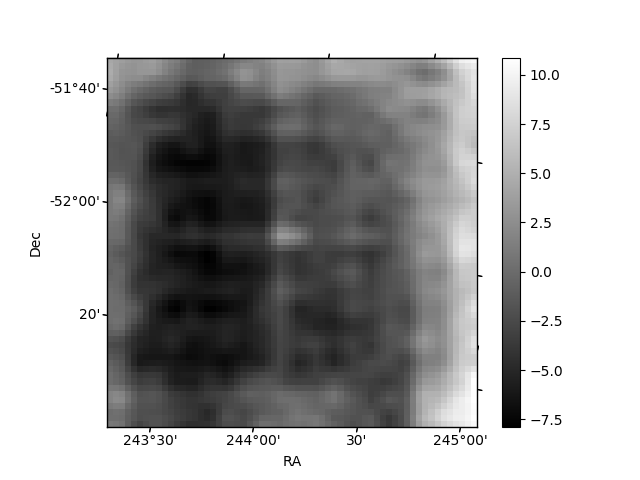
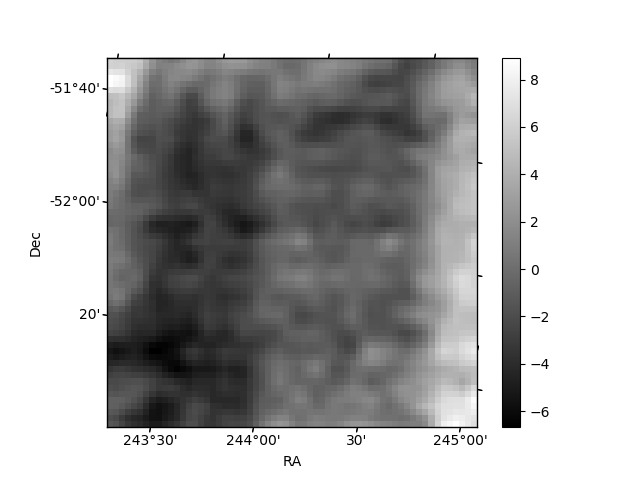
Histogram calculated using DETX and DETY for each event in the final _common_clean file
| Quadrant A | 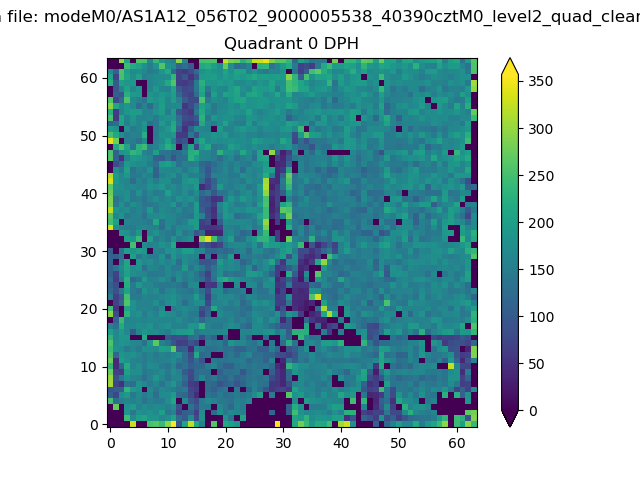 |
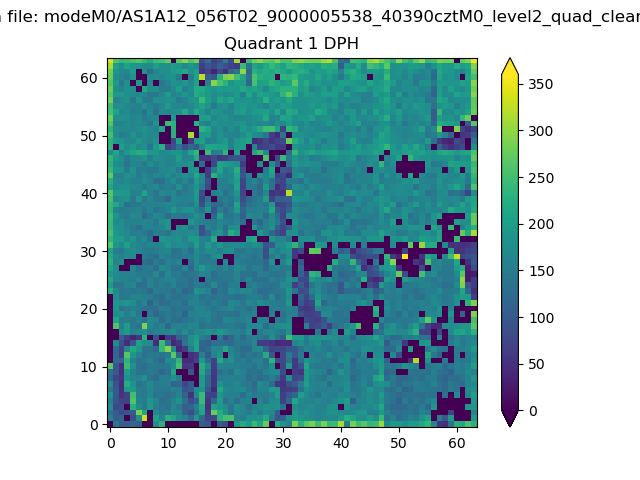 |
Quadrant B |
|---|---|---|---|
| Quadrant D | 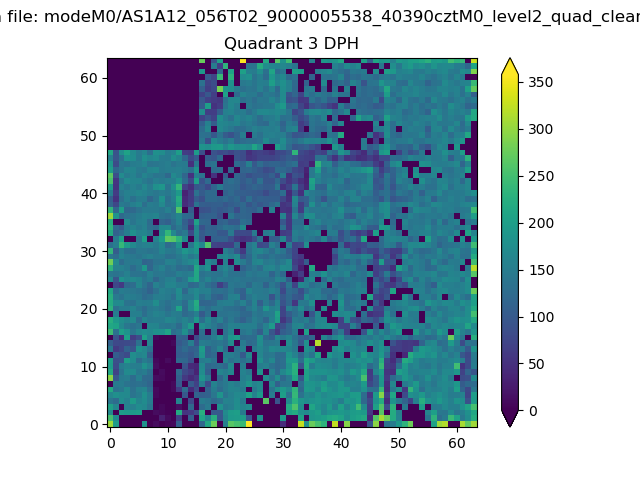 |
 |
Quadrant C |
| Plot type | Count rate plots | Images |
|---|---|---|
| Comparison with Poisson distribution Blue bars denote a histogram of data divided into 1 sec bins. Red curve is a Poisson curve with rate = median count rate of data. |
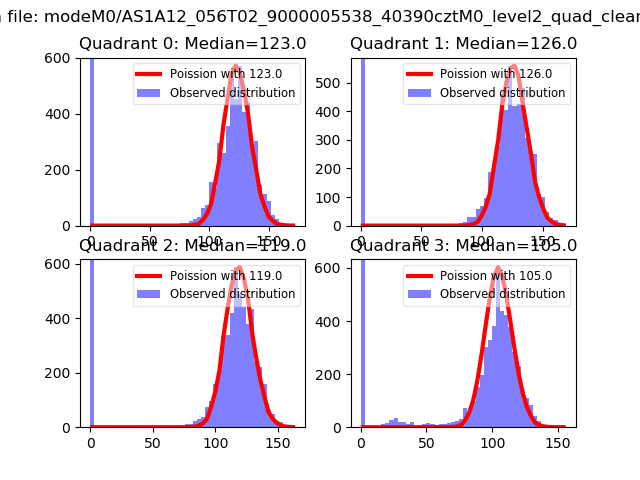 |
 |
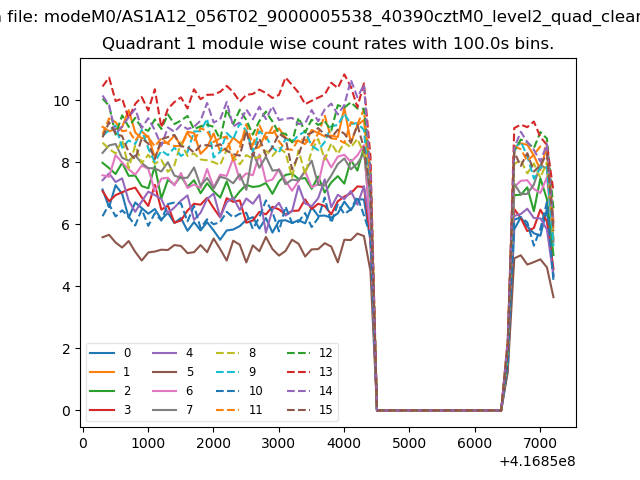
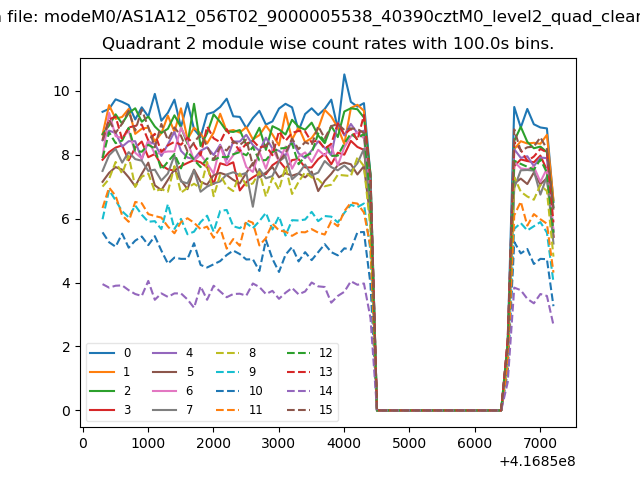
| Quadrant-wise count rates Data is divided into 100 sec bins |
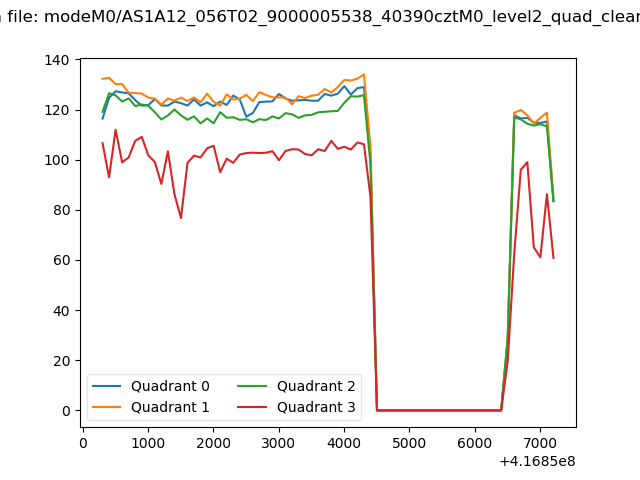 |
|
| Module-wise count rates for Quadrant A Data is divided into 100 sec bins |
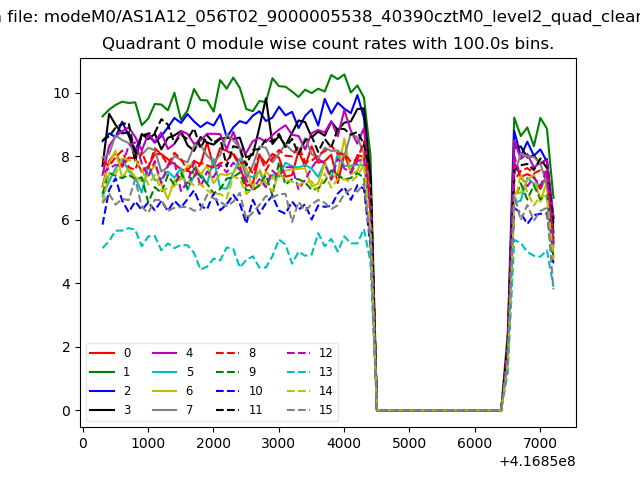 |
 |
| Module-wise count rates for Quadrant B Data is divided into 100 sec bins |
 |
 |
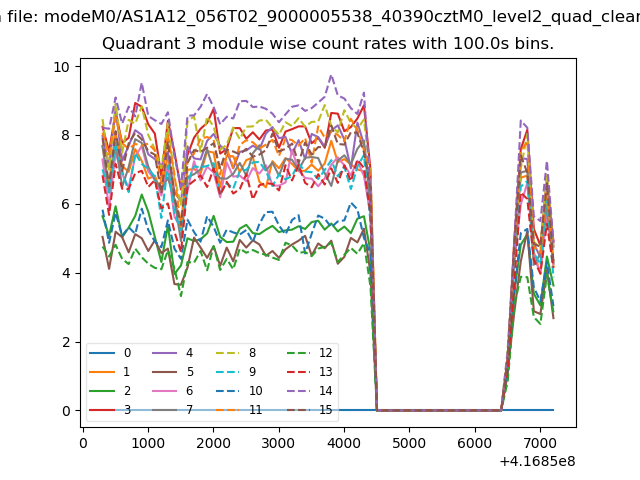
| Module-wise count rates for Quadrant C Data is divided into 100 sec bins |
 |
 |
| Module-wise count rates for Quadrant D Data is divided into 100 sec bins |
 |
 |
| Parameter | Plot |
|---|---|
| CZT HV Monitor | 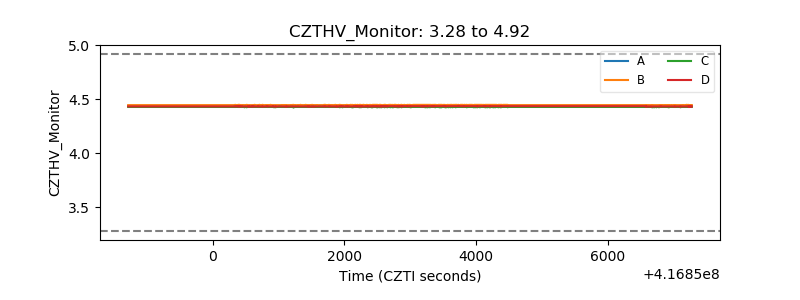 |
| D_VDD | 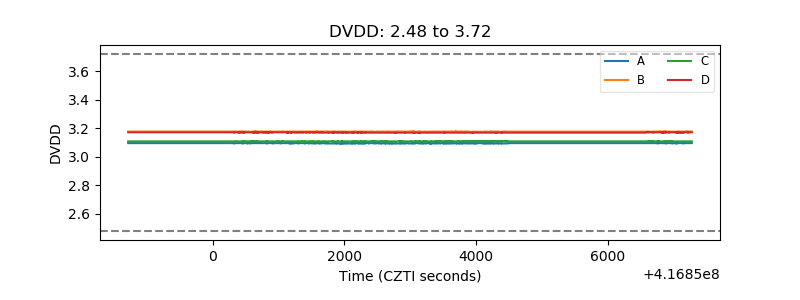 |
| Temperature 1 | 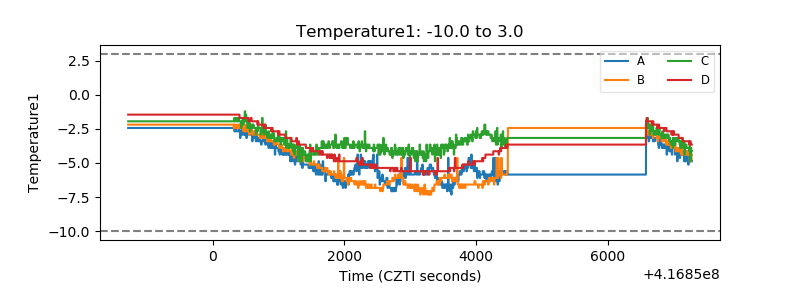 |
| Veto HV Monitor | 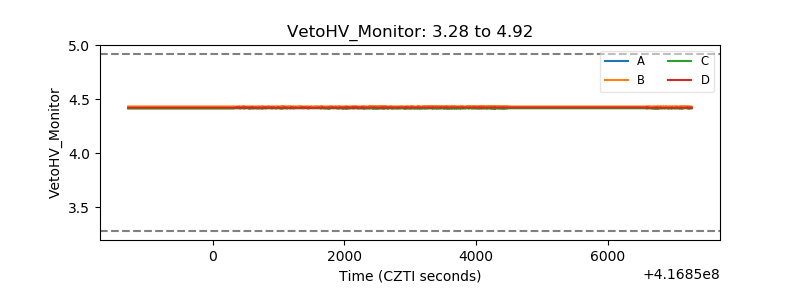 |
| Veto LLD | 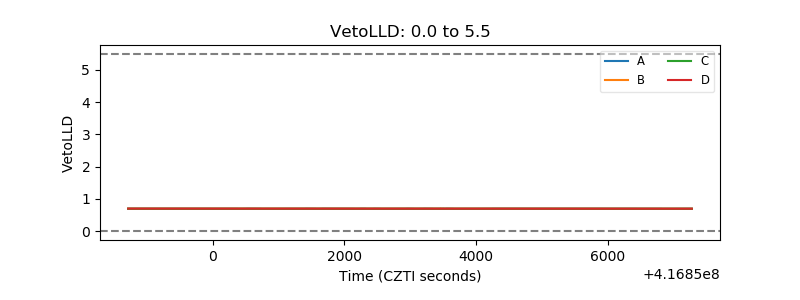 |
| Alpha Counter | 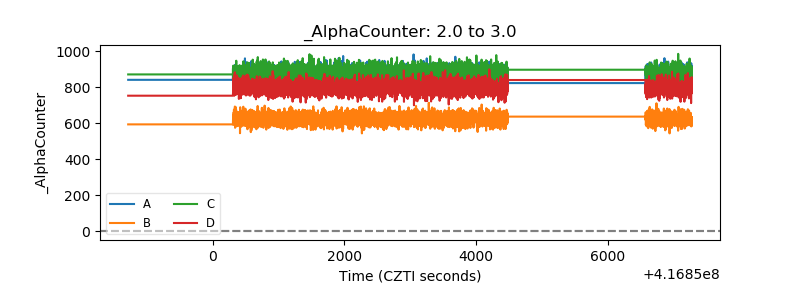 |
| _CPM_Rate | 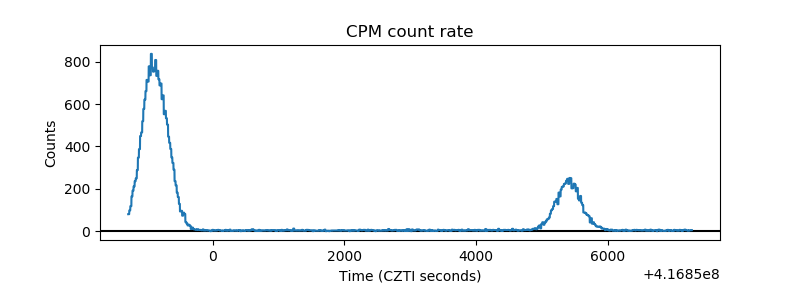 |
| CZT Counter | 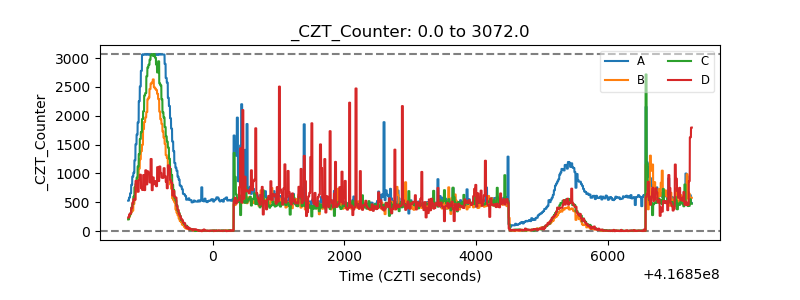 |
| +2.5 Volts monitor | 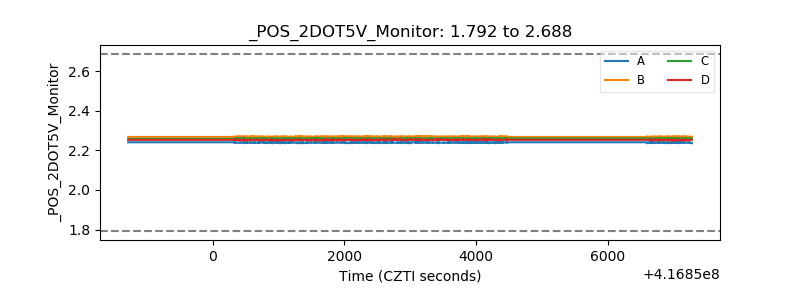 |
| +5 Volts monitor | 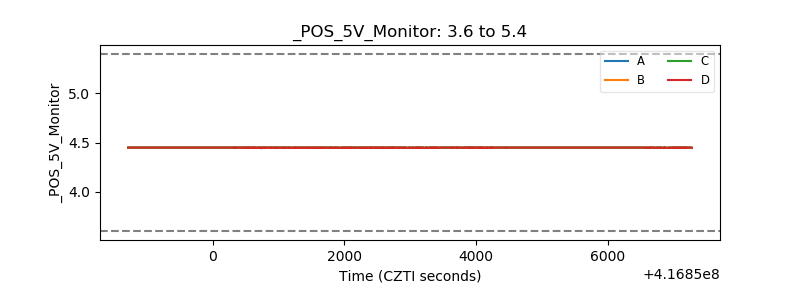 |
| _ROLL_ROT | 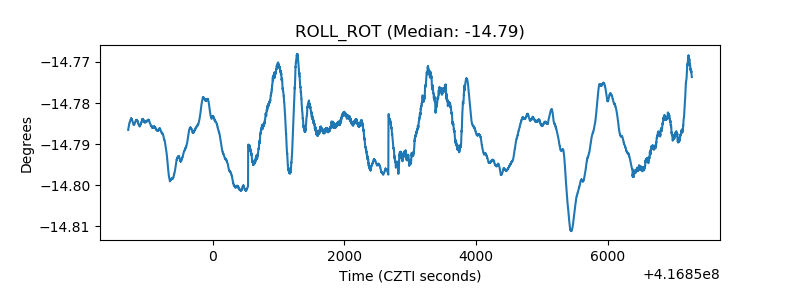 |
| _Roll_DEC | 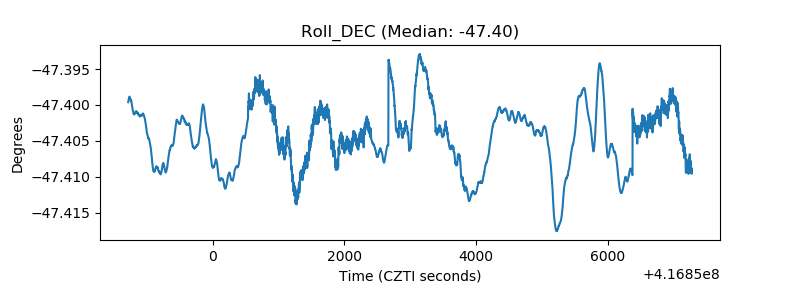 |
| _Roll_RA | 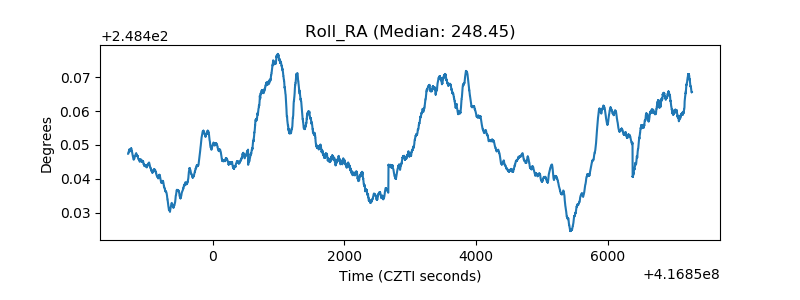 |
| Veto Counter | 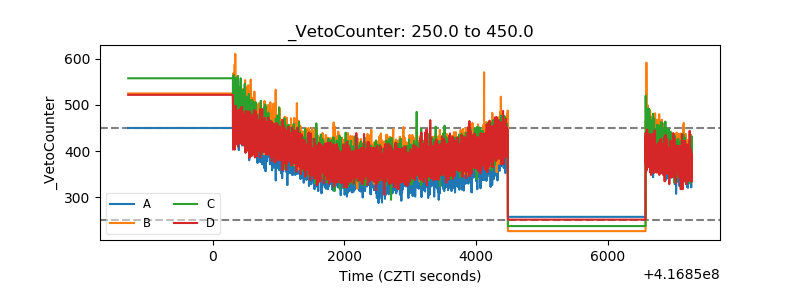 |