| Param | Original file | Final file |
|---|---|---|
| Filename | modeM0/AS1A12_056T02_9000005538_40391cztM0_level2.fits | modeM0/AS1A12_056T02_9000005538_40391cztM0_level2_quad_clean.evt |
| Size (bytes) | 304,303,680 | 87,868,800 |
| Size | 290.2 MB | 83.8 MB |
| Events in quadrant A | 3,075,853 | 606,427 |
| Events in quadrant B | 2,547,377 | 619,042 |
| Events in quadrant C | 2,503,484 | 586,316 |
| Events in quadrant D | 2,736,323 | 488,999 |
| Mode M0 | |||
|---|---|---|---|
| Quadrant | BADHDUFLAG | Total packets | Discarded packets |
| A | 0 | 12404 | 3 |
| B | 0 | 11072 | 2 |
| C | 0 | 10595 | 2 |
| D | 0 | 11684 | 2 |
| Mode M9 | |||
|---|---|---|---|
| Quadrant | BADHDUFLAG | Total packets | Discarded packets |
| A | 0 | 38 | 0 |
| B | 0 | 38 | 0 |
| C | 0 | 38 | 0 |
| D | 0 | 39 | 0 |
| Mode SS | |||
|---|---|---|---|
| Quadrant | BADHDUFLAG | Total packets | Discarded packets |
| A | 0 | 104 | 0 |
| B | 0 | 104 | 0 |
| C | 0 | 104 | 0 |
| D | 0 | 104 | 0 |
| Quadrant | Total seconds | Saturated seconds | Saturation percentage |
|---|---|---|---|
| A | 5138 | 48 | 0.934216% |
| B | 5138 | 25 | 0.486571% |
| C | 5138 | 15 | 0.291942% |
| D | 5138 | 554 | 10.782406% |
Noise dominated data is calculated using 1-second bins in cleaned event files. If a bin has >2000 counts, and if more than 50% of those come from <1% of pixels, then it is considered to be noise-dominated and hence unusable.
| Quadrant | # 1 sec bins | Bins with >0 counts | Bins with >2000 counts | High rate bins dominated by noise | Noise dominated (total time) | Noise dominated (detector-on time) | Marked lightcurve |
|---|---|---|---|---|---|---|---|
| A | 6990 | 5139 | 42 | 42 | 0.60% | 0.82% | 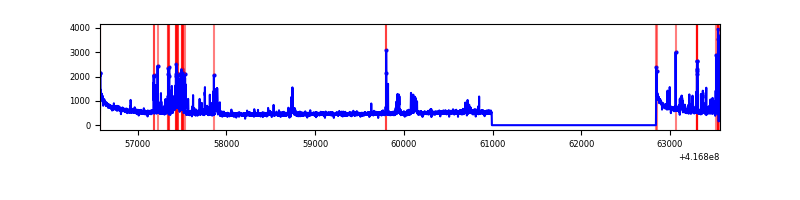 |
| B | 6990 | 5139 | 10 | 10 | 0.14% | 0.19% | 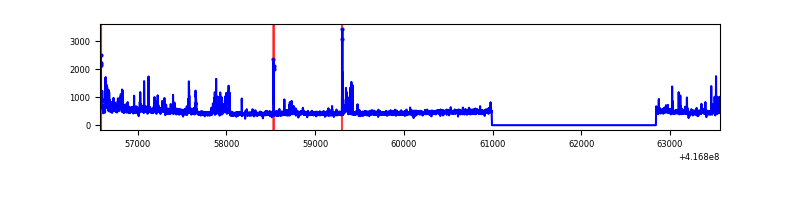 |
| C | 6990 | 5139 | 8 | 8 | 0.11% | 0.16% | 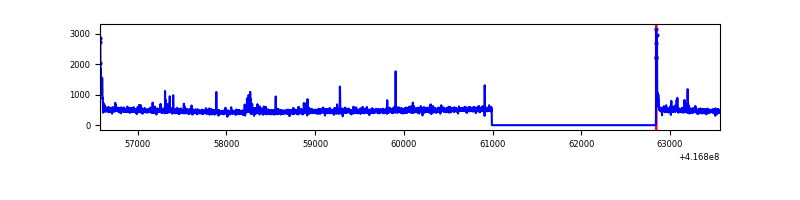 |
| D | 6990 | 5139 | 68 | 68 | 0.97% | 1.32% | 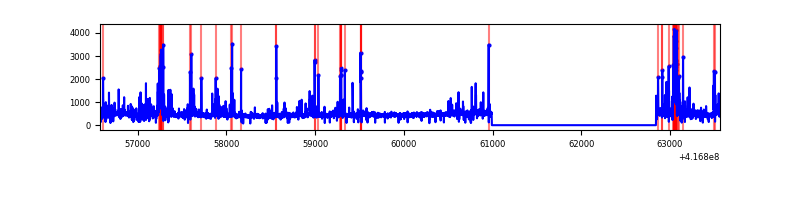 |
Top three noisy pixels from each quadrant. If the there are fewer than three noisy pixels in the level2.evt file, extra rows are filled as -1
| Pixel properties | Quadrant properties | ||||||
|---|---|---|---|---|---|---|---|
| Quadrant | DetID | PixID | Counts | Sigma | Mean | Median | Sigma |
| A | 10 | 83 | 466773 | 4017.51 | 566 | 556 | 116.0 |
| A | 2 | 79 | 226525 | 1947.23 | 566 | 556 | 116.0 |
| A | 13 | 248 | 118004 | 1012.08 | 566 | 556 | 116.0 |
| B | 4 | 170 | 280576 | 2593.05 | 566 | 554 | 108.0 |
| B | 0 | 245 | 15950 | 142.57 | 566 | 554 | 108.0 |
| B | 0 | 230 | 14944 | 133.25 | 566 | 554 | 108.0 |
| C | 15 | 214 | 225190 | 1726.63 | 554 | 559 | 130.1 |
| C | 0 | 10 | 49755 | 378.15 | 554 | 559 | 130.1 |
| C | 12 | 249 | 46882 | 356.06 | 554 | 559 | 130.1 |
| D | 12 | 128 | 245078 | 1915.6 | 518 | 504 | 127.7 |
| D | 12 | 191 | 162661 | 1270.08 | 518 | 504 | 127.7 |
| D | 13 | 171 | 136221 | 1062.99 | 518 | 504 | 127.7 |
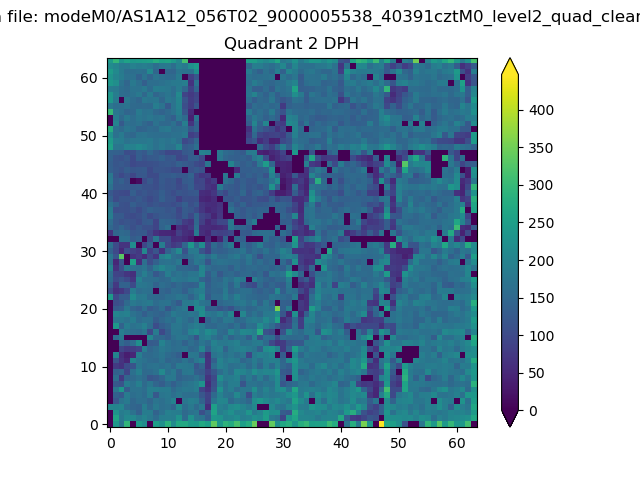
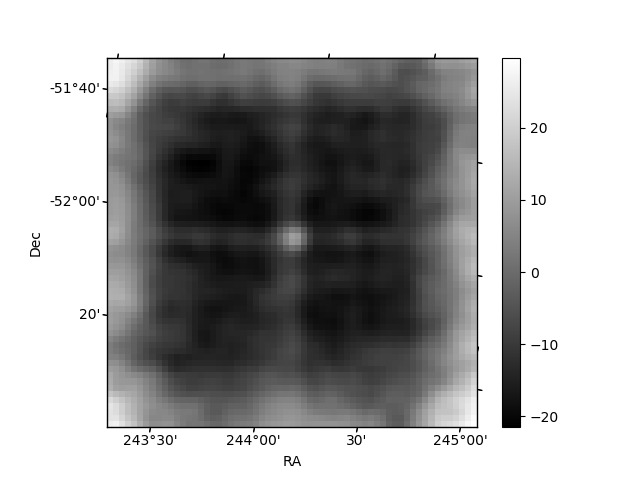
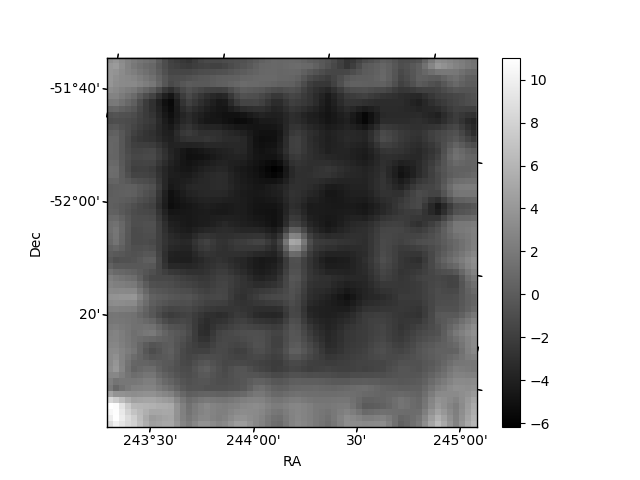
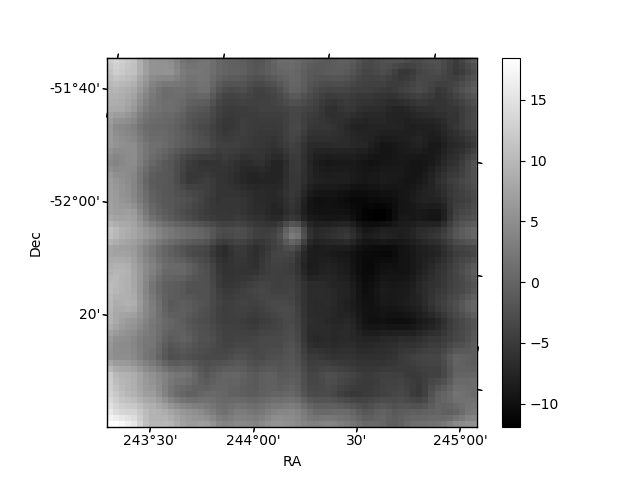
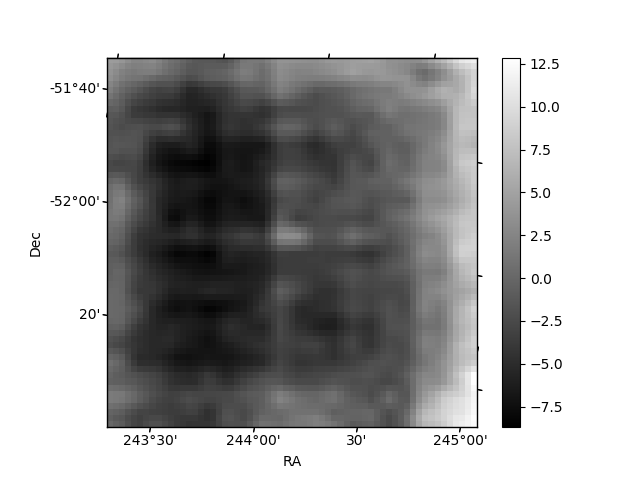
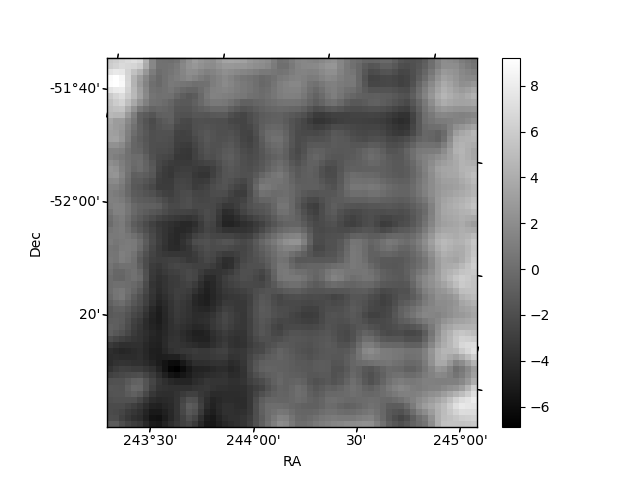
Histogram calculated using DETX and DETY for each event in the final _common_clean file
| Quadrant A | 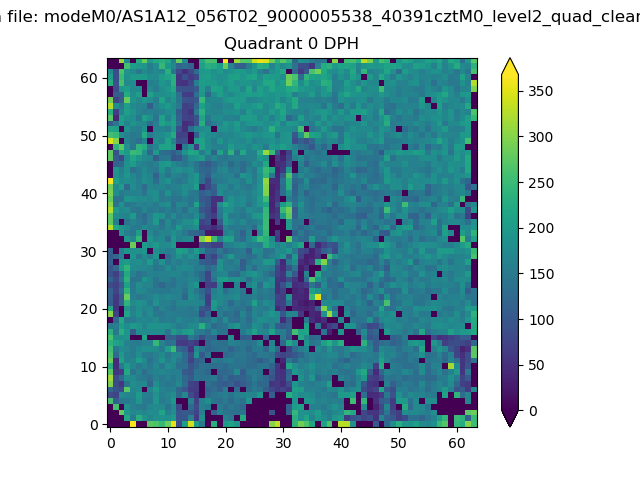 |
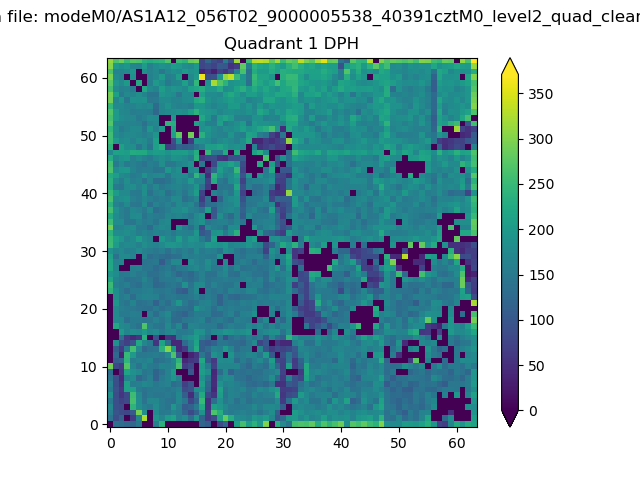 |
Quadrant B |
|---|---|---|---|
| Quadrant D | 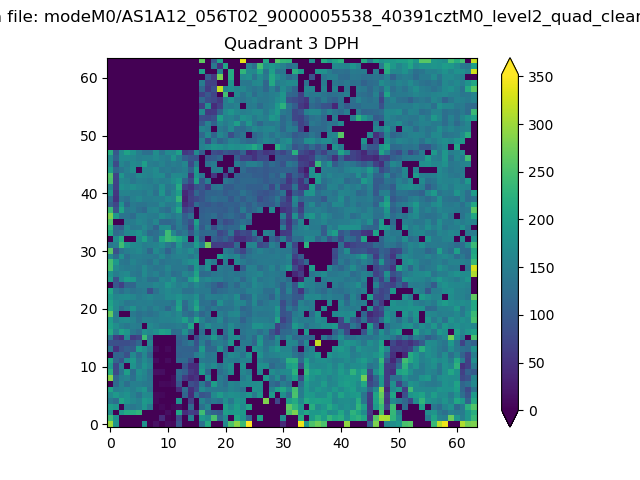 |
 |
Quadrant C |
| Plot type | Count rate plots | Images |
|---|---|---|
| Comparison with Poisson distribution Blue bars denote a histogram of data divided into 1 sec bins. Red curve is a Poisson curve with rate = median count rate of data. |
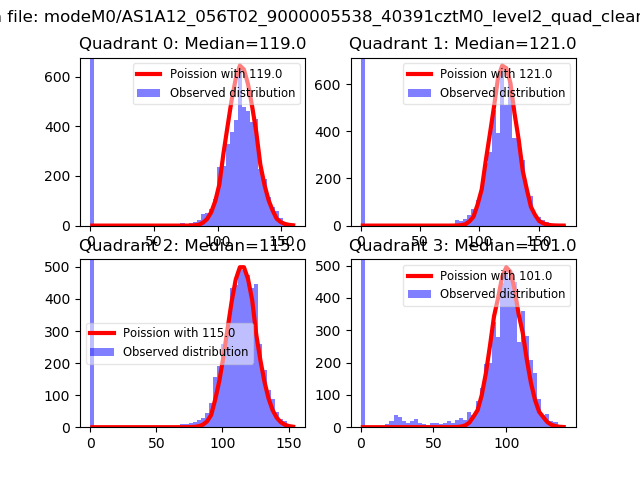 |
 |
| Quadrant-wise count rates Data is divided into 100 sec bins |
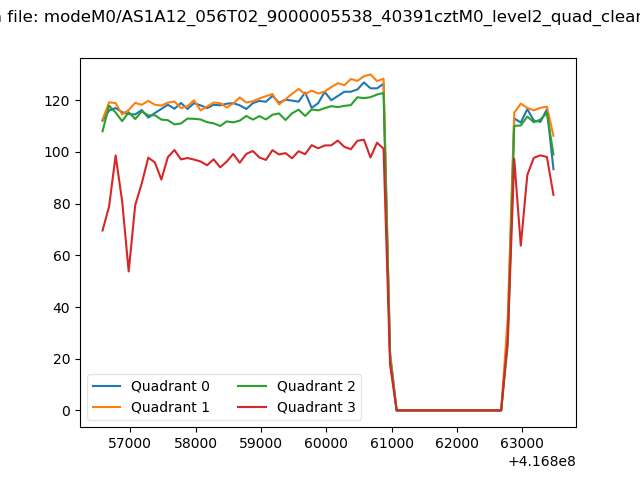 |
|
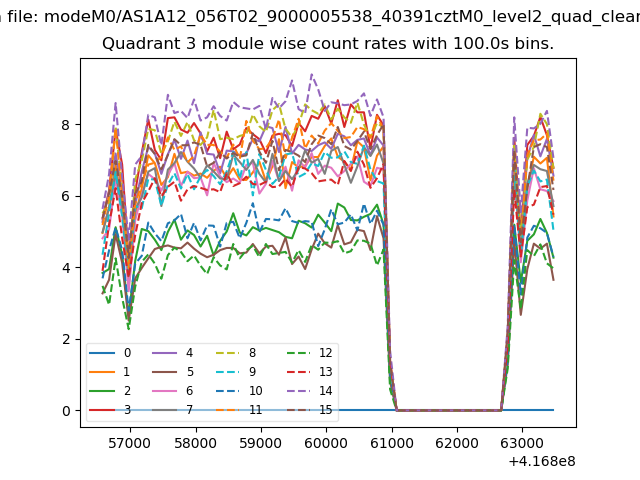
| Module-wise count rates for Quadrant A Data is divided into 100 sec bins |
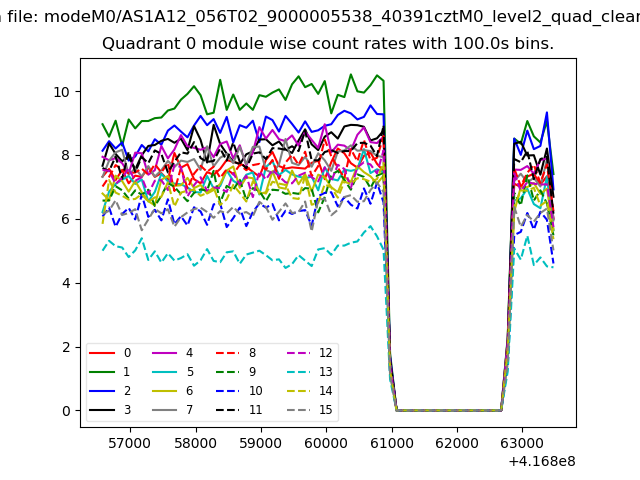 |
 |
| Module-wise count rates for Quadrant B Data is divided into 100 sec bins |
 |
 |
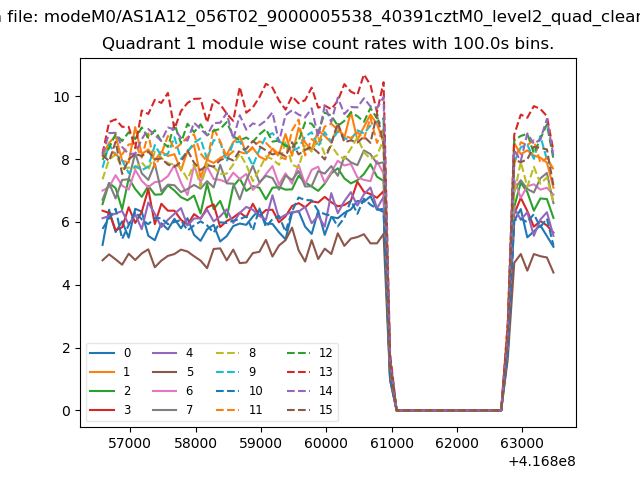
| Module-wise count rates for Quadrant C Data is divided into 100 sec bins |
 |
 |
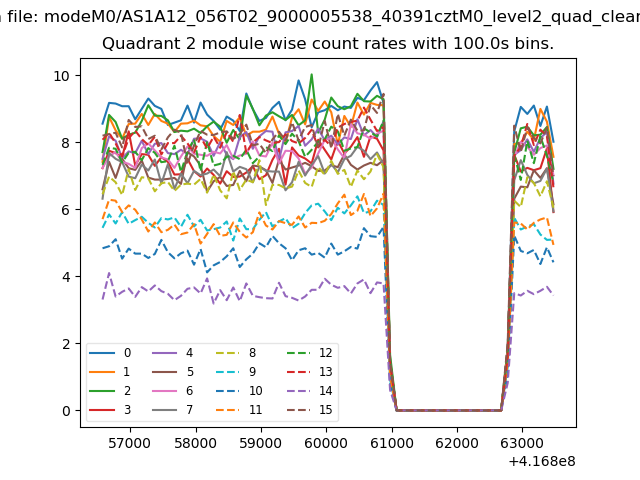
| Module-wise count rates for Quadrant D Data is divided into 100 sec bins |
 |
 |
| Parameter | Plot |
|---|---|
| CZT HV Monitor | 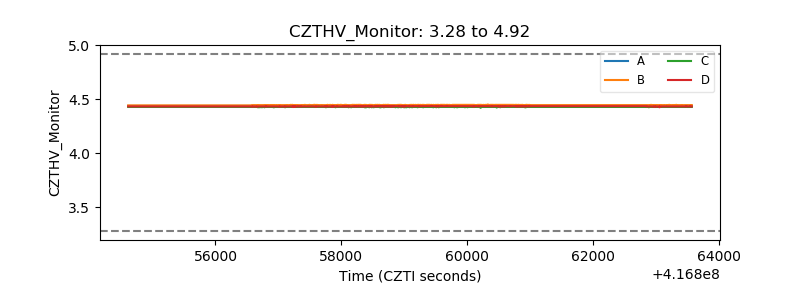 |
| D_VDD | 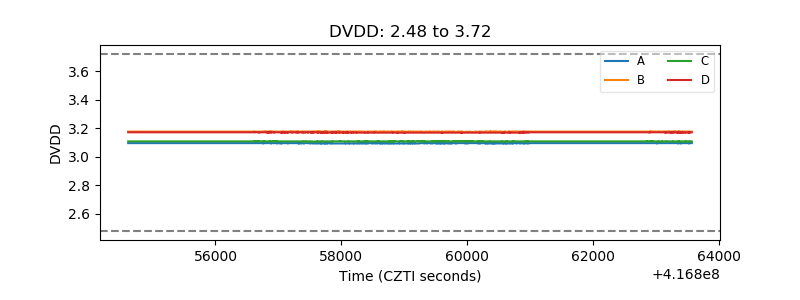 |
| Temperature 1 | 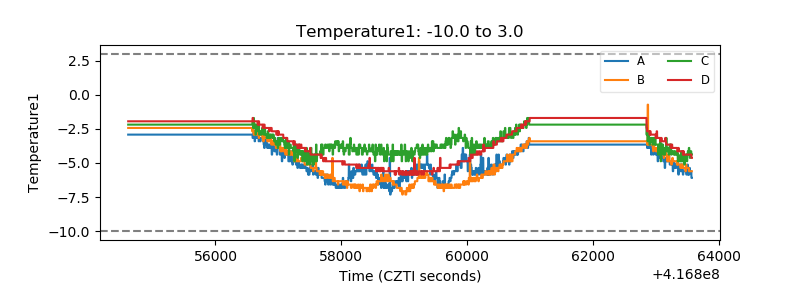 |
| Veto HV Monitor | 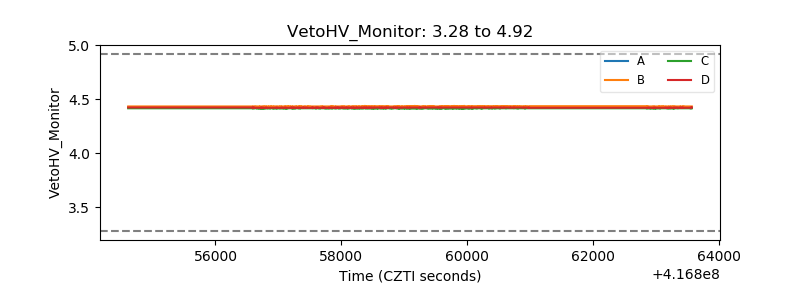 |
| Veto LLD |  |
| Alpha Counter | 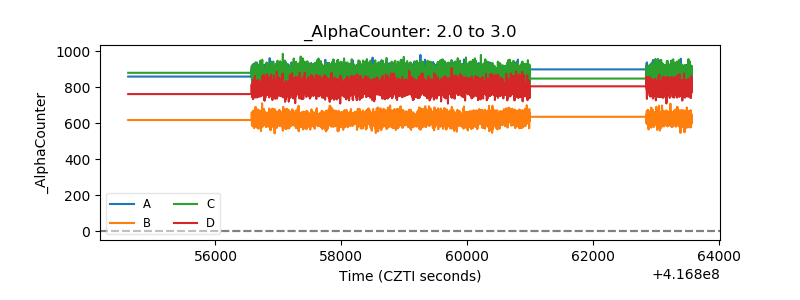 |
| _CPM_Rate | 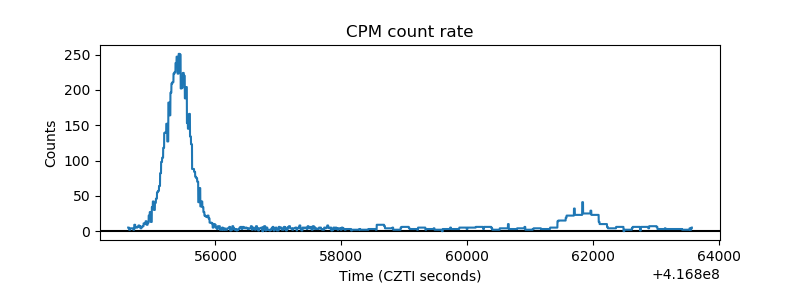 |
| CZT Counter | 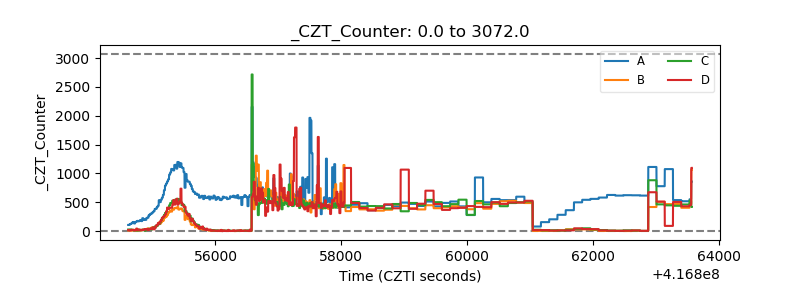 |
| +2.5 Volts monitor | 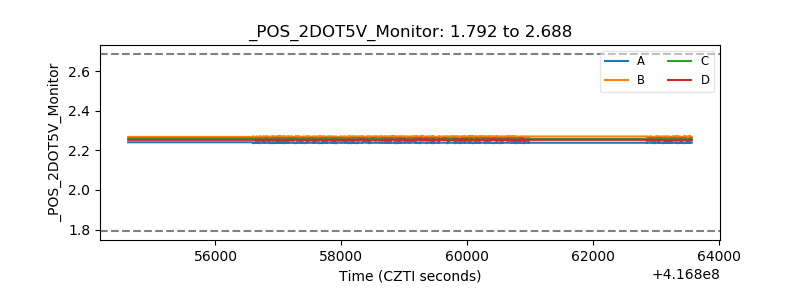 |
| +5 Volts monitor | 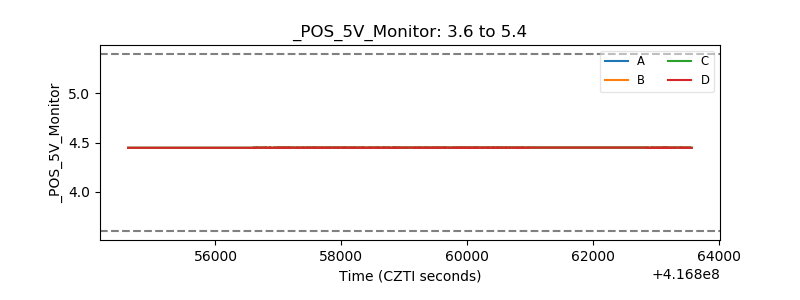 |
| _ROLL_ROT | 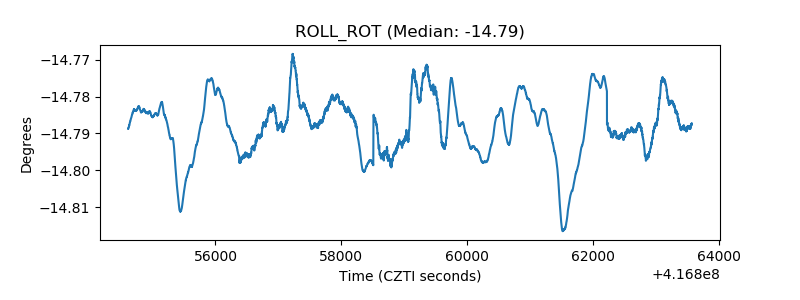 |
| _Roll_DEC | 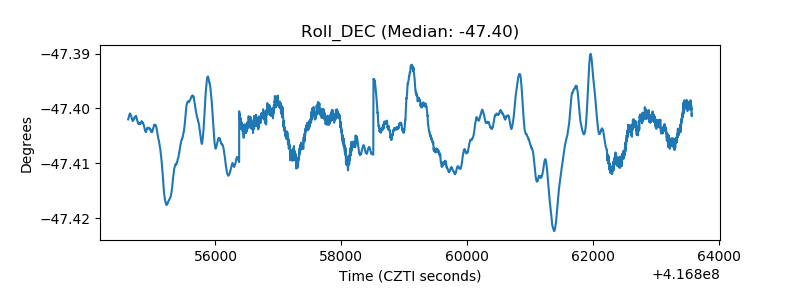 |
| _Roll_RA | 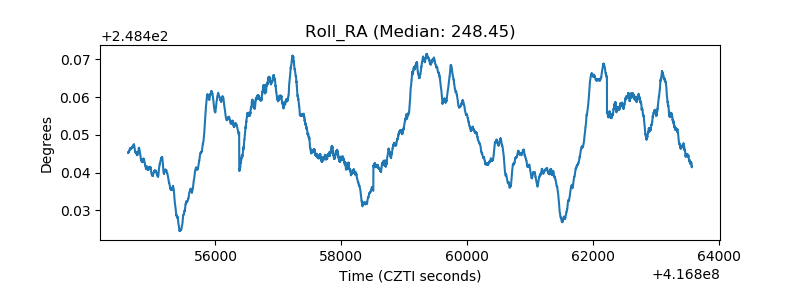 |
| Veto Counter | 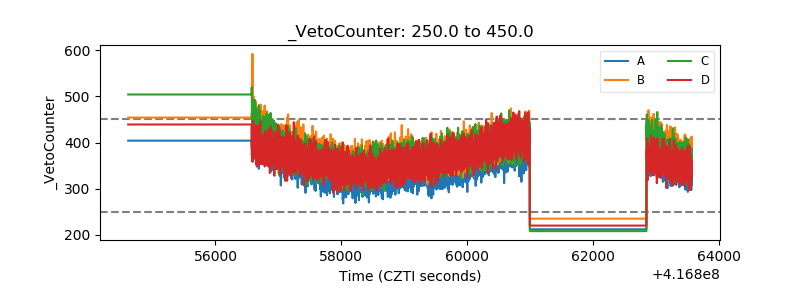 |