| Param | Original file | Final file |
|---|---|---|
| Filename | modeM0/AS1A12_056T02_9000005538_40392cztM0_level2.fits | modeM0/AS1A12_056T02_9000005538_40392cztM0_level2_quad_clean.evt |
| Size (bytes) | 333,984,960 | 93,744,000 |
| Size | 318.5 MB | 89.4 MB |
| Events in quadrant A | 3,030,937 | 643,984 |
| Events in quadrant B | 3,024,353 | 655,819 |
| Events in quadrant C | 2,685,231 | 623,148 |
| Events in quadrant D | 3,187,708 | 525,853 |
| Mode M0 | |||
|---|---|---|---|
| Quadrant | BADHDUFLAG | Total packets | Discarded packets |
| A | 0 | 12449 | 3 |
| B | 0 | 12892 | 2 |
| C | 0 | 11431 | 2 |
| D | 0 | 13396 | 2 |
| Mode M9 | |||
|---|---|---|---|
| Quadrant | BADHDUFLAG | Total packets | Discarded packets |
| A | 0 | 32 | 0 |
| B | 0 | 32 | 0 |
| C | 0 | 32 | 0 |
| D | 0 | 33 | 0 |
| Mode SS | |||
|---|---|---|---|
| Quadrant | BADHDUFLAG | Total packets | Discarded packets |
| A | 0 | 112 | 0 |
| B | 0 | 112 | 0 |
| C | 0 | 112 | 0 |
| D | 0 | 112 | 0 |
| Quadrant | Total seconds | Saturated seconds | Saturation percentage |
|---|---|---|---|
| A | 5574 | 43 | 0.771439% |
| B | 5574 | 56 | 1.004665% |
| C | 5574 | 13 | 0.233226% |
| D | 5574 | 561 | 10.064586% |
Noise dominated data is calculated using 1-second bins in cleaned event files. If a bin has >2000 counts, and if more than 50% of those come from <1% of pixels, then it is considered to be noise-dominated and hence unusable.
| Quadrant | # 1 sec bins | Bins with >0 counts | Bins with >2000 counts | High rate bins dominated by noise | Noise dominated (total time) | Noise dominated (detector-on time) | Marked lightcurve |
|---|---|---|---|---|---|---|---|
| A | 7097 | 5575 | 25 | 25 | 0.35% | 0.45% | 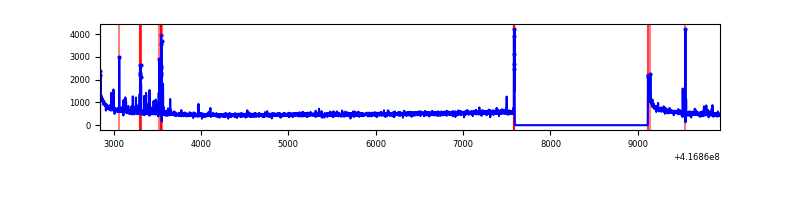 |
| B | 7097 | 5575 | 18 | 18 | 0.25% | 0.32% | 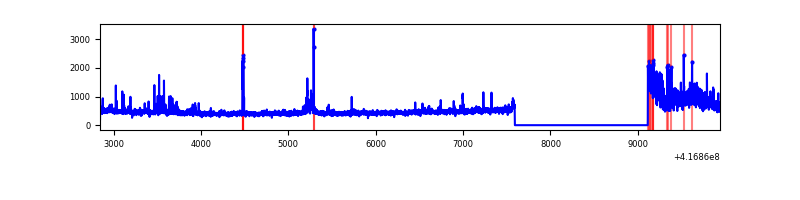 |
| C | 7097 | 5575 | 7 | 7 | 0.10% | 0.13% | 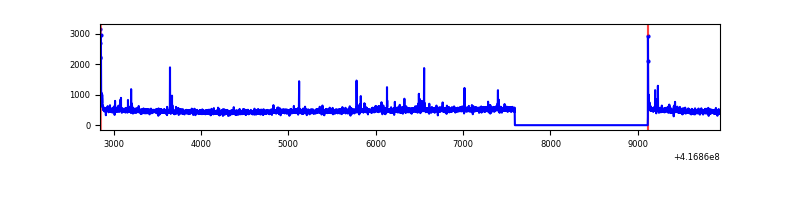 |
| D | 7097 | 5575 | 74 | 74 | 1.04% | 1.33% | 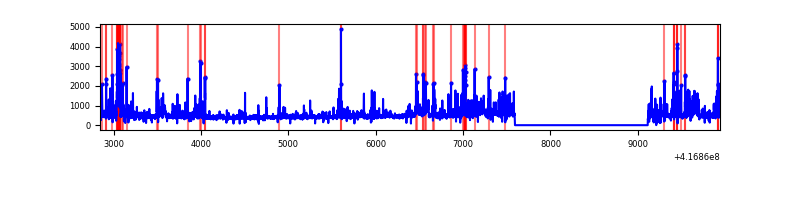 |
Top three noisy pixels from each quadrant. If the there are fewer than three noisy pixels in the level2.evt file, extra rows are filled as -1
| Pixel properties | Quadrant properties | ||||||
|---|---|---|---|---|---|---|---|
| Quadrant | DetID | PixID | Counts | Sigma | Mean | Median | Sigma |
| A | 10 | 83 | 492505 | 3956.46 | 611 | 600 | 124.3 |
| A | 13 | 248 | 125850 | 1007.4 | 611 | 600 | 124.3 |
| A | 2 | 79 | 36448 | 288.33 | 611 | 600 | 124.3 |
| B | 4 | 170 | 296153 | 2511.94 | 611 | 593 | 117.7 |
| B | 7 | 202 | 242202 | 2053.41 | 611 | 593 | 117.7 |
| B | 4 | 171 | 49091 | 412.18 | 611 | 593 | 117.7 |
| C | 15 | 214 | 242438 | 1725.56 | 600 | 604 | 140.1 |
| C | 12 | 249 | 43166 | 303.69 | 600 | 604 | 140.1 |
| C | 0 | 10 | 29971 | 209.54 | 600 | 604 | 140.1 |
| D | 12 | 128 | 292848 | 2092.61 | 564 | 548 | 139.7 |
| D | 12 | 227 | 234720 | 1676.47 | 564 | 548 | 139.7 |
| D | 12 | 191 | 168407 | 1201.73 | 564 | 548 | 139.7 |
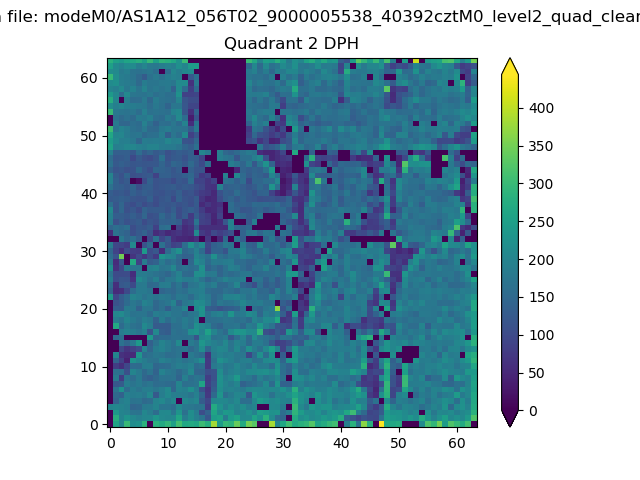
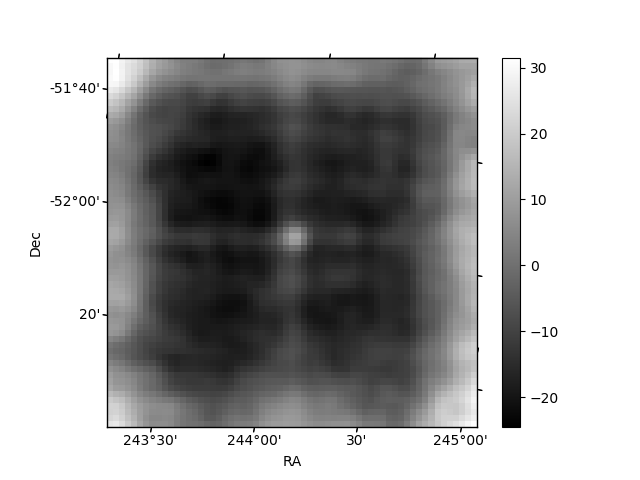
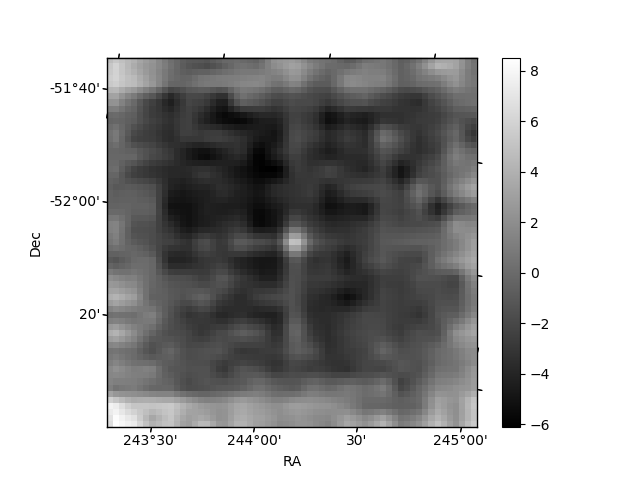
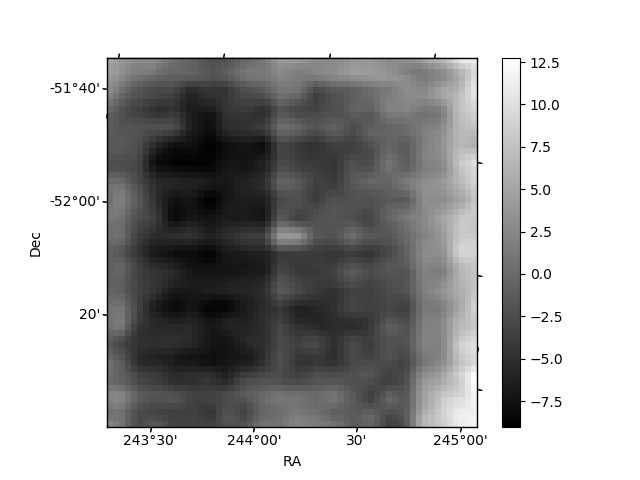
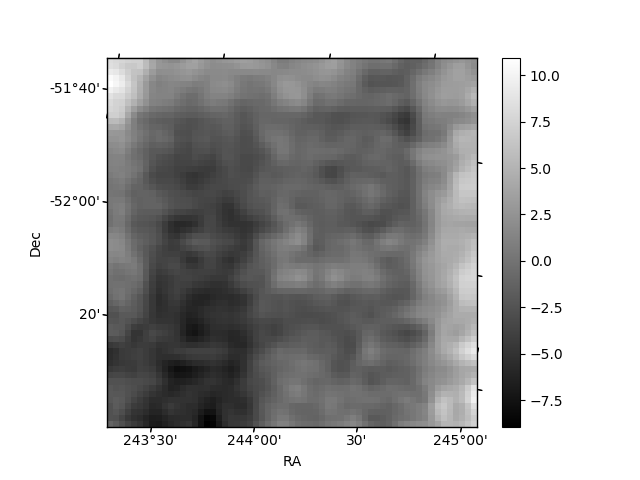
Histogram calculated using DETX and DETY for each event in the final _common_clean file
| Quadrant A | 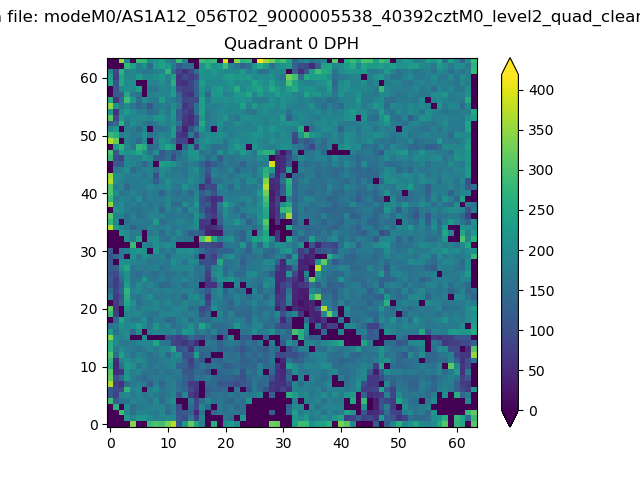 |
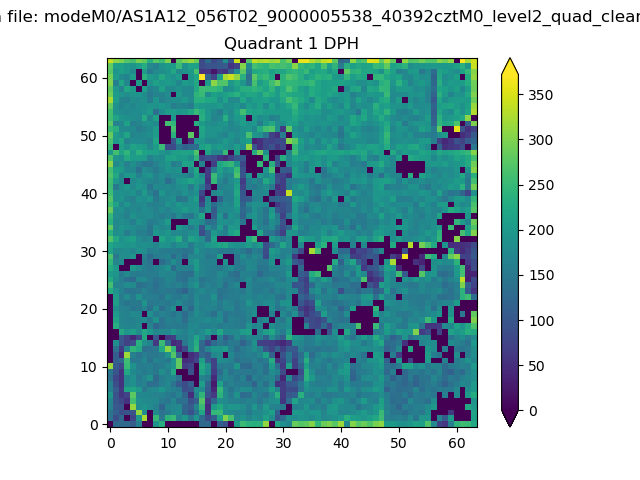 |
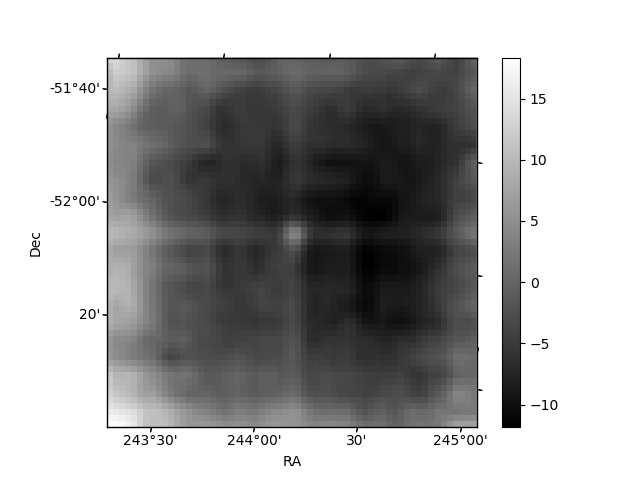
Quadrant B |
|---|---|---|---|
| Quadrant D | 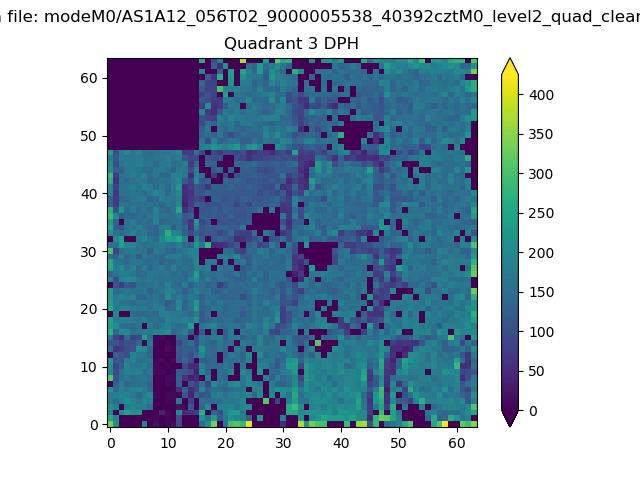 |
 |
Quadrant C |
| Plot type | Count rate plots | Images |
|---|---|---|
| Comparison with Poisson distribution Blue bars denote a histogram of data divided into 1 sec bins. Red curve is a Poisson curve with rate = median count rate of data. |
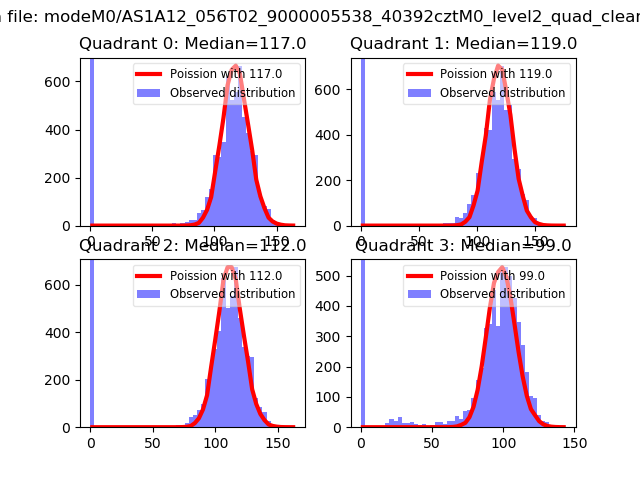 |
 |
| Quadrant-wise count rates Data is divided into 100 sec bins |
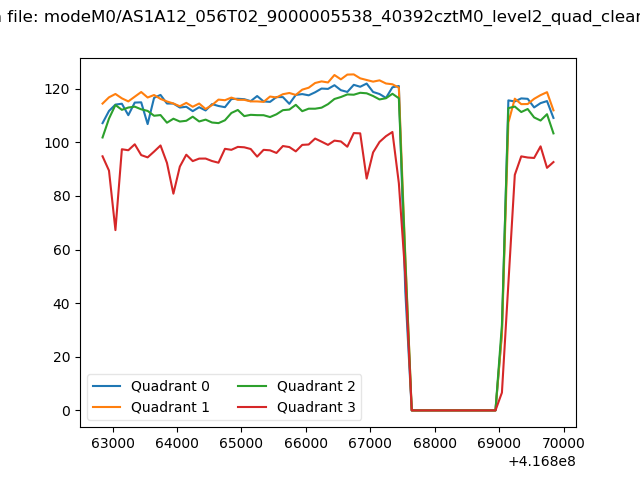 |
|
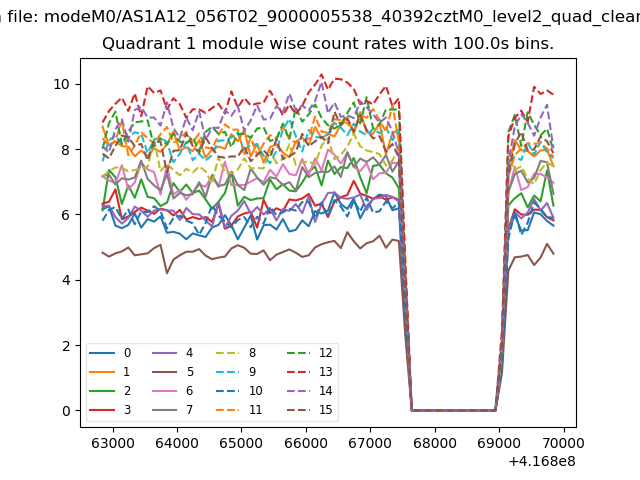
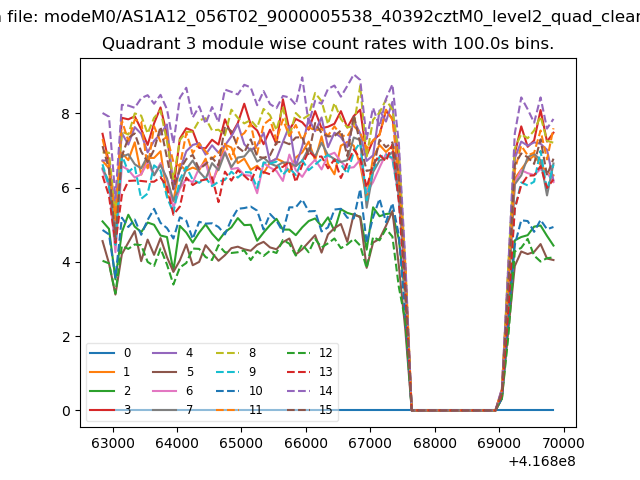
| Module-wise count rates for Quadrant A Data is divided into 100 sec bins |
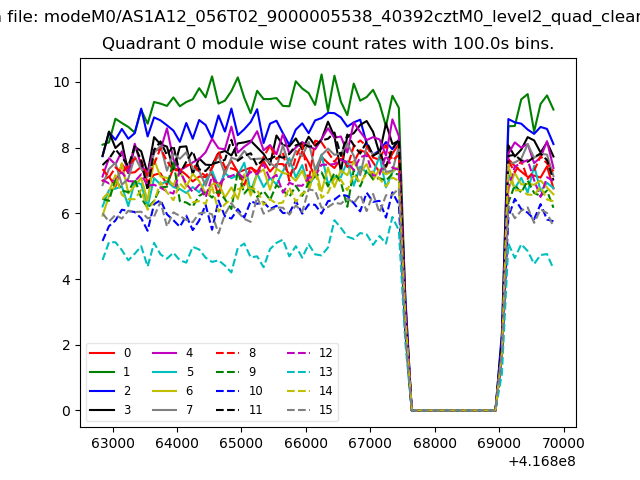 |
 |
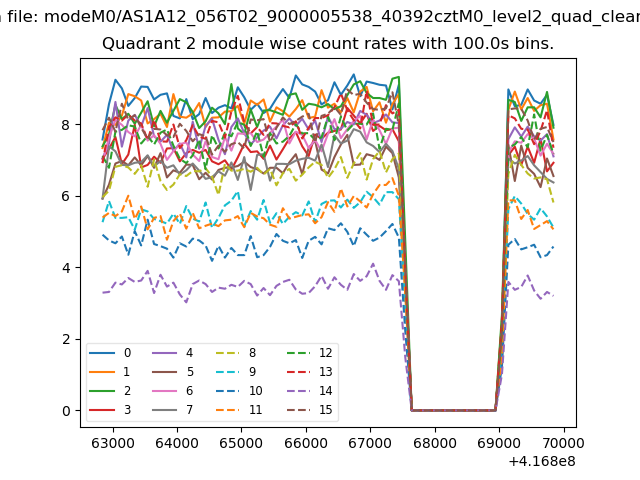
| Module-wise count rates for Quadrant B Data is divided into 100 sec bins |
 |
 |
| Module-wise count rates for Quadrant C Data is divided into 100 sec bins |
 |
 |
| Module-wise count rates for Quadrant D Data is divided into 100 sec bins |
 |
 |
| Parameter | Plot |
|---|---|
| CZT HV Monitor | 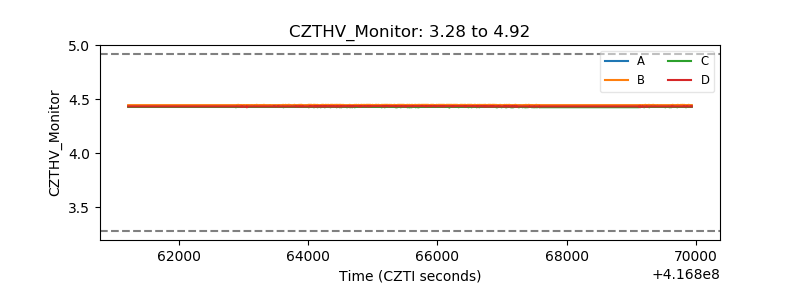 |
| D_VDD | 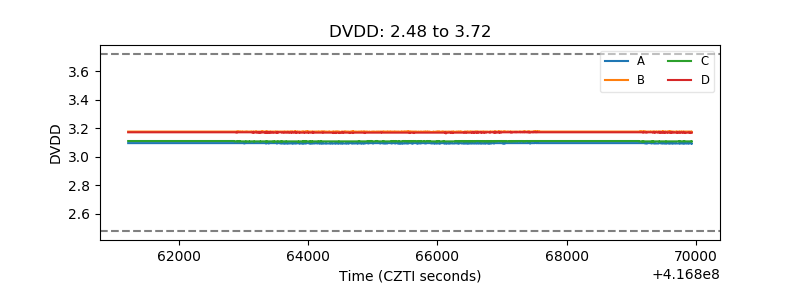 |
| Temperature 1 | 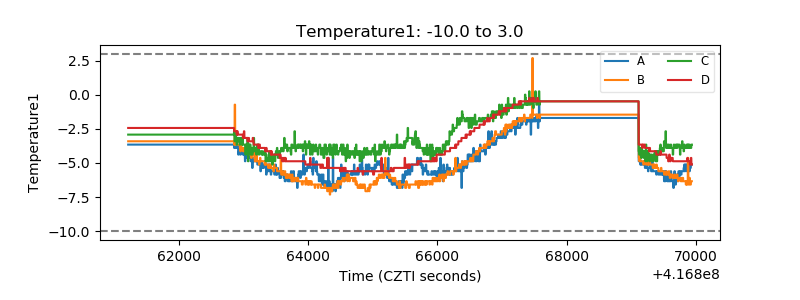 |
| Veto HV Monitor | 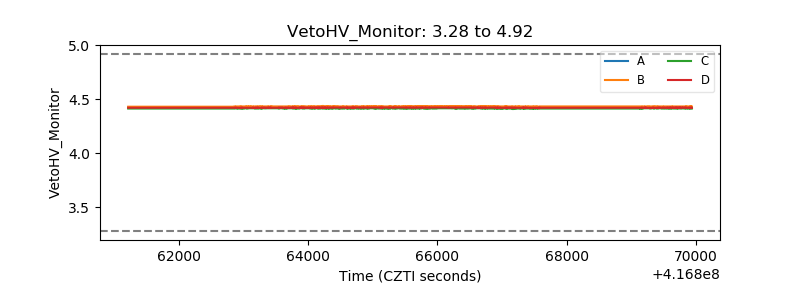 |
| Veto LLD | 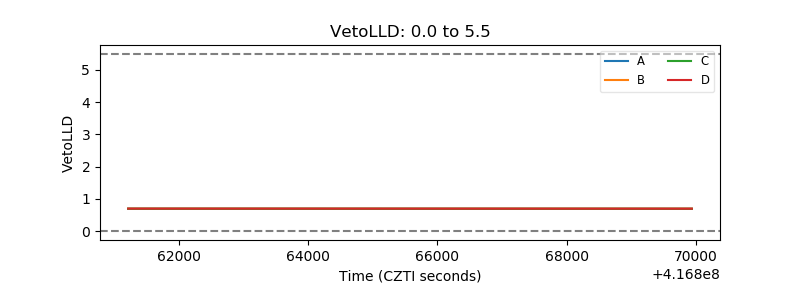 |
| Alpha Counter | 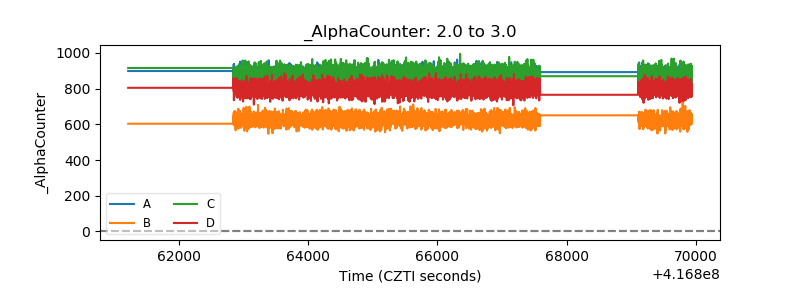 |
| _CPM_Rate | 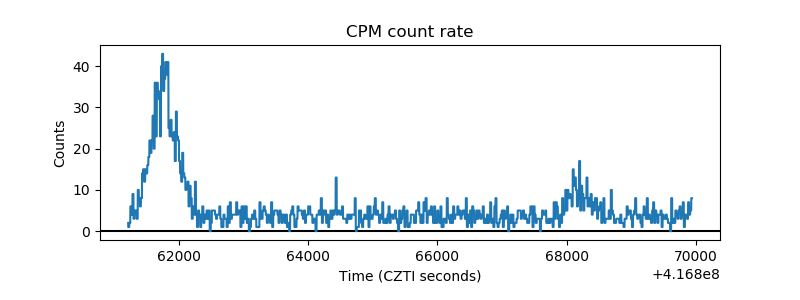 |
| CZT Counter | 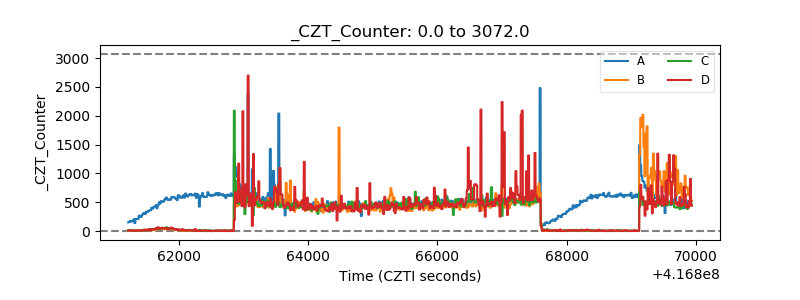 |
| +2.5 Volts monitor | 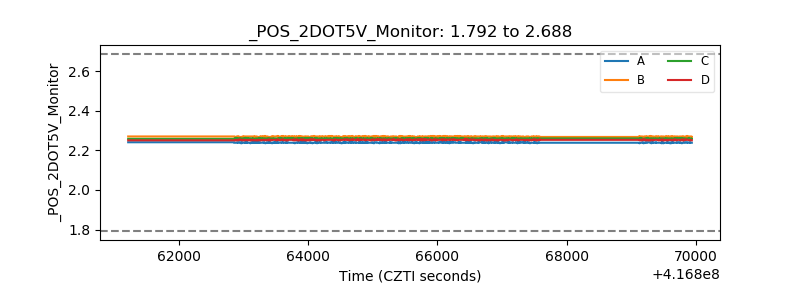 |
| +5 Volts monitor | 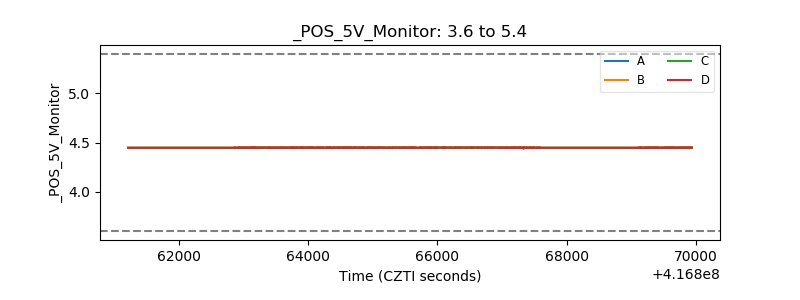 |
| _ROLL_ROT | 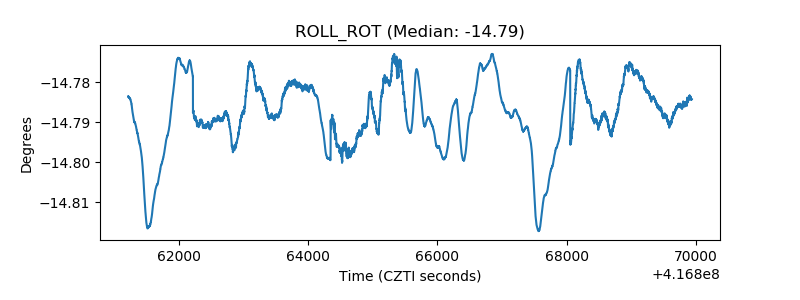 |
| _Roll_DEC | 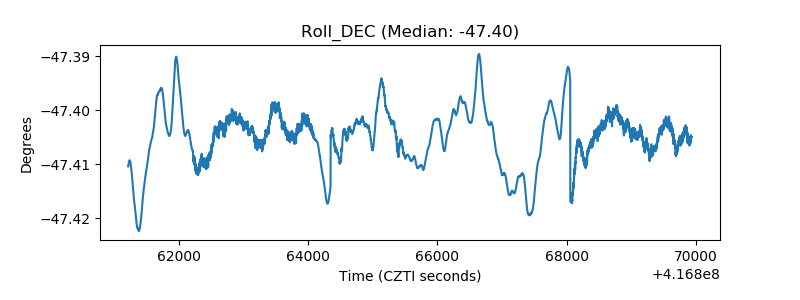 |
| _Roll_RA | 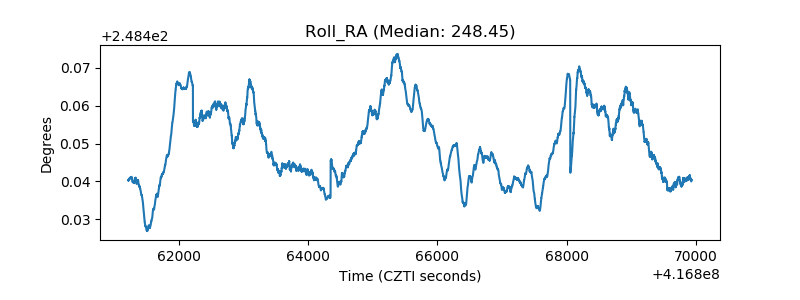 |
| Veto Counter | 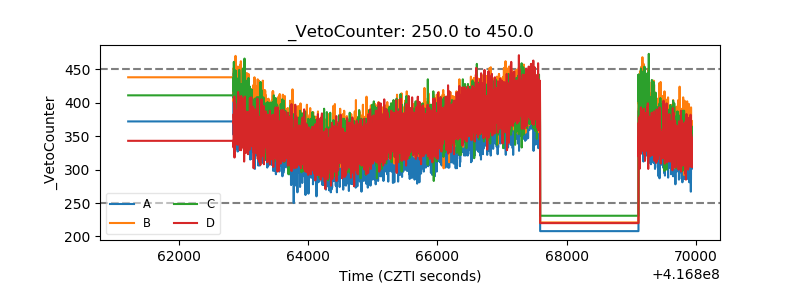 |