| Param | Original file | Final file |
|---|---|---|
| Filename | modeM0/AS1A12_056T02_9000005538_40393cztM0_level2.fits | modeM0/AS1A12_056T02_9000005538_40393cztM0_level2_quad_clean.evt |
| Size (bytes) | 407,076,480 | 95,693,760 |
| Size | 388.2 MB | 91.3 MB |
| Events in quadrant A | 3,145,826 | 656,285 |
| Events in quadrant B | 4,215,122 | 669,709 |
| Events in quadrant C | 2,916,137 | 639,688 |
| Events in quadrant D | 4,340,904 | 526,859 |
| Mode M0 | |||
|---|---|---|---|
| Quadrant | BADHDUFLAG | Total packets | Discarded packets |
| A | 0 | 12961 | 3 |
| B | 0 | 16565 | 2 |
| C | 0 | 12307 | 2 |
| D | 0 | 16924 | 2 |
| Mode M9 | |||
|---|---|---|---|
| Quadrant | BADHDUFLAG | Total packets | Discarded packets |
| A | 0 | 18 | 0 |
| B | 0 | 18 | 0 |
| C | 0 | 18 | 0 |
| D | 0 | 19 | 0 |
| Mode SS | |||
|---|---|---|---|
| Quadrant | BADHDUFLAG | Total packets | Discarded packets |
| A | 0 | 118 | 0 |
| B | 0 | 118 | 0 |
| C | 0 | 118 | 0 |
| D | 0 | 118 | 0 |
| Quadrant | Total seconds | Saturated seconds | Saturation percentage |
|---|---|---|---|
| A | 5795 | 38 | 0.655738% |
| B | 5795 | 105 | 1.811907% |
| C | 5795 | 13 | 0.224331% |
| D | 5795 | 730 | 12.597066% |
Noise dominated data is calculated using 1-second bins in cleaned event files. If a bin has >2000 counts, and if more than 50% of those come from <1% of pixels, then it is considered to be noise-dominated and hence unusable.
| Quadrant | # 1 sec bins | Bins with >0 counts | Bins with >2000 counts | High rate bins dominated by noise | Noise dominated (total time) | Noise dominated (detector-on time) | Marked lightcurve |
|---|---|---|---|---|---|---|---|
| A | 7137 | 5796 | 20 | 20 | 0.28% | 0.35% | 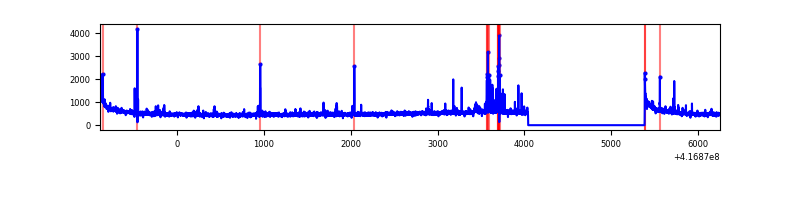 |
| B | 7137 | 5796 | 30 | 30 | 0.42% | 0.52% | 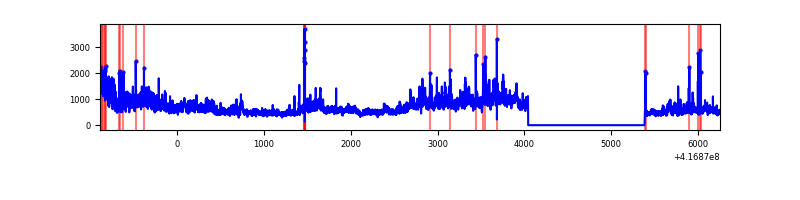 |
| C | 7137 | 5796 | 4 | 4 | 0.06% | 0.07% | 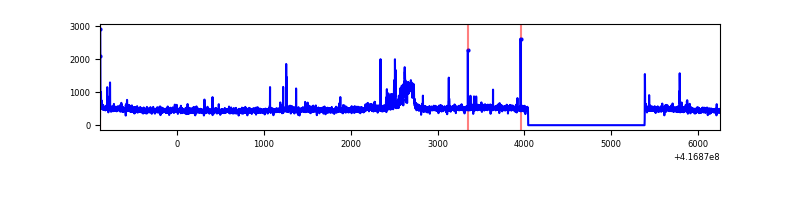 |
| D | 7137 | 5796 | 201 | 201 | 2.82% | 3.47% | 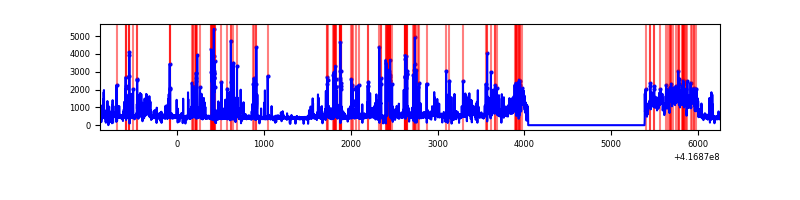 |
Top three noisy pixels from each quadrant. If the there are fewer than three noisy pixels in the level2.evt file, extra rows are filled as -1
| Pixel properties | Quadrant properties | ||||||
|---|---|---|---|---|---|---|---|
| Quadrant | DetID | PixID | Counts | Sigma | Mean | Median | Sigma |
| A | 10 | 83 | 502755 | 3857.31 | 635 | 623 | 130.2 |
| A | 13 | 248 | 92412 | 705.11 | 635 | 623 | 130.2 |
| A | 2 | 79 | 48206 | 365.53 | 635 | 623 | 130.2 |
| B | 7 | 202 | 1202510 | 9770.43 | 630 | 612 | 123.0 |
| B | 4 | 170 | 257268 | 2086.4 | 630 | 612 | 123.0 |
| B | 5 | 255 | 169142 | 1370.01 | 630 | 612 | 123.0 |
| C | 15 | 214 | 249589 | 1702.26 | 623 | 627 | 146.3 |
| C | 15 | 208 | 164080 | 1117.6 | 623 | 627 | 146.3 |
| C | 14 | 254 | 29291 | 195.99 | 623 | 627 | 146.3 |
| D | 12 | 227 | 1442080 | 9923.4 | 582 | 565 | 145.3 |
| D | 12 | 191 | 161898 | 1110.62 | 582 | 565 | 145.3 |
| D | 2 | 250 | 118914 | 814.72 | 582 | 565 | 145.3 |
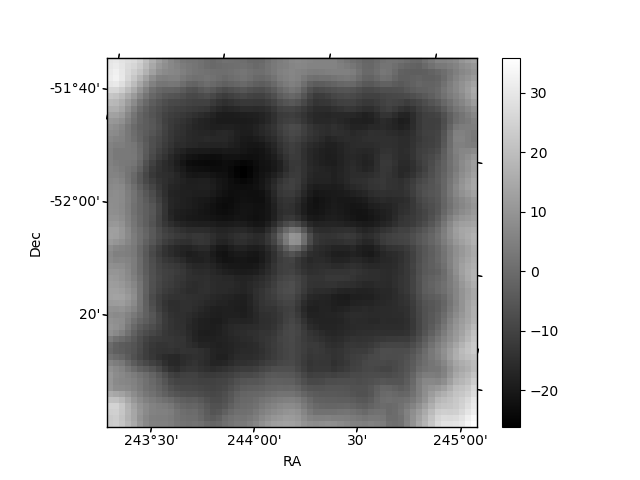
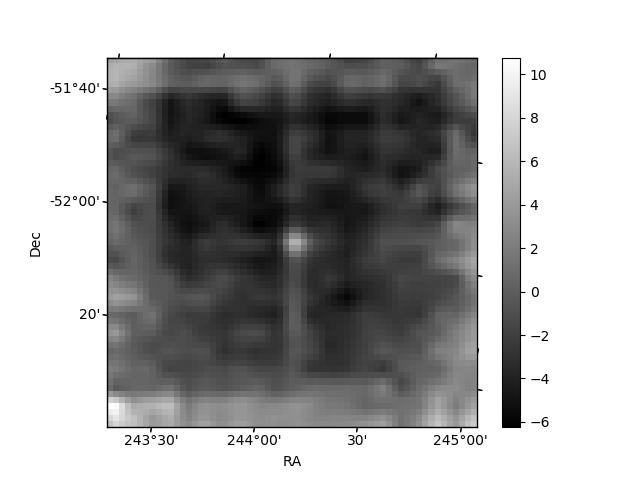
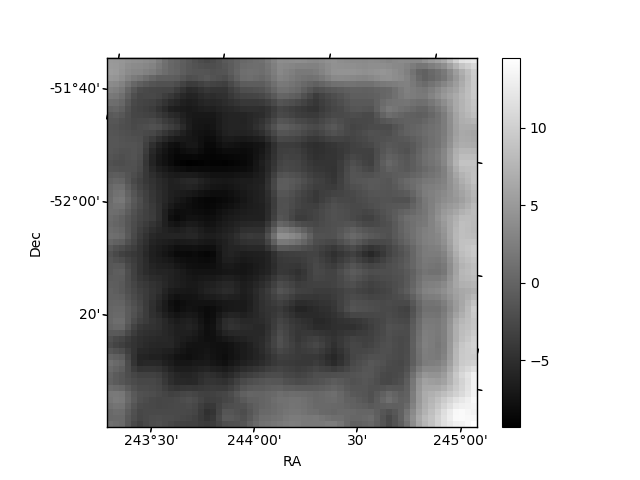
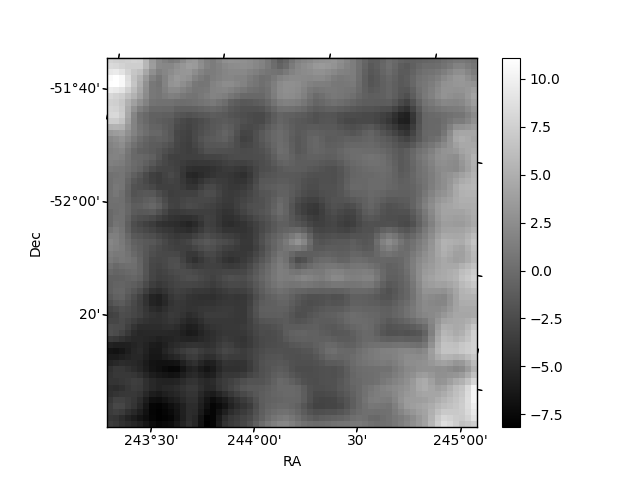
Histogram calculated using DETX and DETY for each event in the final _common_clean file
| Quadrant A | 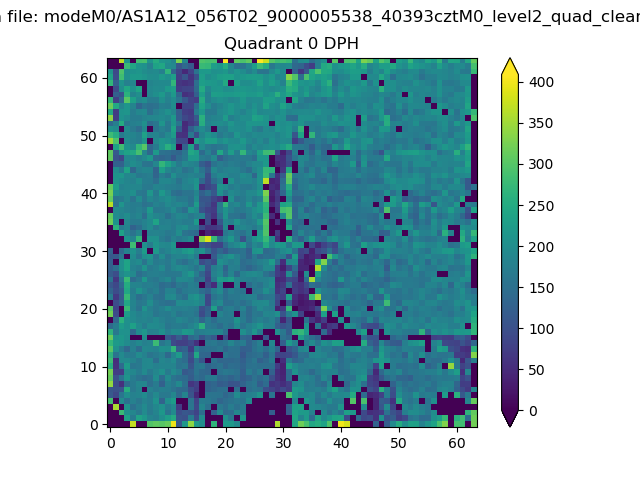 |
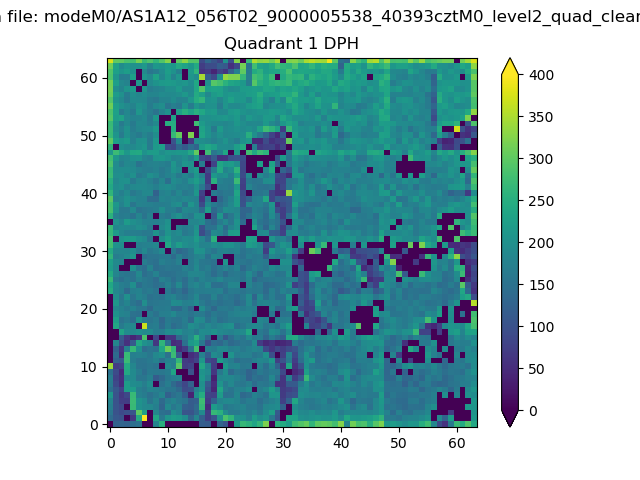 |
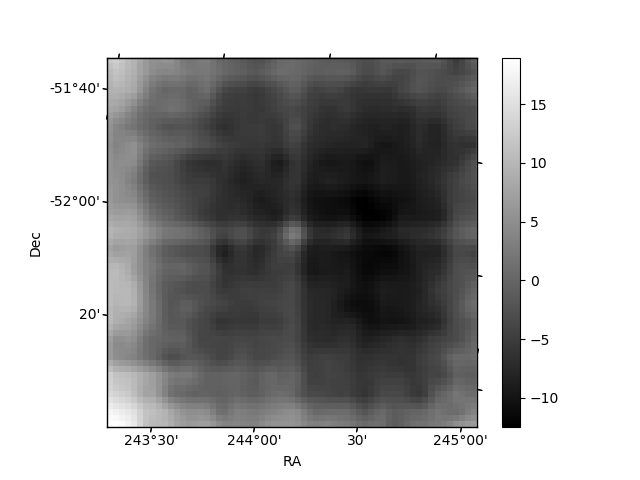
Quadrant B |
|---|---|---|---|
| Quadrant D | 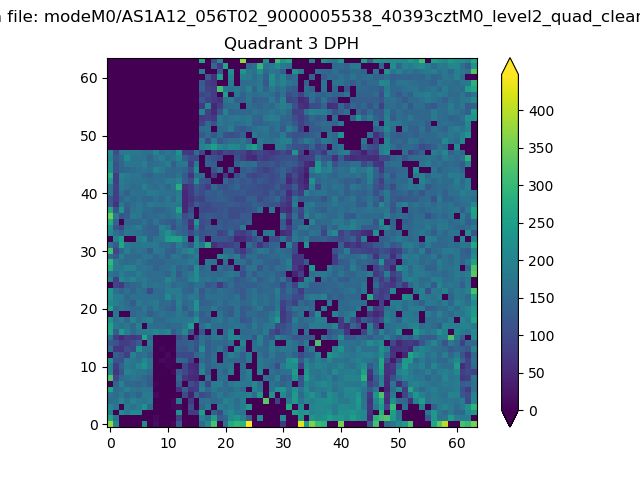 |
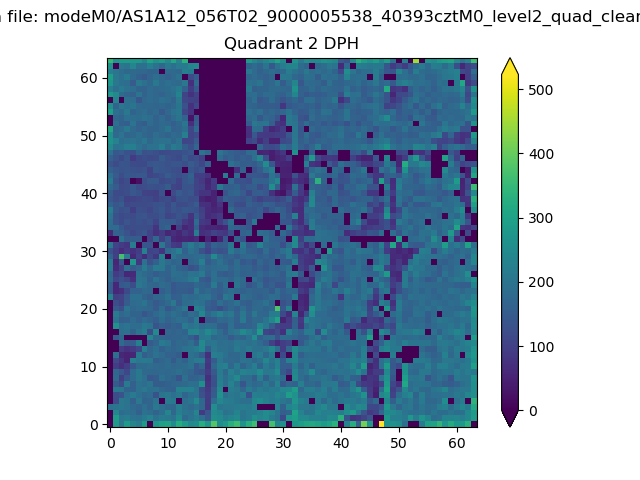 |
Quadrant C |
| Plot type | Count rate plots | Images |
|---|---|---|
| Comparison with Poisson distribution Blue bars denote a histogram of data divided into 1 sec bins. Red curve is a Poisson curve with rate = median count rate of data. |
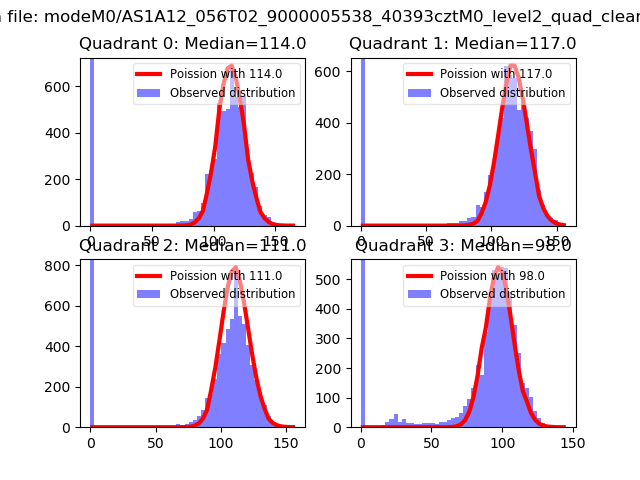 |
 |
| Quadrant-wise count rates Data is divided into 100 sec bins |
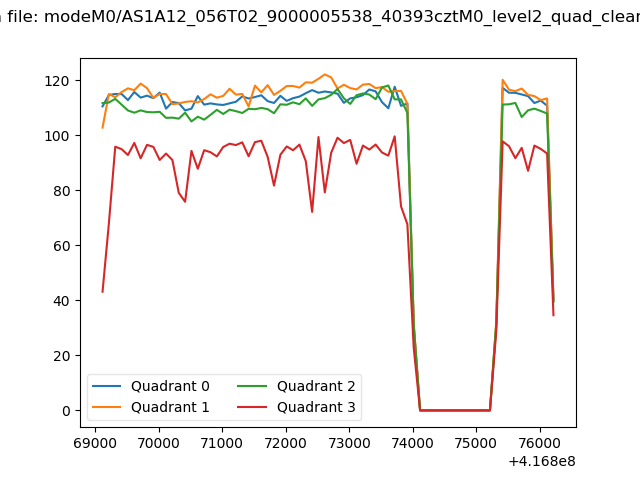 |
|
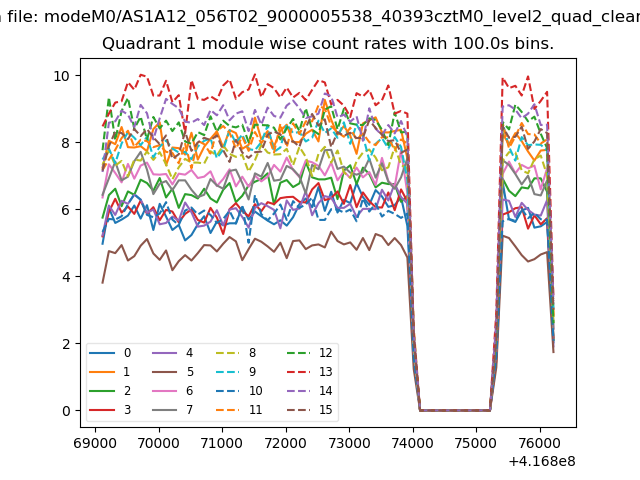
| Module-wise count rates for Quadrant A Data is divided into 100 sec bins |
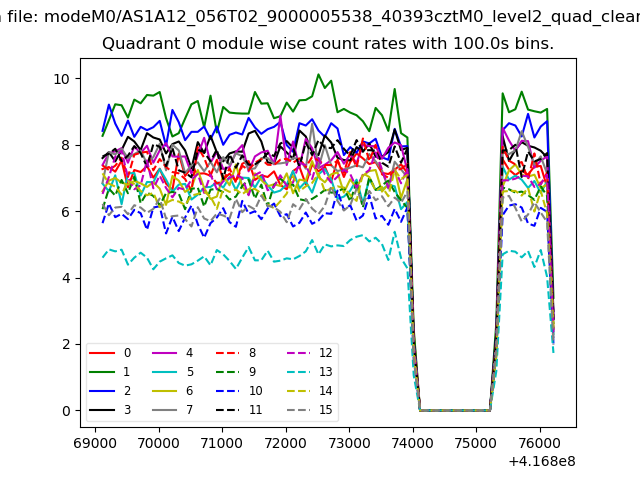 |
 |
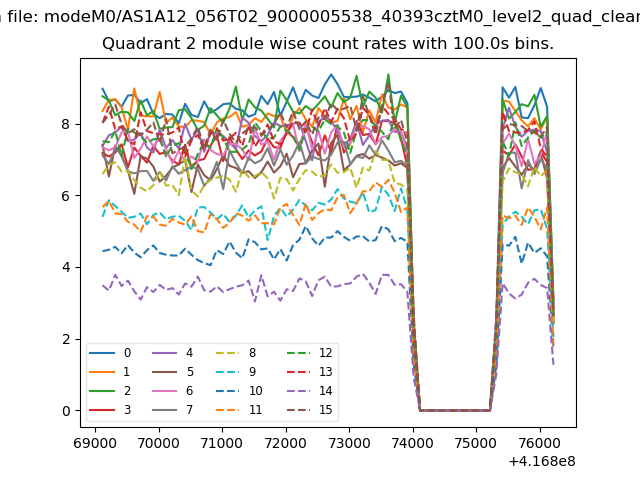
| Module-wise count rates for Quadrant B Data is divided into 100 sec bins |
 |
 |
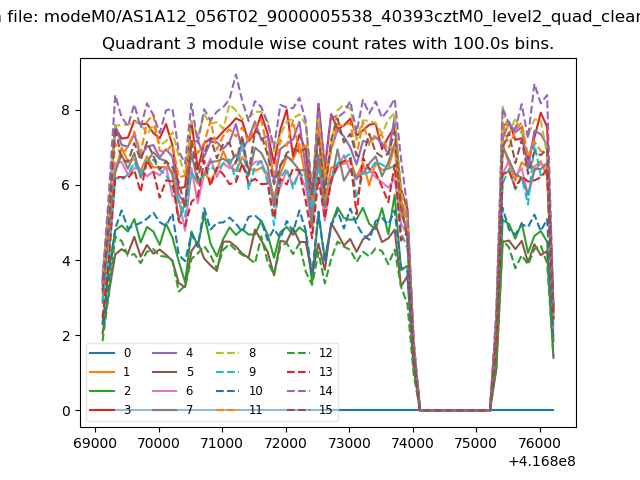
| Module-wise count rates for Quadrant C Data is divided into 100 sec bins |
 |
 |
| Module-wise count rates for Quadrant D Data is divided into 100 sec bins |
 |
 |
| Parameter | Plot |
|---|---|
| CZT HV Monitor | 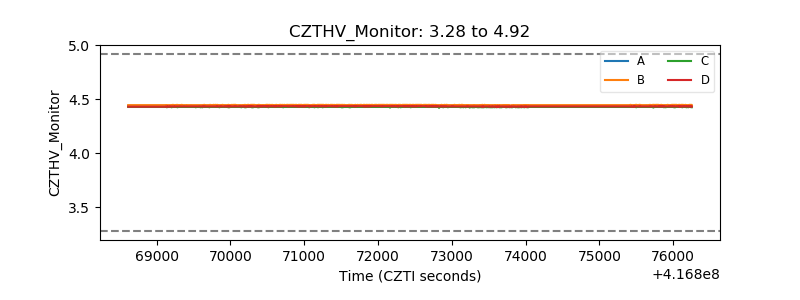 |
| D_VDD | 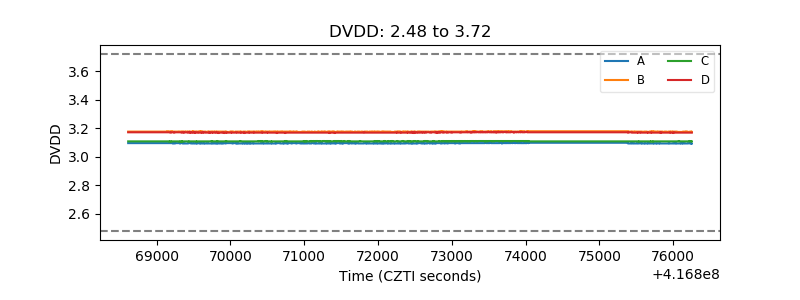 |
| Temperature 1 | 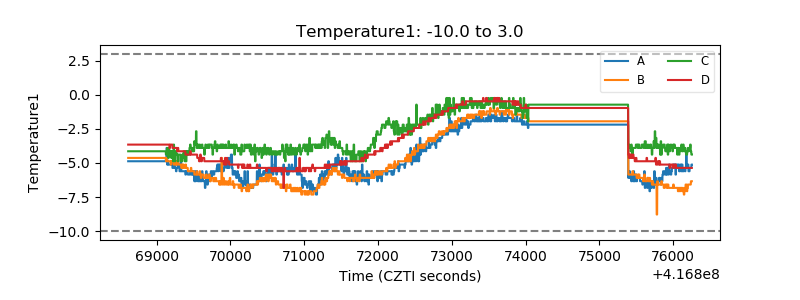 |
| Veto HV Monitor | 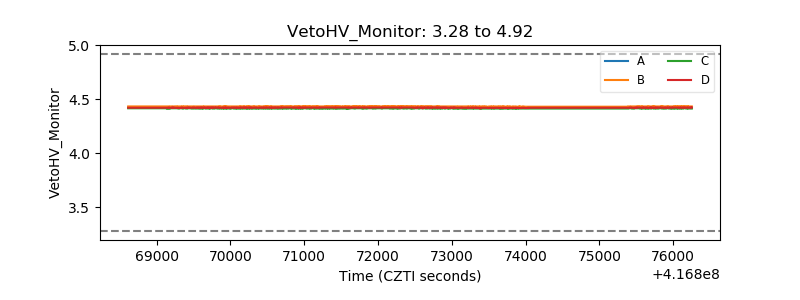 |
| Veto LLD | 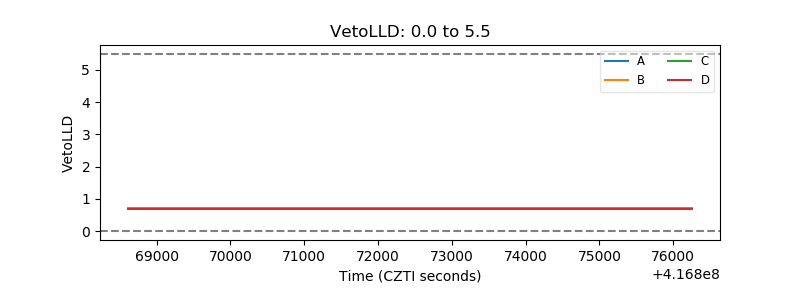 |
| Alpha Counter | 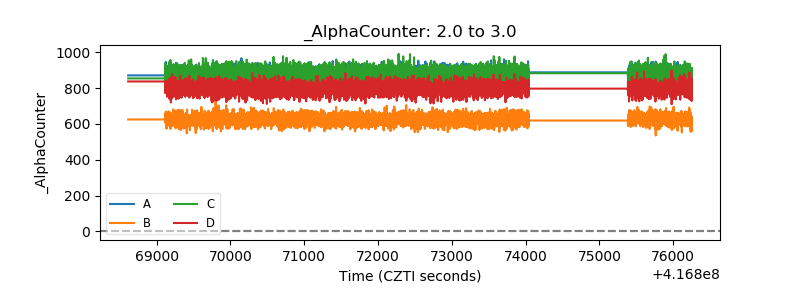 |
| _CPM_Rate | 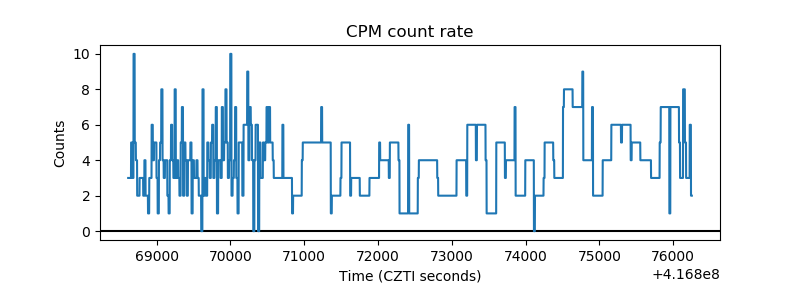 |
| CZT Counter | 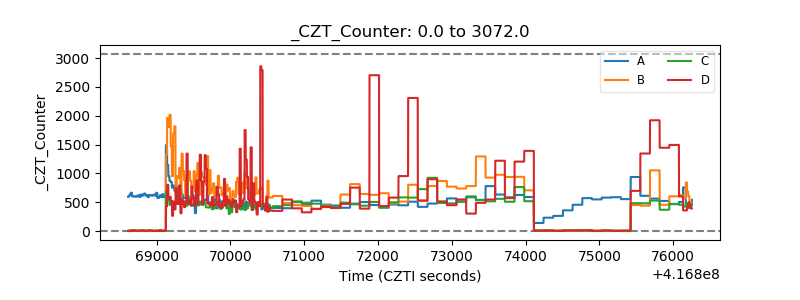 |
| +2.5 Volts monitor | 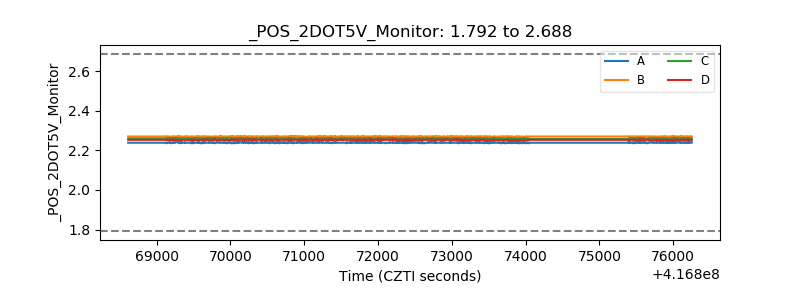 |
| +5 Volts monitor | 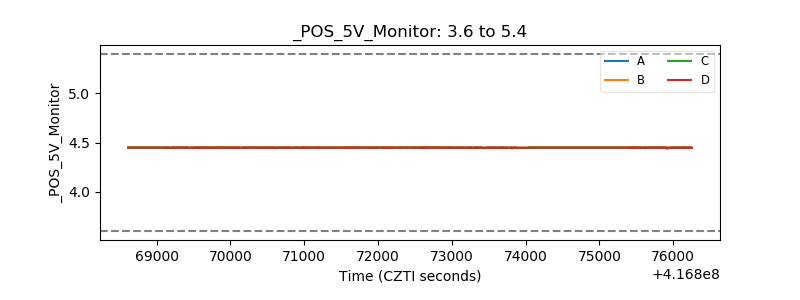 |
| _ROLL_ROT | 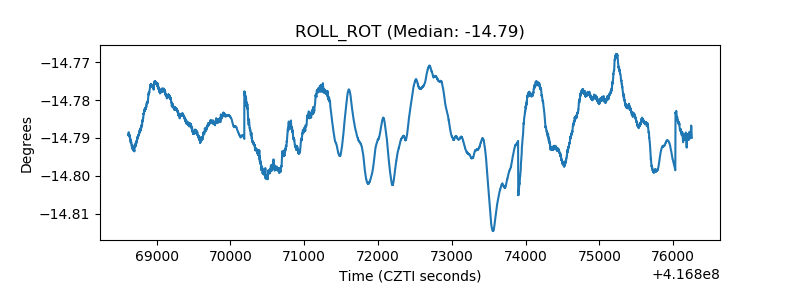 |
| _Roll_DEC | 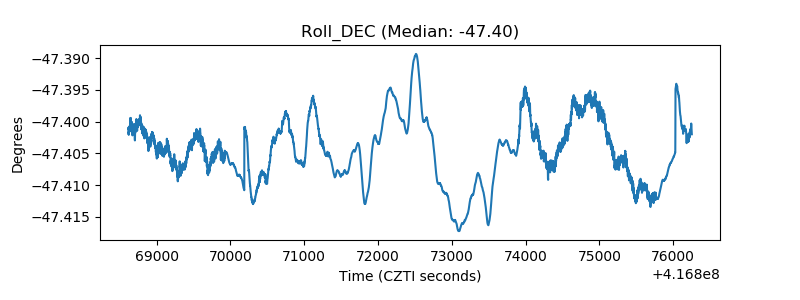 |
| _Roll_RA | 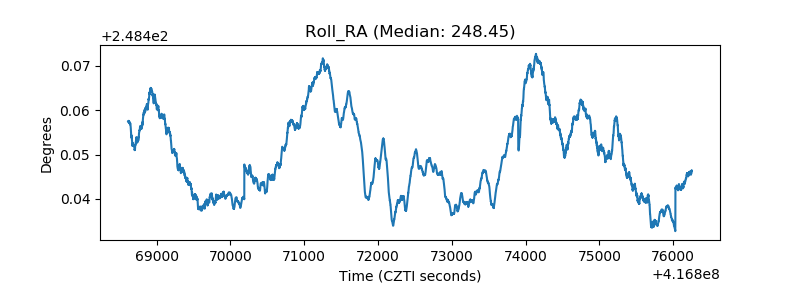 |
| Veto Counter | 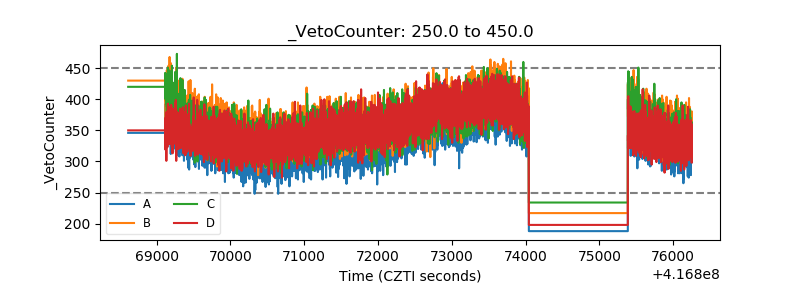 |