| Param | Original file | Final file |
|---|---|---|
| Filename | modeM0/AS1A12_056T02_9000005538_40400cztM0_level2.fits | modeM0/AS1A12_056T02_9000005538_40400cztM0_level2_quad_clean.evt |
| Size (bytes) | 1,858,017,600 | 349,404,480 |
| Size | 1.7 GB | 333.2 MB |
| Events in quadrant A | 12,214,532 | 2,518,488 |
| Events in quadrant B | 20,984,479 | 2,468,724 |
| Events in quadrant C | 11,129,599 | 2,491,197 |
| Events in quadrant D | 22,727,896 | 1,567,724 |
| Mode M0 | |||
|---|---|---|---|
| Quadrant | BADHDUFLAG | Total packets | Discarded packets |
| A | 0 | 49410 | 6 |
| B | 0 | 77763 | 5 |
| C | 0 | 46537 | 5 |
| D | 0 | 82622 | 5 |
| Mode M9 | |||
|---|---|---|---|
| Quadrant | BADHDUFLAG | Total packets | Discarded packets |
| A | 0 | 78 | 0 |
| B | 0 | 78 | 0 |
| C | 0 | 78 | 0 |
| D | 0 | 78 | 0 |
| Mode SS | |||
|---|---|---|---|
| Quadrant | BADHDUFLAG | Total packets | Discarded packets |
| A | 0 | 456 | 0 |
| B | 0 | 456 | 0 |
| C | 0 | 456 | 0 |
| D | 0 | 456 | 0 |
| Quadrant | Total seconds | Saturated seconds | Saturation percentage |
|---|---|---|---|
| A | 22257 | 163 | 0.732354% |
| B | 22257 | 1779 | 7.992991% |
| C | 22257 | 58 | 0.260592% |
| D | 22257 | 7020 | 31.540639% |
Noise dominated data is calculated using 1-second bins in cleaned event files. If a bin has >2000 counts, and if more than 50% of those come from <1% of pixels, then it is considered to be noise-dominated and hence unusable.
| Quadrant | # 1 sec bins | Bins with >0 counts | Bins with >2000 counts | High rate bins dominated by noise | Noise dominated (total time) | Noise dominated (detector-on time) | Marked lightcurve |
|---|---|---|---|---|---|---|---|
| A | 30111 | 22262 | 112 | 112 | 0.37% | 0.50% | 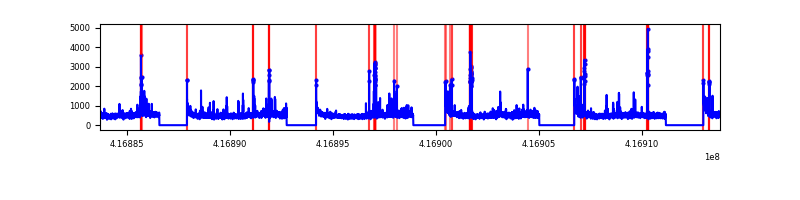 |
| B | 30111 | 22262 | 1056 | 1056 | 3.51% | 4.74% | 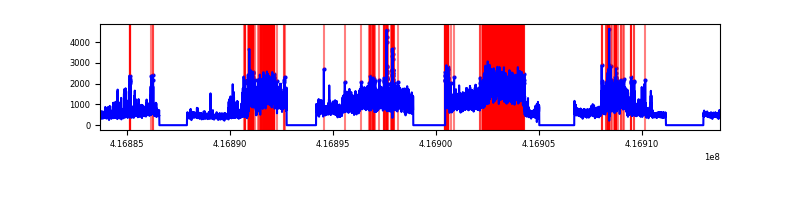 |
| C | 30111 | 22262 | 35 | 35 | 0.12% | 0.16% | 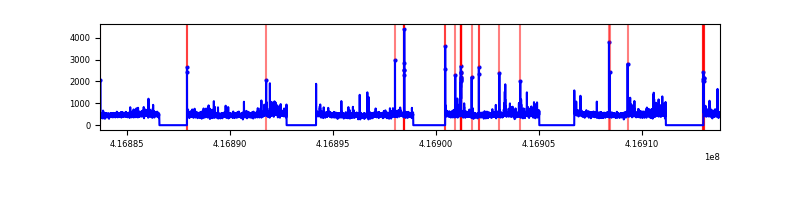 |
| D | 30111 | 22258 | 3647 | 3647 | 12.11% | 16.39% | 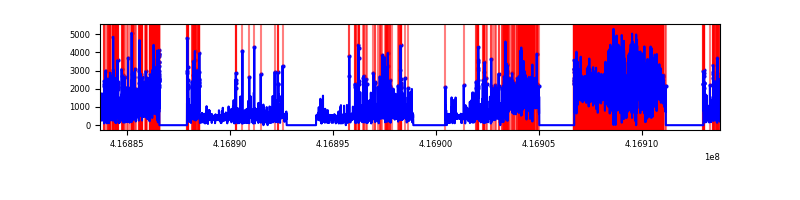 |
Top three noisy pixels from each quadrant. If the there are fewer than three noisy pixels in the level2.evt file, extra rows are filled as -1
| Pixel properties | Quadrant properties | ||||||
|---|---|---|---|---|---|---|---|
| Quadrant | DetID | PixID | Counts | Sigma | Mean | Median | Sigma |
| A | 10 | 83 | 1720718 | 3373.62 | 2508 | 2456 | 509.3 |
| A | 13 | 248 | 354919 | 692.02 | 2508 | 2456 | 509.3 |
| A | 9 | 143 | 263924 | 513.36 | 2508 | 2456 | 509.3 |
| B | 7 | 202 | 8876954 | 19007.58 | 2437 | 2371 | 466.9 |
| B | 4 | 170 | 1619835 | 3464.28 | 2437 | 2371 | 466.9 |
| B | 4 | 171 | 490332 | 1045.11 | 2437 | 2371 | 466.9 |
| C | 15 | 214 | 956627 | 1690.34 | 2446 | 2468 | 564.5 |
| C | 9 | 54 | 322983 | 567.81 | 2446 | 2468 | 564.5 |
| C | 15 | 159 | 91139 | 157.09 | 2446 | 2468 | 564.5 |
| D | 12 | 227 | 11542306 | 22152.5 | 2130 | 2077 | 520.9 |
| D | 12 | 191 | 668809 | 1279.85 | 2130 | 2077 | 520.9 |
| D | 2 | 250 | 508504 | 972.13 | 2130 | 2077 | 520.9 |
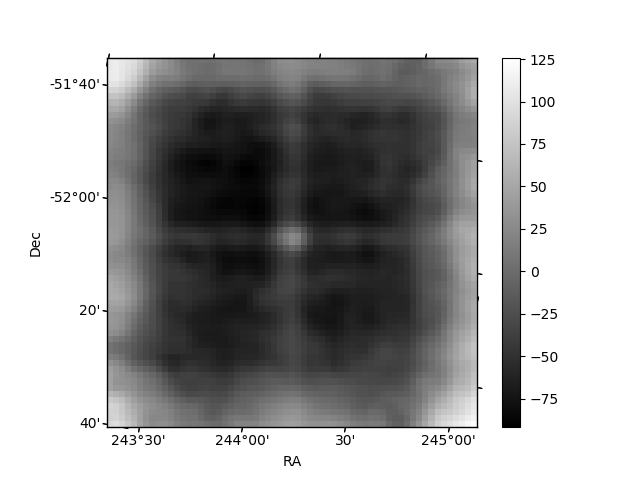
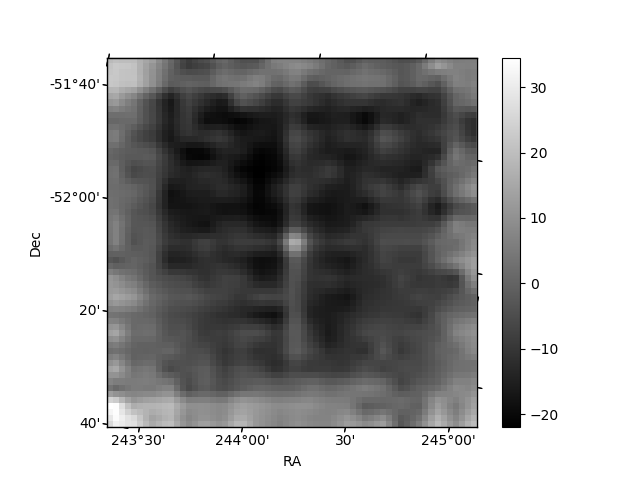
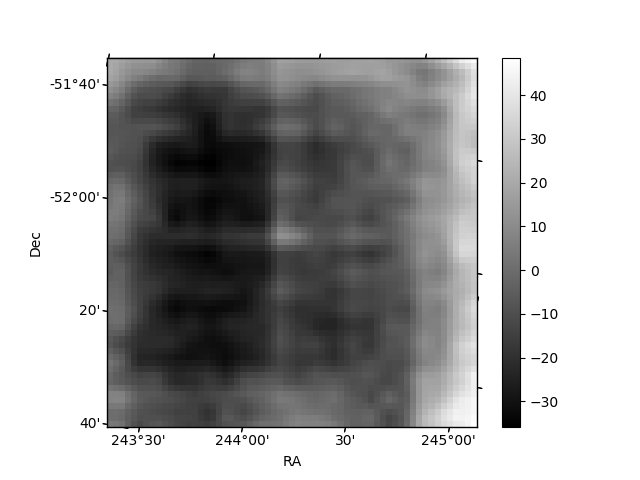
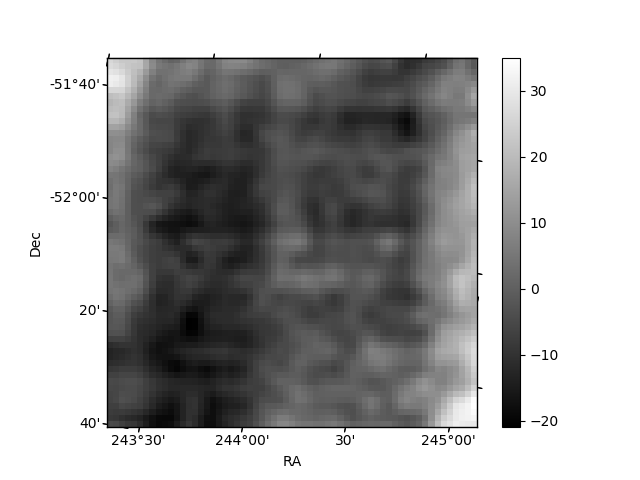
Histogram calculated using DETX and DETY for each event in the final _common_clean file
| Quadrant A | 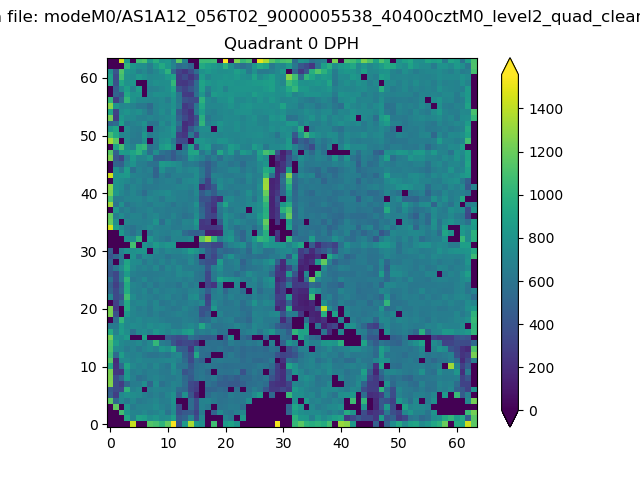 |
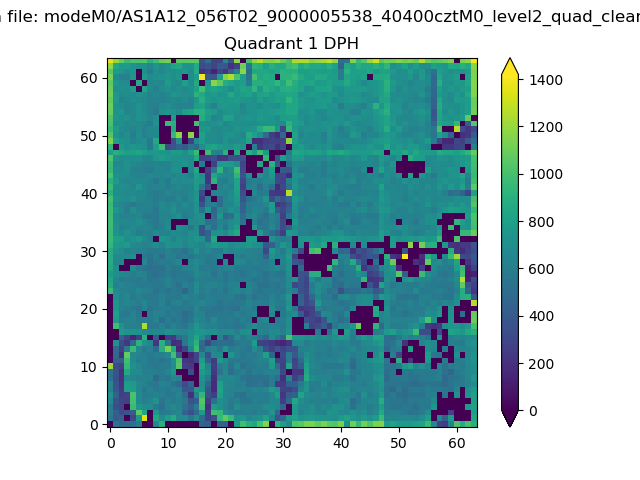 |
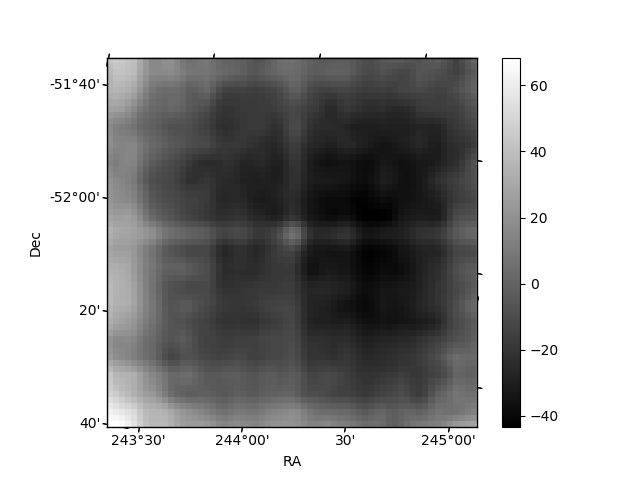
Quadrant B |
|---|---|---|---|
| Quadrant D | 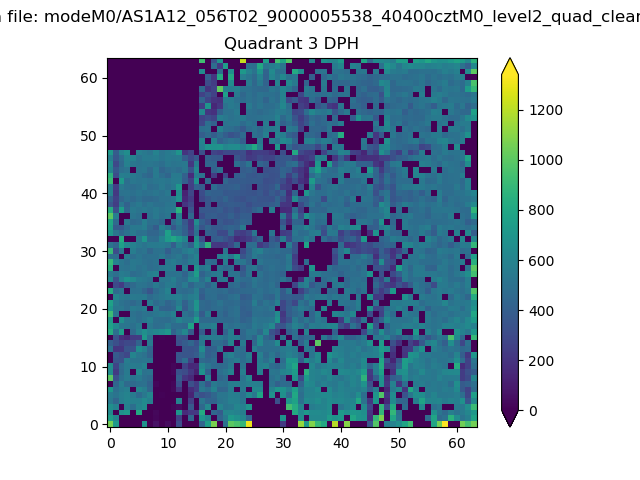 |
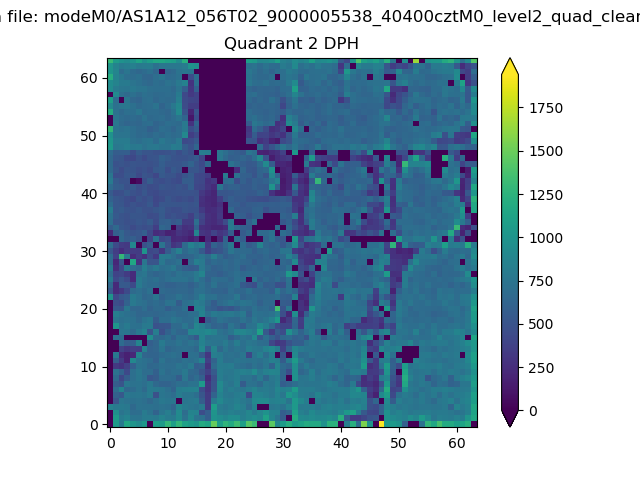 |
Quadrant C |
| Plot type | Count rate plots | Images |
|---|---|---|
| Comparison with Poisson distribution Blue bars denote a histogram of data divided into 1 sec bins. Red curve is a Poisson curve with rate = median count rate of data. |
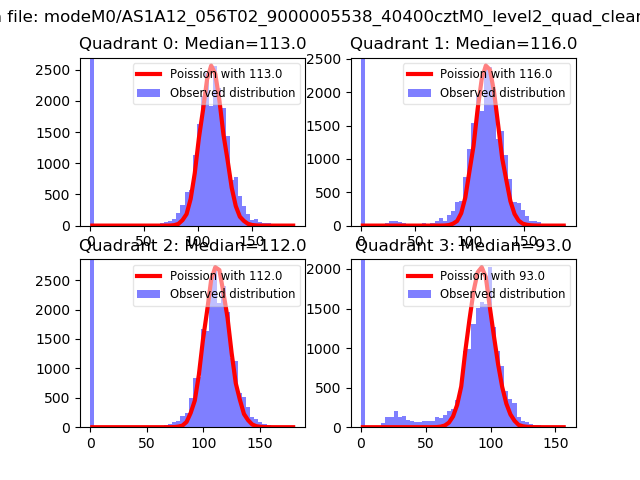 |
 |
| Quadrant-wise count rates Data is divided into 100 sec bins |
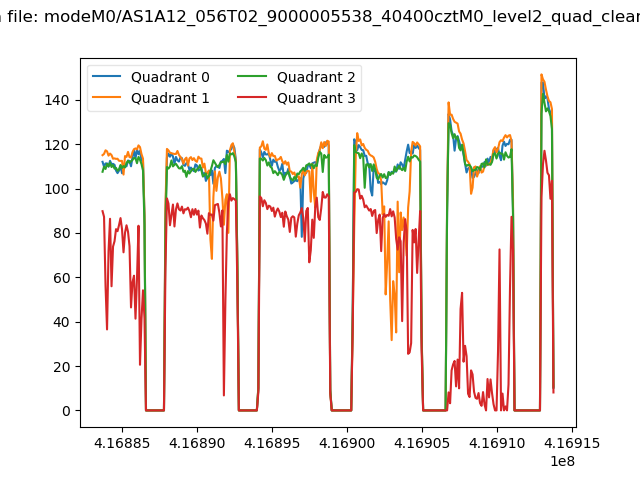 |
|
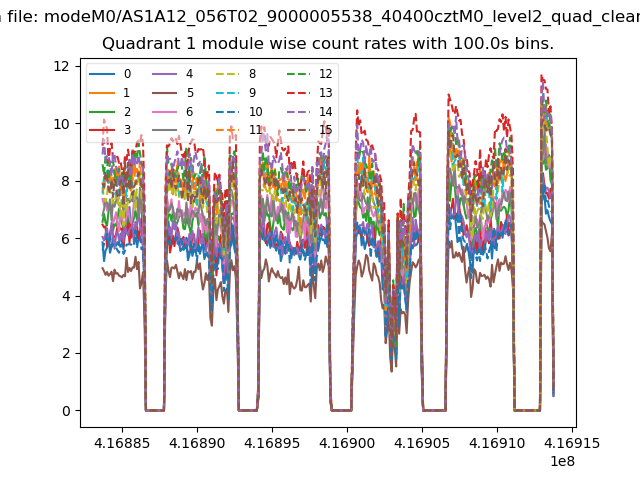
| Module-wise count rates for Quadrant A Data is divided into 100 sec bins |
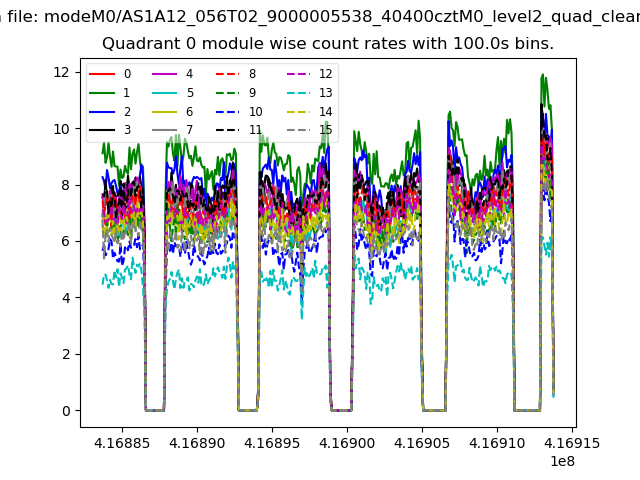 |
 |
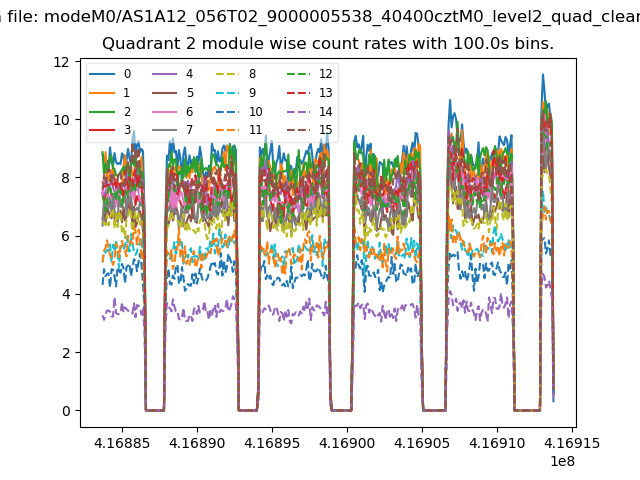
| Module-wise count rates for Quadrant B Data is divided into 100 sec bins |
 |
 |
| Module-wise count rates for Quadrant C Data is divided into 100 sec bins |
 |
 |
| Module-wise count rates for Quadrant D Data is divided into 100 sec bins |
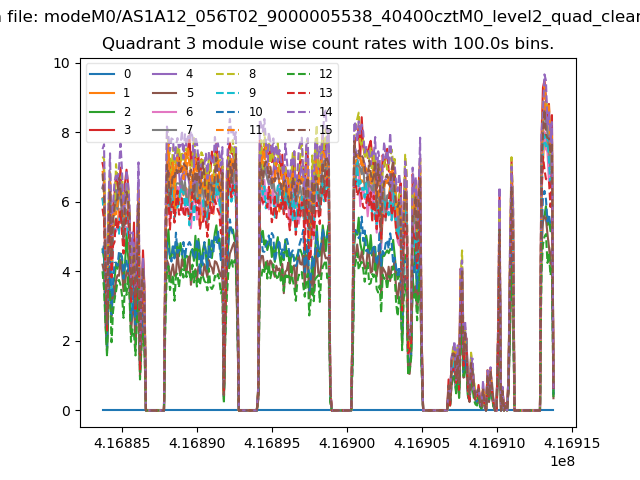 |
 |
| Parameter | Plot |
|---|---|
| CZT HV Monitor | 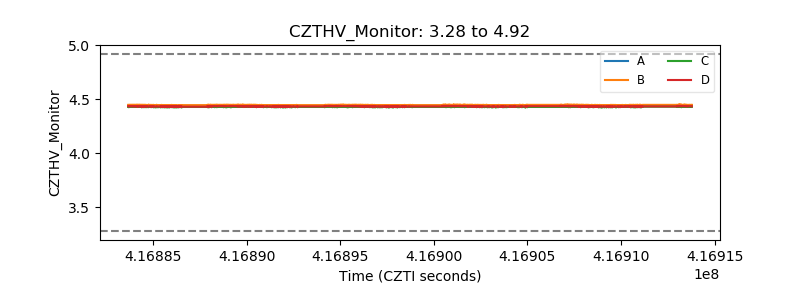 |
| D_VDD | 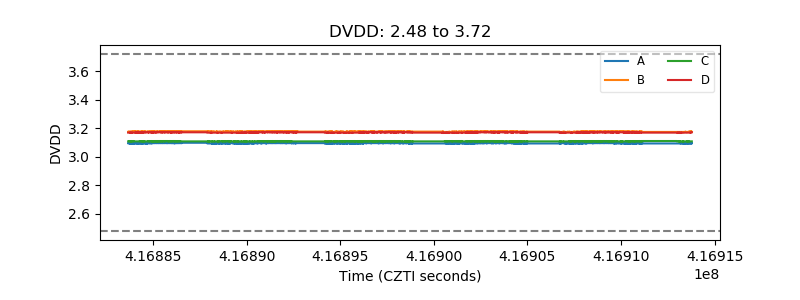 |
| Temperature 1 | 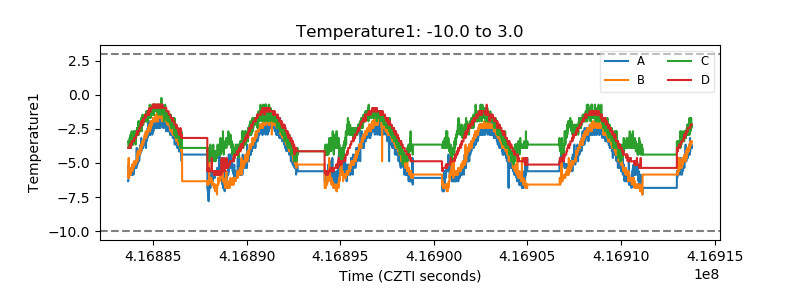 |
| Veto HV Monitor | 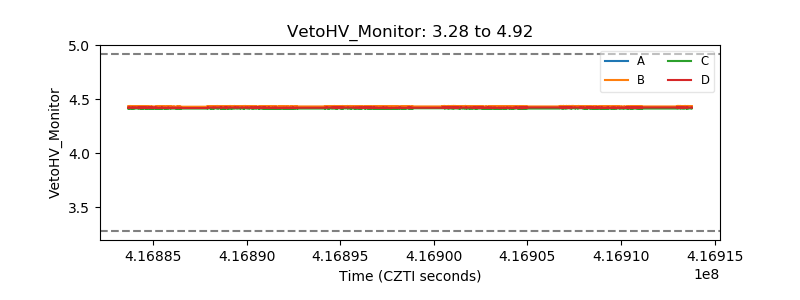 |
| Veto LLD | 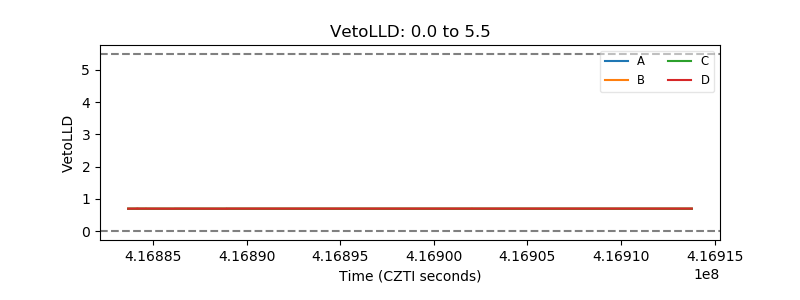 |
| Alpha Counter | 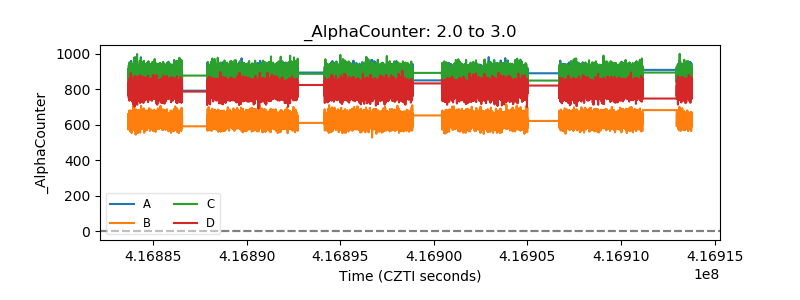 |
| _CPM_Rate | 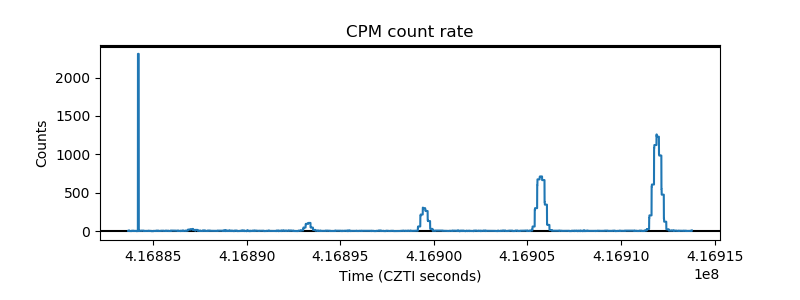 |
| CZT Counter | 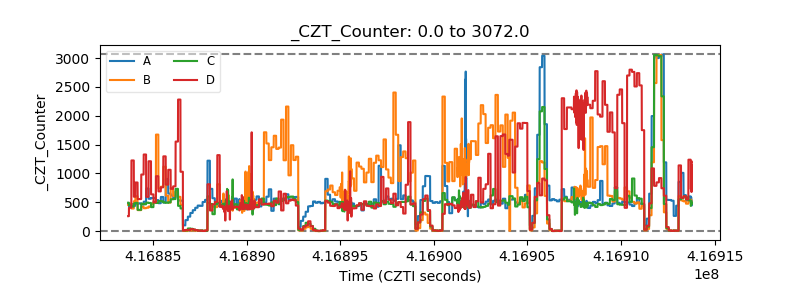 |
| +2.5 Volts monitor | 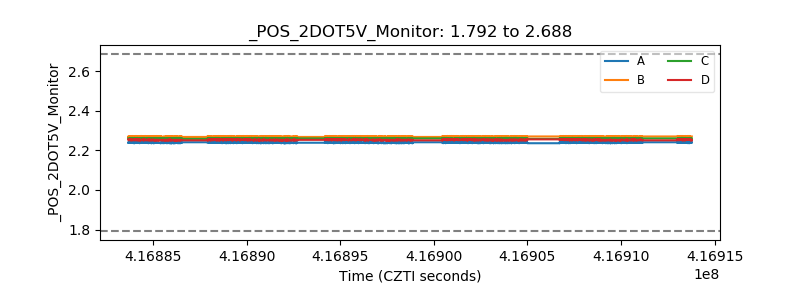 |
| +5 Volts monitor |  |
| _ROLL_ROT | 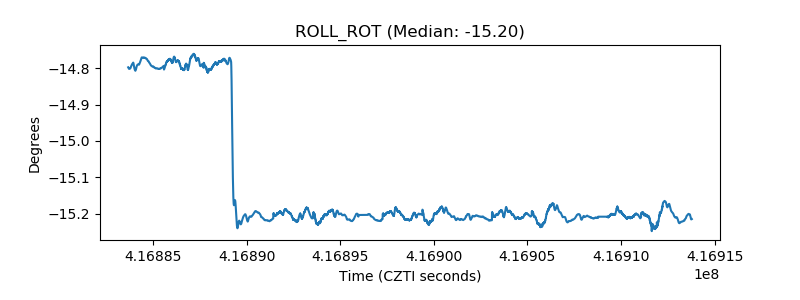 |
| _Roll_DEC | 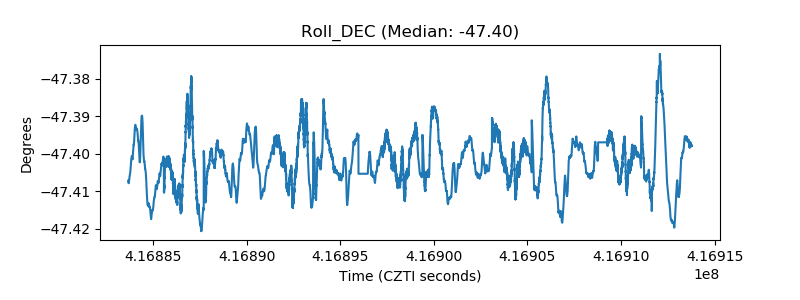 |
| _Roll_RA | 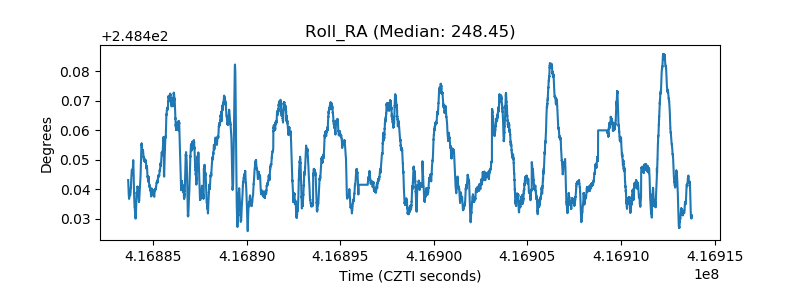 |
| Veto Counter | 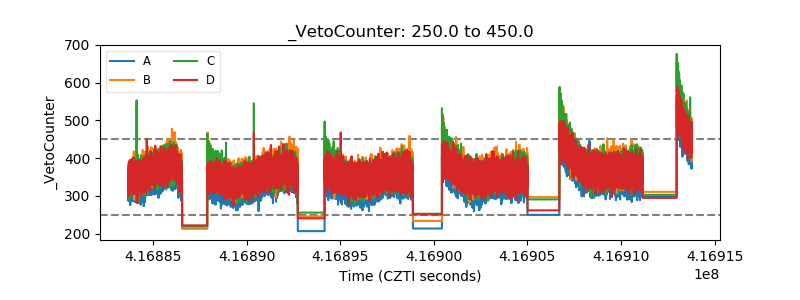 |