| Param | Original file | Final file |
|---|---|---|
| Filename | modeM0/AS1A12_056T02_9000005538_40401cztM0_level2.fits | modeM0/AS1A12_056T02_9000005538_40401cztM0_level2_quad_clean.evt |
| Size (bytes) | 2,661,500,160 | 543,931,200 |
| Size | 2.5 GB | 518.7 MB |
| Events in quadrant A | 18,639,459 | 3,859,848 |
| Events in quadrant B | 28,092,082 | 3,843,973 |
| Events in quadrant C | 16,795,121 | 3,804,055 |
| Events in quadrant D | 32,384,326 | 2,641,088 |
| Mode M0 | |||
|---|---|---|---|
| Quadrant | BADHDUFLAG | Total packets | Discarded packets |
| A | 0 | 75542 | 8 |
| B | 0 | 106833 | 7 |
| C | 0 | 70306 | 8 |
| D | 0 | 119097 | 7 |
| Mode M9 | |||
|---|---|---|---|
| Quadrant | BADHDUFLAG | Total packets | Discarded packets |
| A | 0 | 93 | 0 |
| B | 0 | 93 | 0 |
| C | 0 | 93 | 0 |
| D | 0 | 93 | 0 |
| Mode SS | |||
|---|---|---|---|
| Quadrant | BADHDUFLAG | Total packets | Discarded packets |
| A | 0 | 688 | 0 |
| B | 0 | 688 | 0 |
| C | 0 | 688 | 0 |
| D | 0 | 688 | 0 |
| Quadrant | Total seconds | Saturated seconds | Saturation percentage |
|---|---|---|---|
| A | 33753 | 278 | 0.823630% |
| B | 33753 | 1875 | 5.555062% |
| C | 33752 | 70 | 0.207395% |
| D | 33753 | 9163 | 27.147217% |
Noise dominated data is calculated using 1-second bins in cleaned event files. If a bin has >2000 counts, and if more than 50% of those come from <1% of pixels, then it is considered to be noise-dominated and hence unusable.
| Quadrant | # 1 sec bins | Bins with >0 counts | Bins with >2000 counts | High rate bins dominated by noise | Noise dominated (total time) | Noise dominated (detector-on time) | Marked lightcurve |
|---|---|---|---|---|---|---|---|
| A | 44964 | 33760 | 177 | 177 | 0.39% | 0.52% | 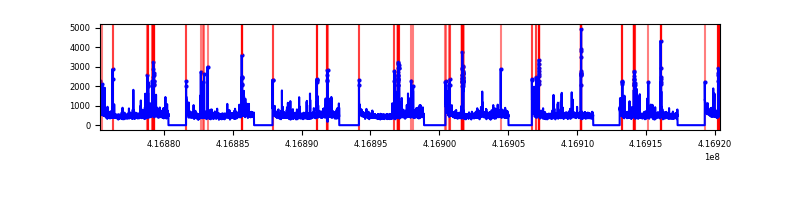 |
| B | 44964 | 33760 | 1102 | 1102 | 2.45% | 3.26% | 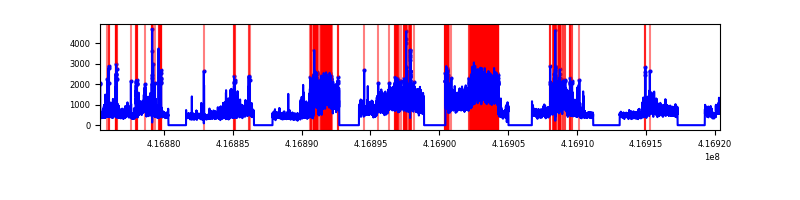 |
| C | 44964 | 33759 | 40 | 40 | 0.09% | 0.12% | 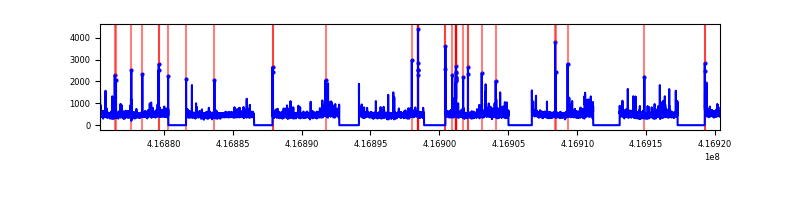 |
| D | 44965 | 33755 | 4582 | 4582 | 10.19% | 13.57% | 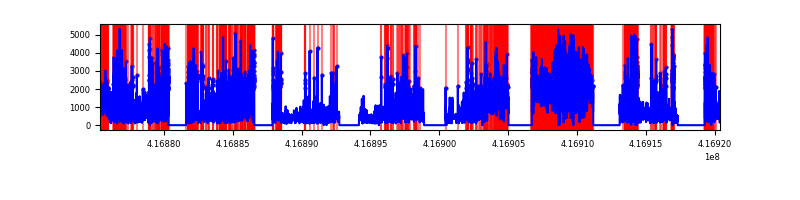 |
Top three noisy pixels from each quadrant. If the there are fewer than three noisy pixels in the level2.evt file, extra rows are filled as -1
| Pixel properties | Quadrant properties | ||||||
|---|---|---|---|---|---|---|---|
| Quadrant | DetID | PixID | Counts | Sigma | Mean | Median | Sigma |
| A | 10 | 83 | 2602379 | 3378.11 | 3800 | 3729 | 769.3 |
| A | 13 | 248 | 722425 | 934.27 | 3800 | 3729 | 769.3 |
| A | 9 | 143 | 292649 | 375.58 | 3800 | 3729 | 769.3 |
| B | 7 | 202 | 10437663 | 14846.73 | 3716 | 3617 | 702.8 |
| B | 4 | 170 | 1832925 | 2602.94 | 3716 | 3617 | 702.8 |
| B | 4 | 171 | 519473 | 734.02 | 3716 | 3617 | 702.8 |
| C | 15 | 214 | 1449910 | 1693.25 | 3711 | 3744 | 854.1 |
| C | 9 | 54 | 395014 | 458.12 | 3711 | 3744 | 854.1 |
| C | 14 | 254 | 130486 | 148.4 | 3711 | 3744 | 854.1 |
| D | 12 | 227 | 14799878 | 18601.11 | 3263 | 3179 | 795.5 |
| D | 2 | 250 | 1358286 | 1703.52 | 3263 | 3179 | 795.5 |
| D | 12 | 191 | 987057 | 1236.84 | 3263 | 3179 | 795.5 |
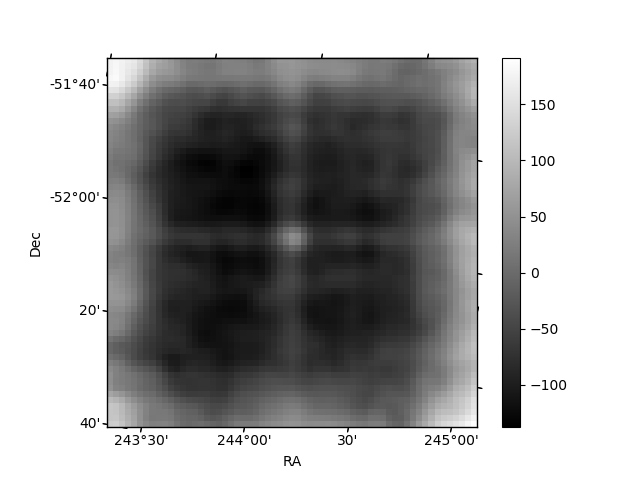
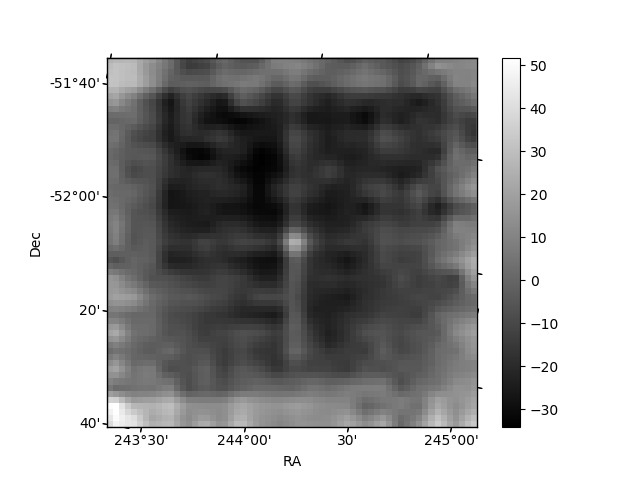
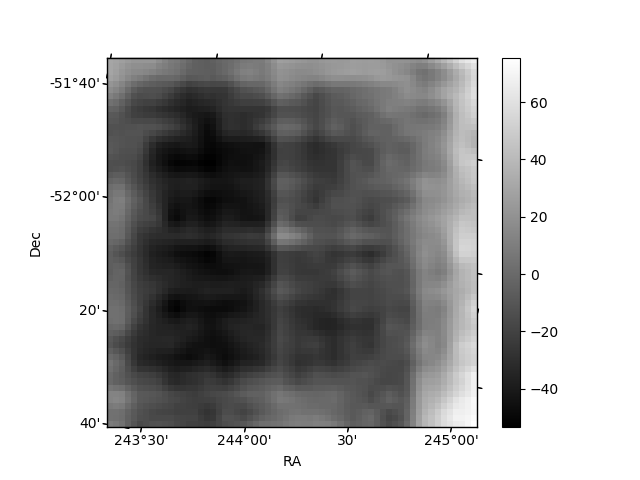
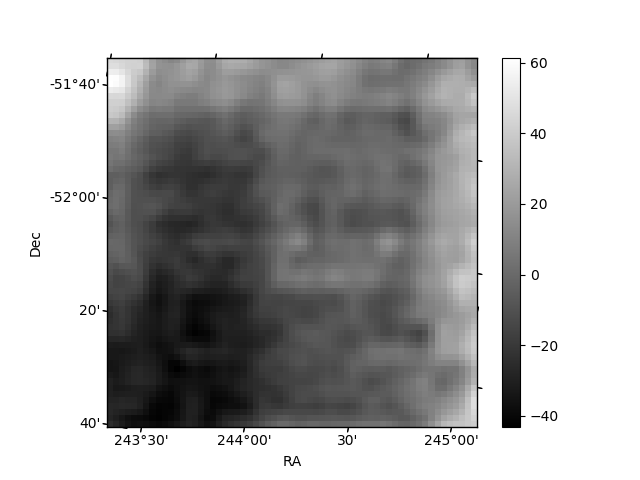
Histogram calculated using DETX and DETY for each event in the final _common_clean file
| Quadrant A | 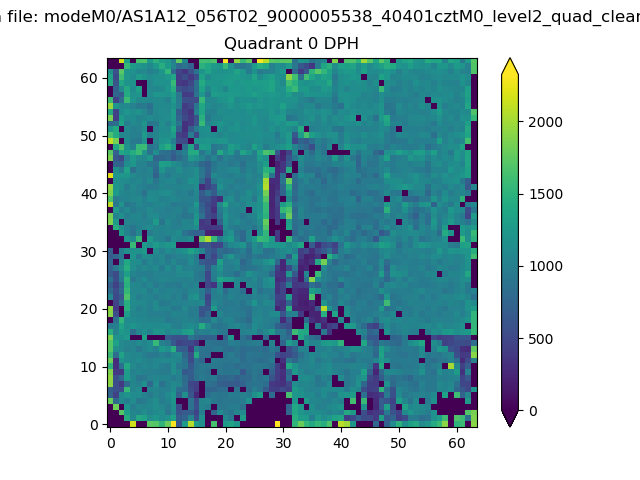 |
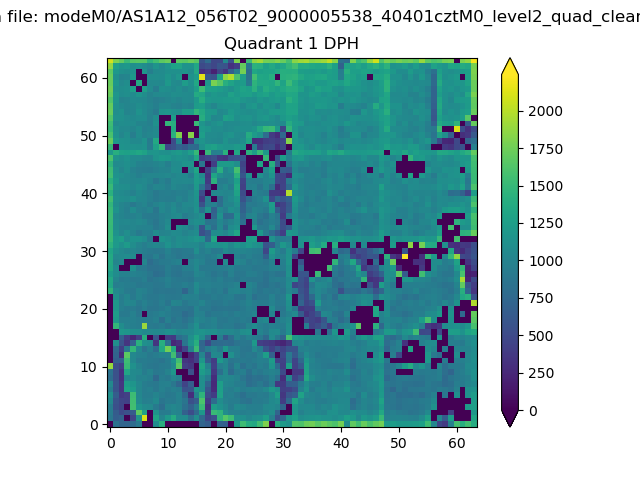 |
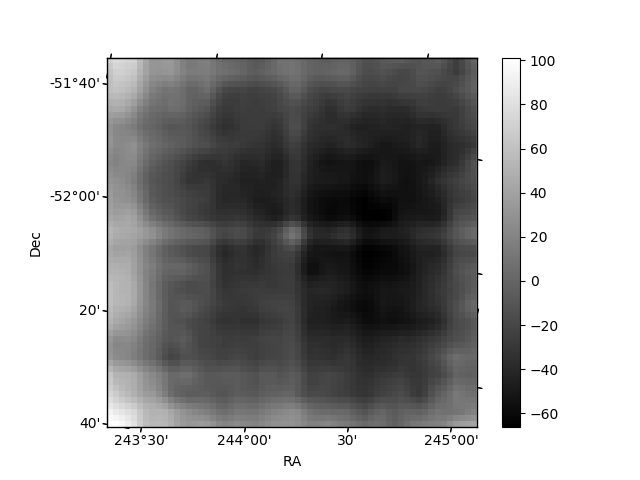
Quadrant B |
|---|---|---|---|
| Quadrant D | 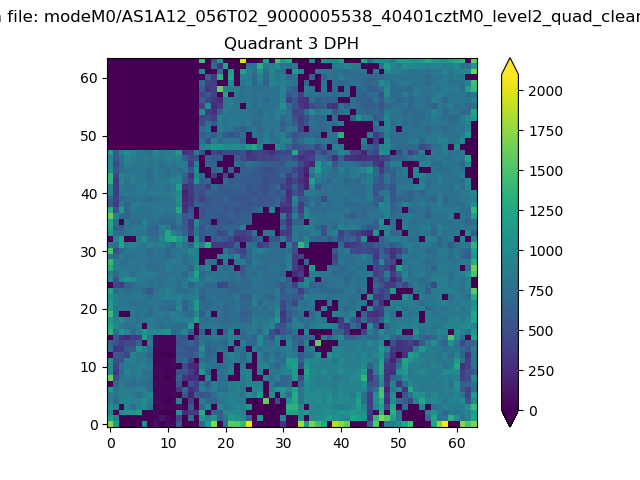 |
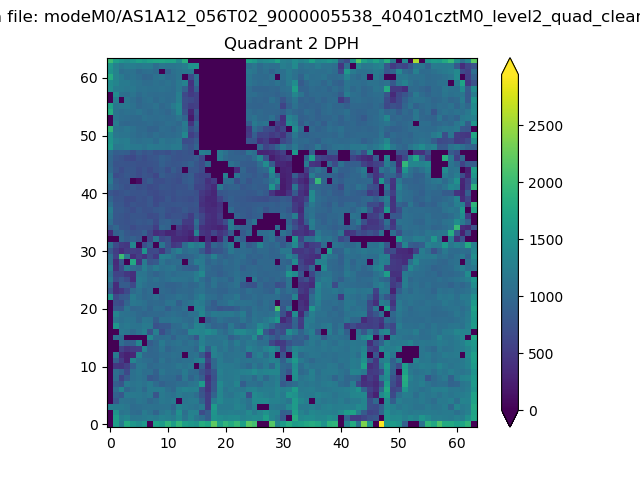 |
Quadrant C |
| Plot type | Count rate plots | Images |
|---|---|---|
| Comparison with Poisson distribution Blue bars denote a histogram of data divided into 1 sec bins. Red curve is a Poisson curve with rate = median count rate of data. |
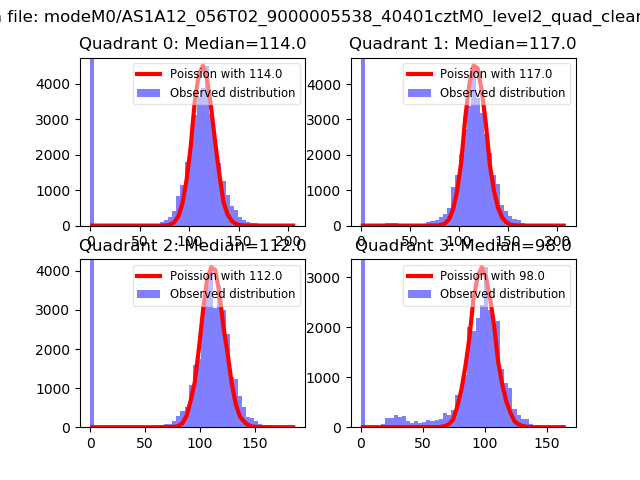 |
 |
| Quadrant-wise count rates Data is divided into 100 sec bins |
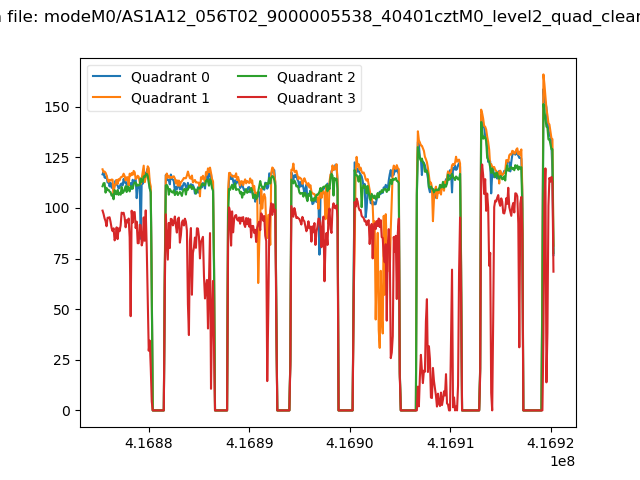 |
|
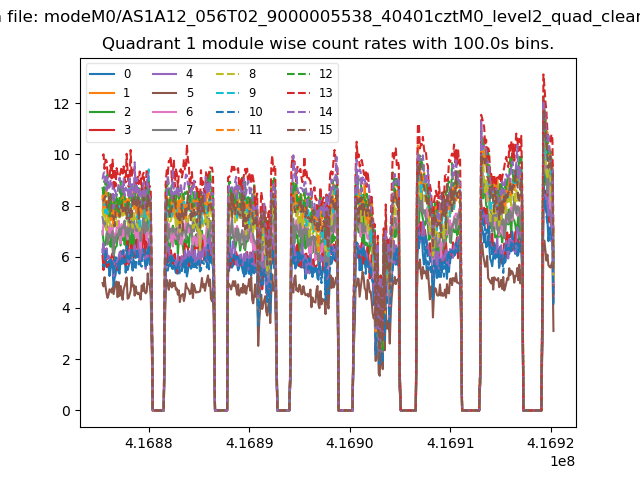
| Module-wise count rates for Quadrant A Data is divided into 100 sec bins |
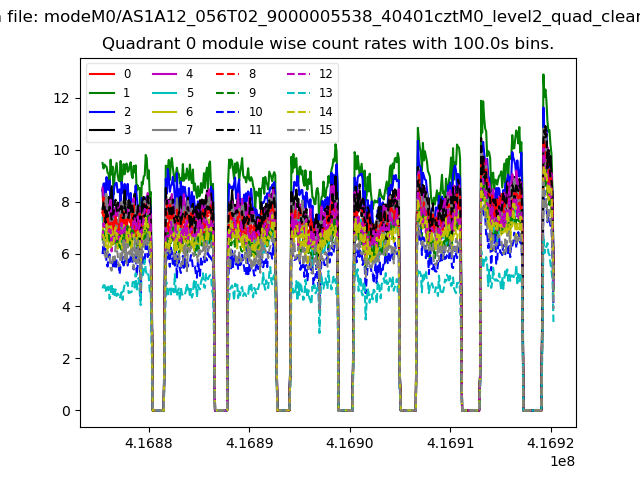 |
 |
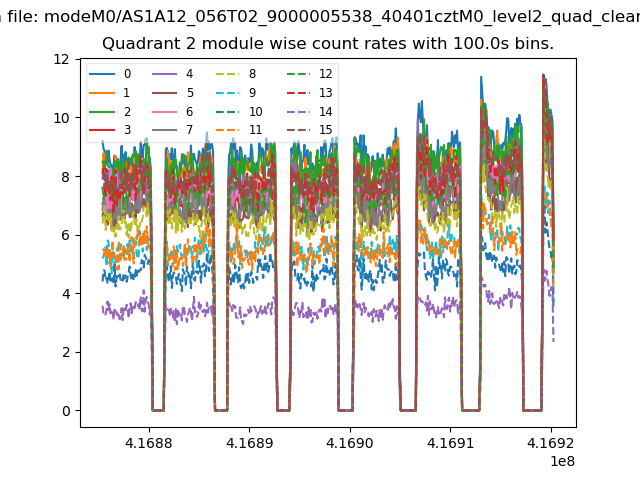
| Module-wise count rates for Quadrant B Data is divided into 100 sec bins |
 |
 |
| Module-wise count rates for Quadrant C Data is divided into 100 sec bins |
 |
 |
| Module-wise count rates for Quadrant D Data is divided into 100 sec bins |
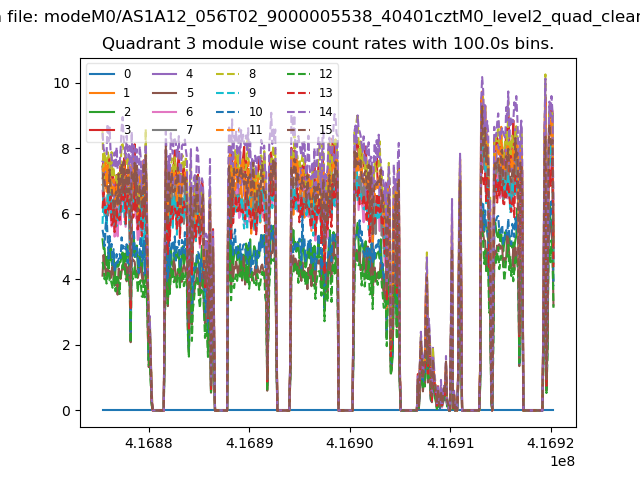 |
 |
| Parameter | Plot |
|---|---|
| CZT HV Monitor | 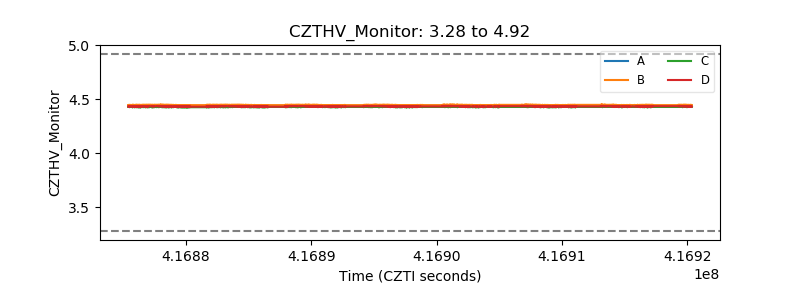 |
| D_VDD | 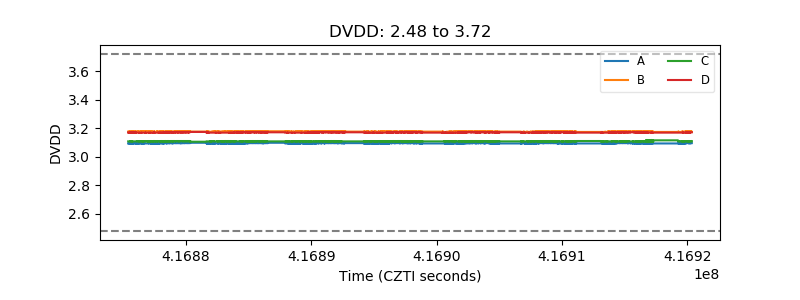 |
| Temperature 1 | 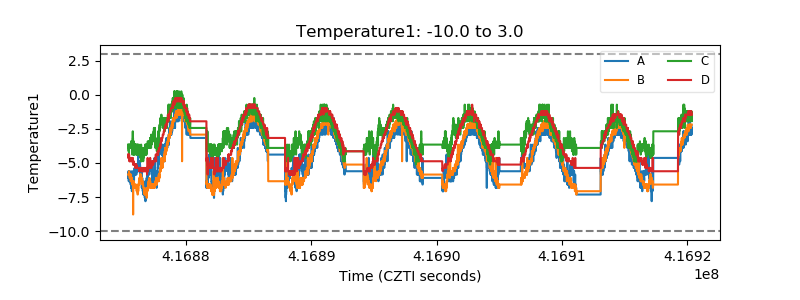 |
| Veto HV Monitor | 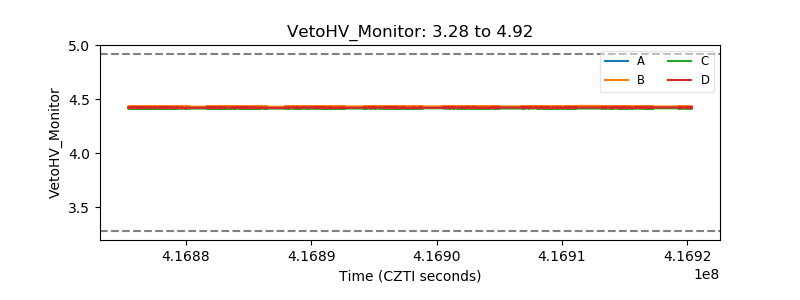 |
| Veto LLD | 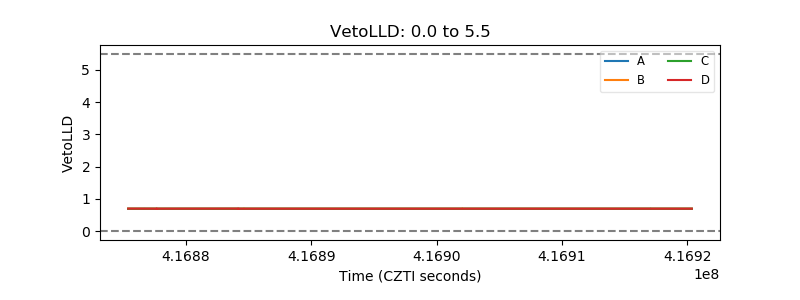 |
| Alpha Counter | 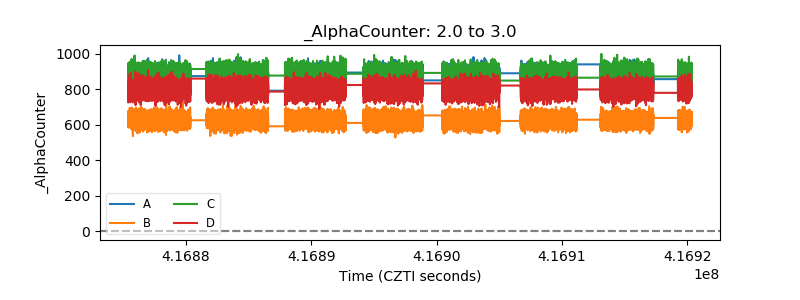 |
| _CPM_Rate | 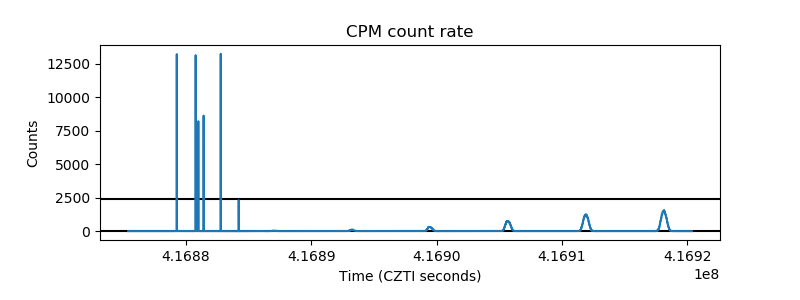 |
| CZT Counter | 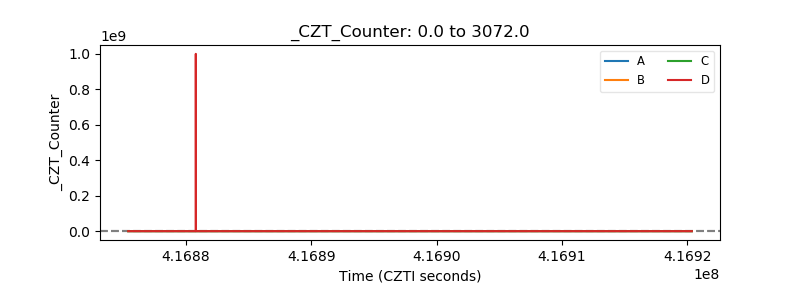 |
| +2.5 Volts monitor | 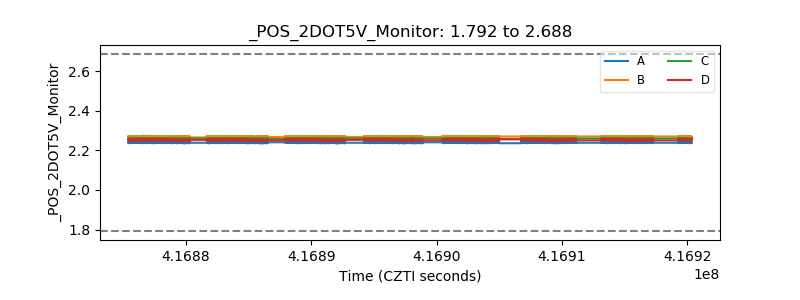 |
| +5 Volts monitor | 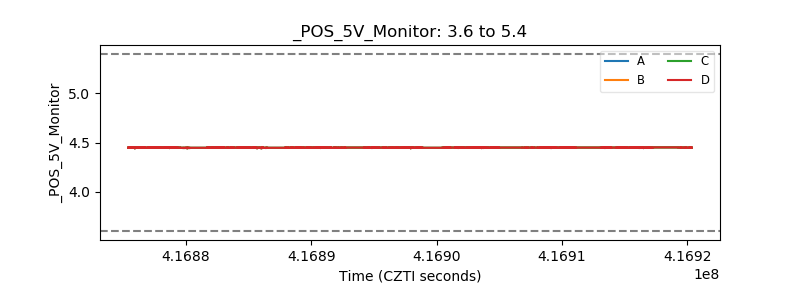 |
| _ROLL_ROT | 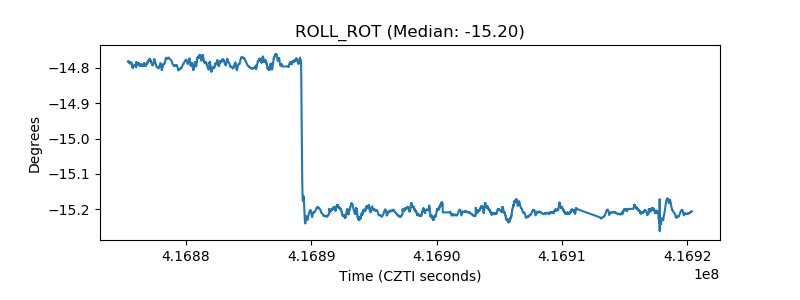 |
| _Roll_DEC | 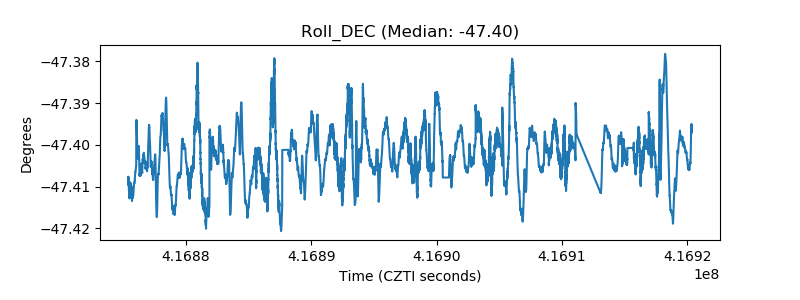 |
| _Roll_RA | 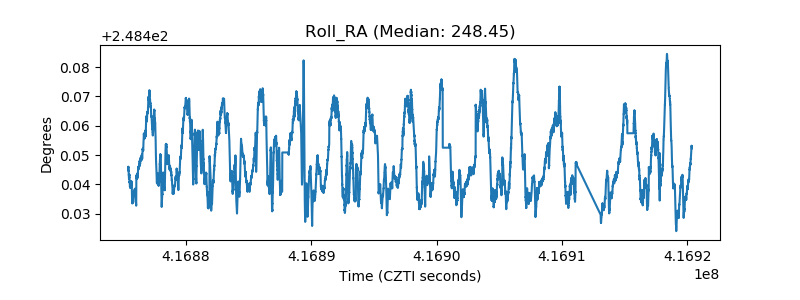 |
| Veto Counter | 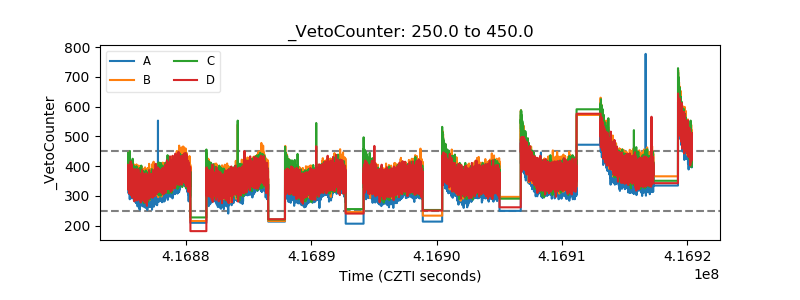 |