| Param | Original file | Final file |
|---|---|---|
| Filename | modeM0/AS1A12_056T02_9000005538_40402cztM0_level2.fits | modeM0/AS1A12_056T02_9000005538_40402cztM0_level2_quad_clean.evt |
| Size (bytes) | 367,208,640 | 95,584,320 |
| Size | 350.2 MB | 91.2 MB |
| Events in quadrant A | 3,369,266 | 693,751 |
| Events in quadrant B | 3,894,881 | 715,320 |
| Events in quadrant C | 2,824,185 | 679,737 |
| Events in quadrant D | 3,092,633 | 436,492 |
| Mode M0 | |||
|---|---|---|---|
| Quadrant | BADHDUFLAG | Total packets | Discarded packets |
| A | 0 | 13152 | 3 |
| B | 0 | 15438 | 2 |
| C | 0 | 11428 | 2 |
| D | 0 | 12785 | 2 |
| Mode M9 | |||
|---|---|---|---|
| Quadrant | BADHDUFLAG | Total packets | Discarded packets |
| A | 0 | 25 | 0 |
| B | 0 | 25 | 0 |
| C | 0 | 25 | 0 |
| D | 0 | 26 | 0 |
| Mode SS | |||
|---|---|---|---|
| Quadrant | BADHDUFLAG | Total packets | Discarded packets |
| A | 0 | 106 | 0 |
| B | 0 | 106 | 0 |
| C | 0 | 106 | 0 |
| D | 0 | 106 | 0 |
| Quadrant | Total seconds | Saturated seconds | Saturation percentage |
|---|---|---|---|
| A | 5276 | 125 | 2.369219% |
| B | 5276 | 40 | 0.758150% |
| C | 5276 | 21 | 0.398029% |
| D | 5276 | 1656 | 31.387415% |
Noise dominated data is calculated using 1-second bins in cleaned event files. If a bin has >2000 counts, and if more than 50% of those come from <1% of pixels, then it is considered to be noise-dominated and hence unusable.
| Quadrant | # 1 sec bins | Bins with >0 counts | Bins with >2000 counts | High rate bins dominated by noise | Noise dominated (total time) | Noise dominated (detector-on time) | Marked lightcurve |
|---|---|---|---|---|---|---|---|
| A | 7337 | 5277 | 78 | 78 | 1.06% | 1.48% | 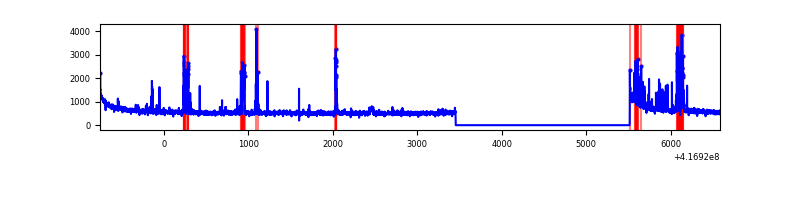 |
| B | 7337 | 5277 | 24 | 24 | 0.33% | 0.45% | 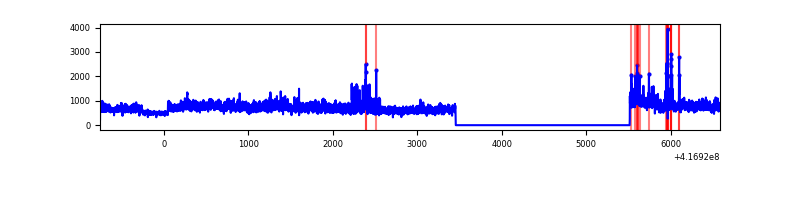 |
| C | 7337 | 5277 | 10 | 10 | 0.14% | 0.19% | 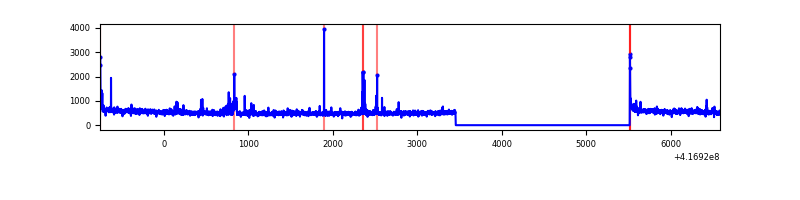 |
| D | 7337 | 5277 | 142 | 142 | 1.94% | 2.69% | 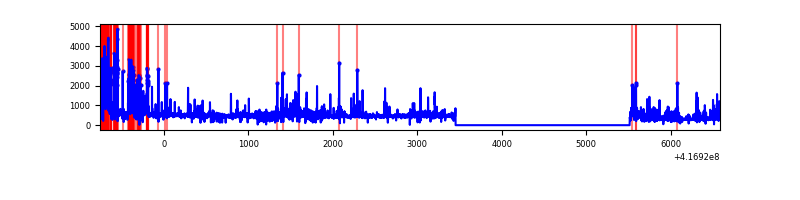 |
Top three noisy pixels from each quadrant. If the there are fewer than three noisy pixels in the level2.evt file, extra rows are filled as -1
| Pixel properties | Quadrant properties | ||||||
|---|---|---|---|---|---|---|---|
| Quadrant | DetID | PixID | Counts | Sigma | Mean | Median | Sigma |
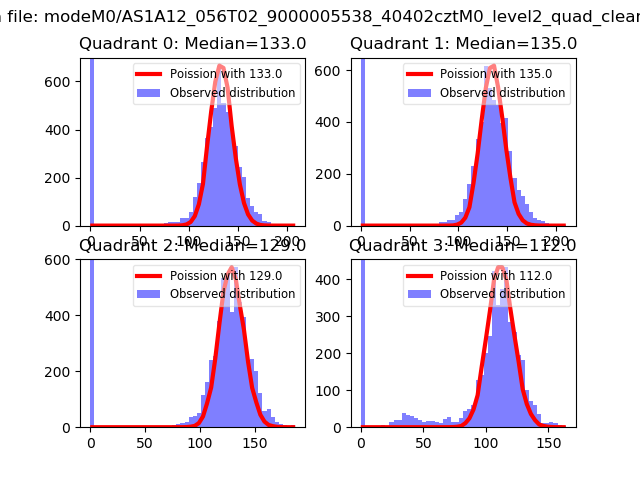
| A | 10 | 83 | 478598 | 3674.42 | 645 | 635 | 130.1 |
| A | 13 | 248 | 369892 | 2838.72 | 645 | 635 | 130.1 |
| A | 9 | 143 | 18681 | 138.73 | 645 | 635 | 130.1 |
| B | 7 | 202 | 1193271 | 9965.66 | 636 | 621 | 119.7 |
| B | 4 | 170 | 164809 | 1371.94 | 636 | 621 | 119.7 |
| B | 0 | 230 | 27352 | 223.36 | 636 | 621 | 119.7 |
| C | 15 | 214 | 229270 | 1600.54 | 623 | 628 | 142.9 |
| C | 9 | 54 | 99256 | 690.42 | 623 | 628 | 142.9 |
| C | 12 | 249 | 25389 | 173.33 | 623 | 628 | 142.9 |
| D | 12 | 227 | 467152 | 3804.04 | 497 | 484 | 122.7 |
| D | 12 | 191 | 306012 | 2490.51 | 497 | 484 | 122.7 |
| D | 13 | 171 | 79740 | 646.06 | 497 | 484 | 122.7 |
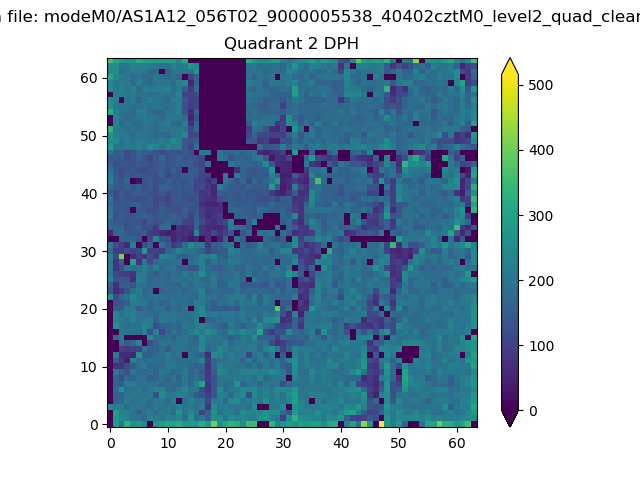
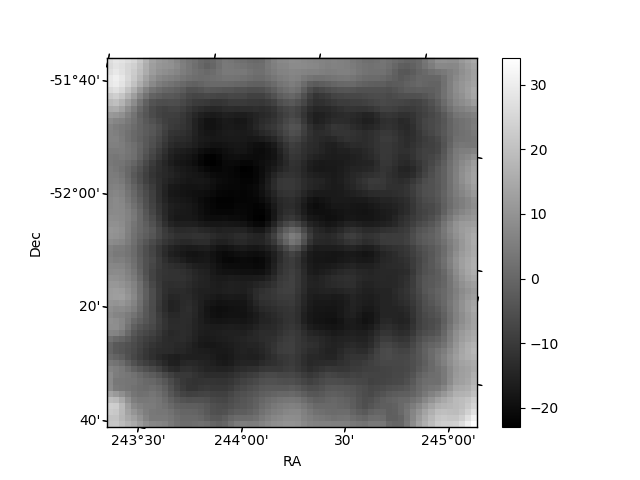
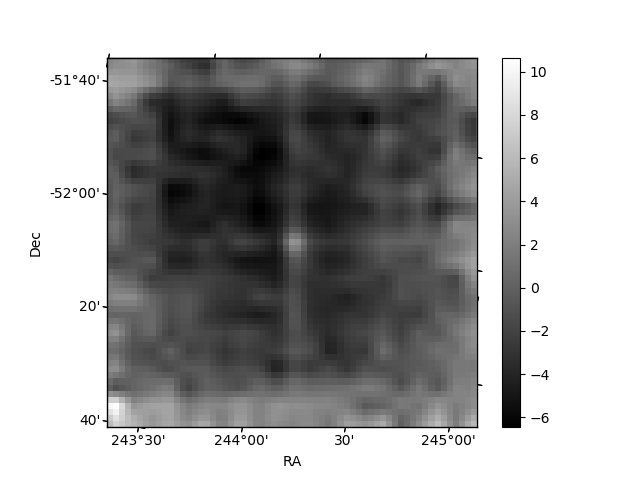
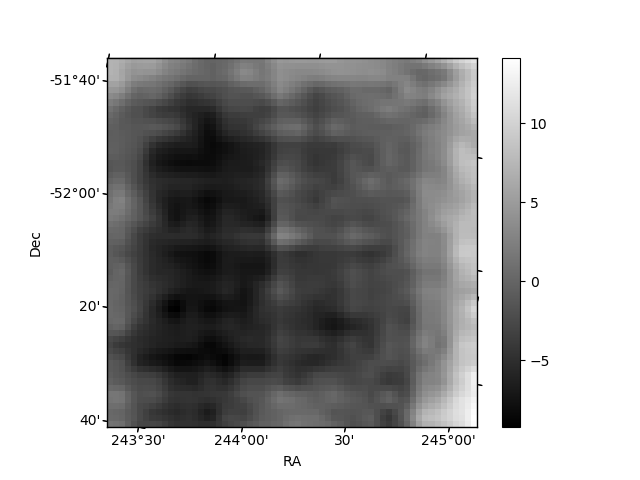
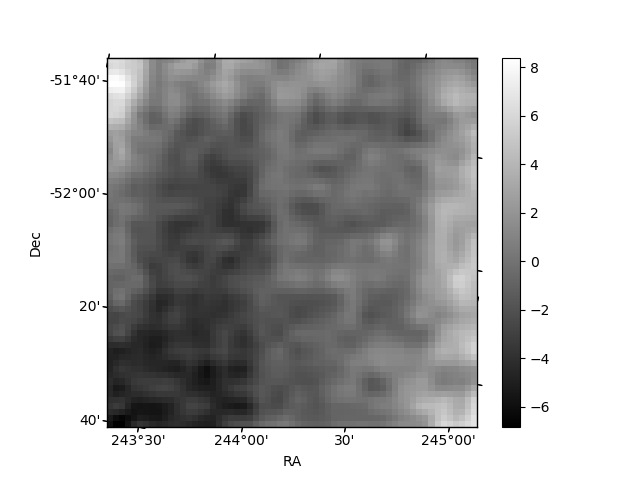
Histogram calculated using DETX and DETY for each event in the final _common_clean file
| Quadrant A | 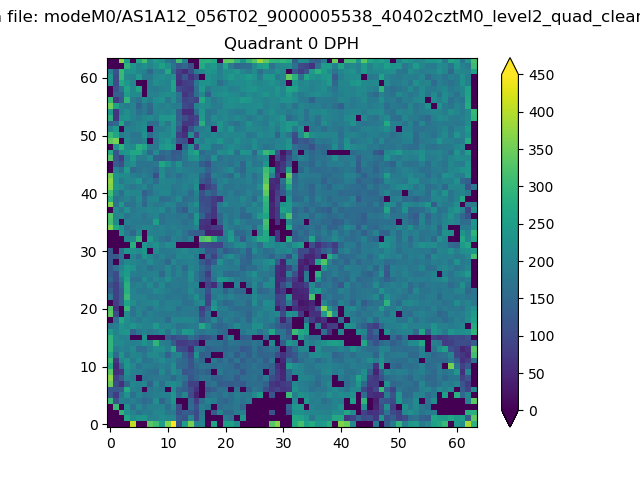 |
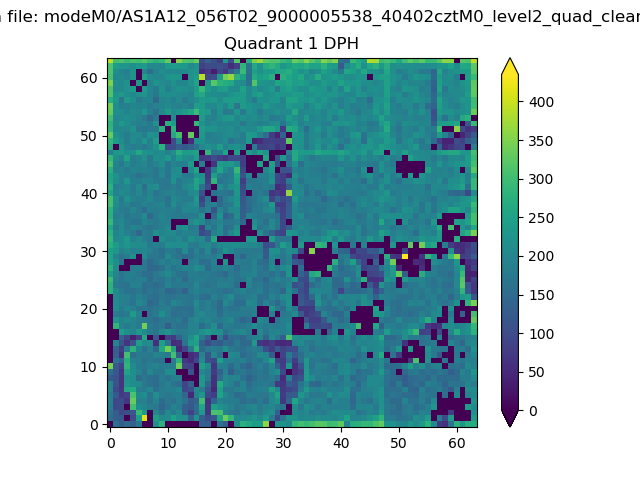 |
Quadrant B |
|---|---|---|---|
| Quadrant D | 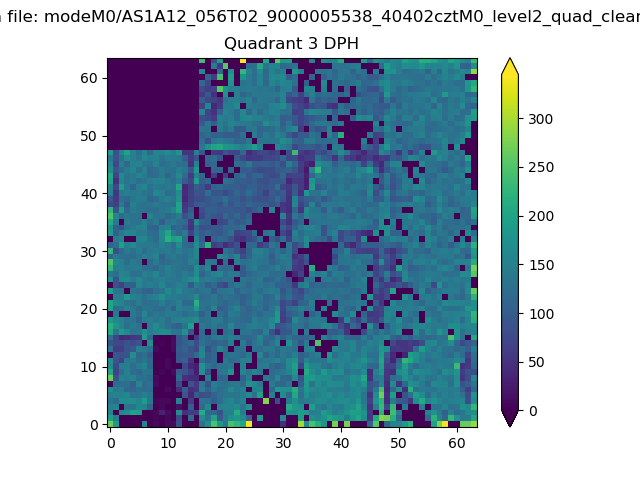 |
 |
Quadrant C |
| Plot type | Count rate plots | Images |
|---|---|---|
| Comparison with Poisson distribution Blue bars denote a histogram of data divided into 1 sec bins. Red curve is a Poisson curve with rate = median count rate of data. |
 |
 |
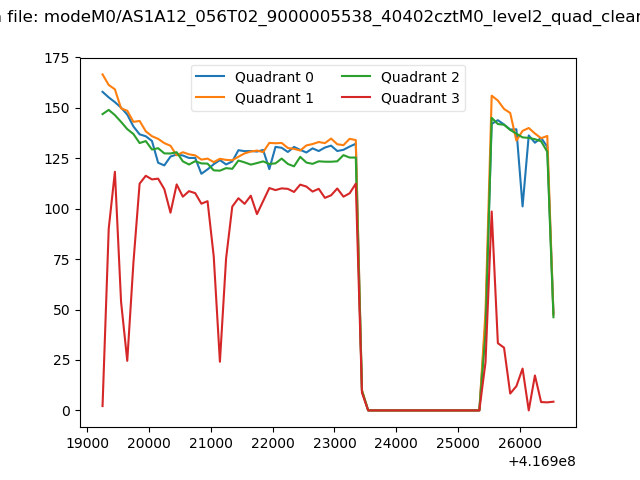
| Quadrant-wise count rates Data is divided into 100 sec bins |
 |
|
| Module-wise count rates for Quadrant A Data is divided into 100 sec bins |
 |
 |
| Module-wise count rates for Quadrant B Data is divided into 100 sec bins |
 |
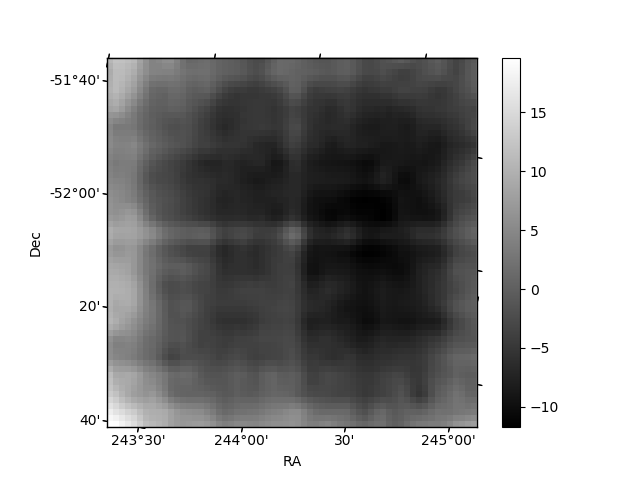 |
| Module-wise count rates for Quadrant C Data is divided into 100 sec bins |
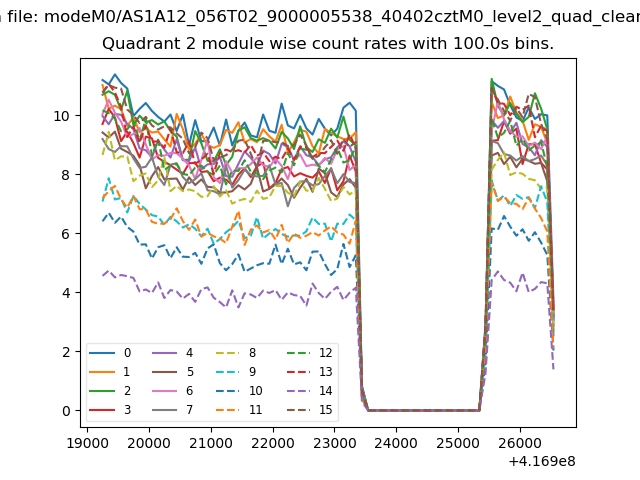 |
 |
| Module-wise count rates for Quadrant D Data is divided into 100 sec bins |
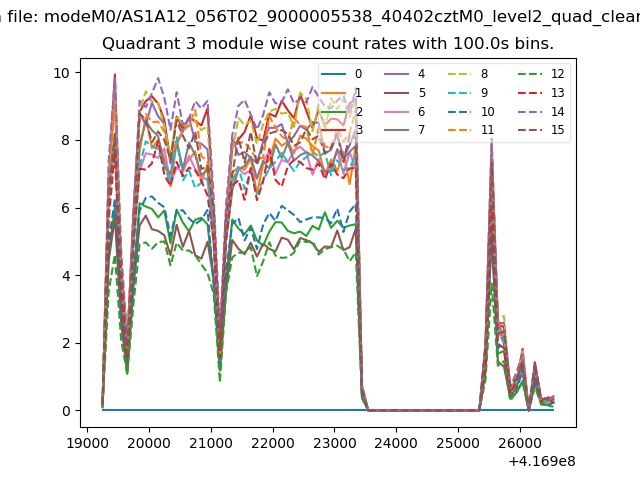 |
 |
| Parameter | Plot |
|---|---|
| CZT HV Monitor |  |
| D_VDD | 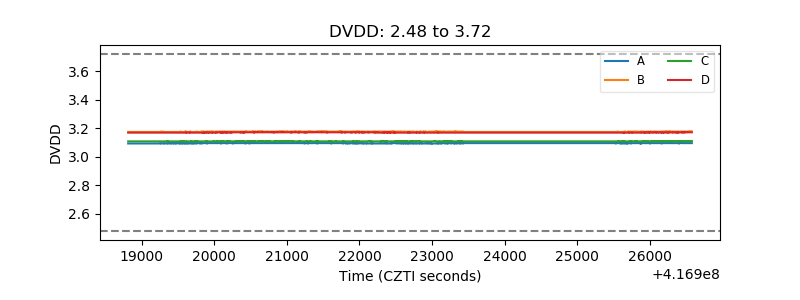 |
| Temperature 1 | 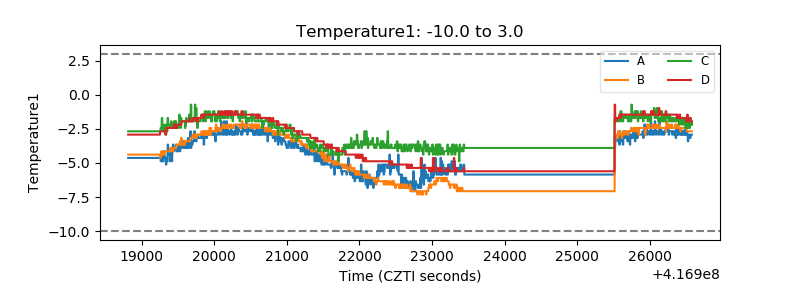 |
| Veto HV Monitor | 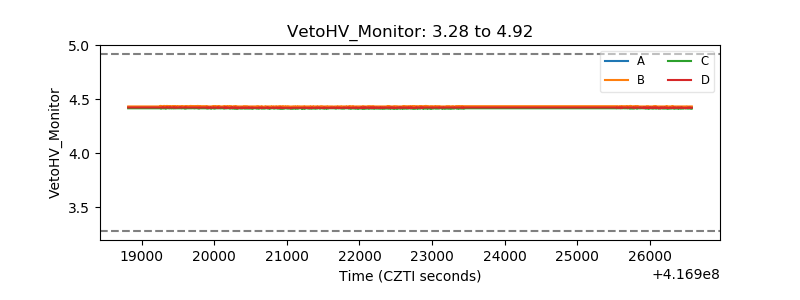 |
| Veto LLD | 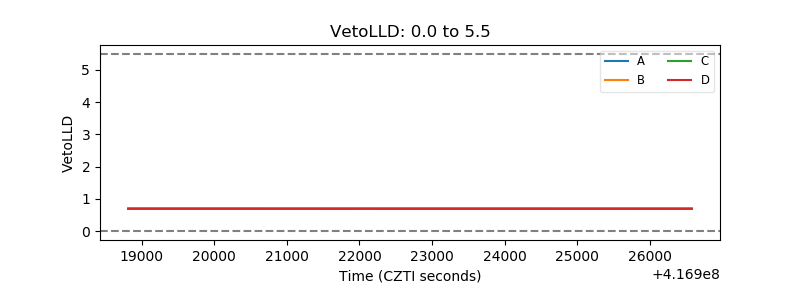 |
| Alpha Counter | 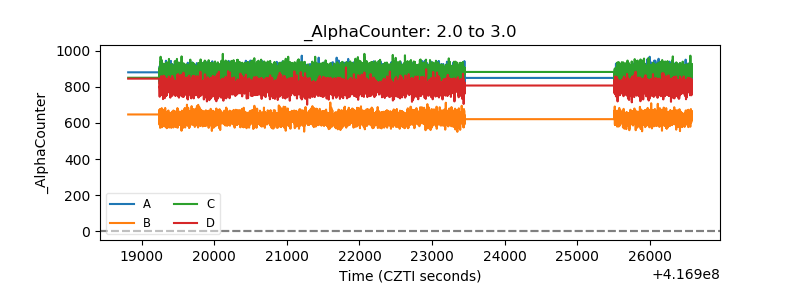 |
| _CPM_Rate | 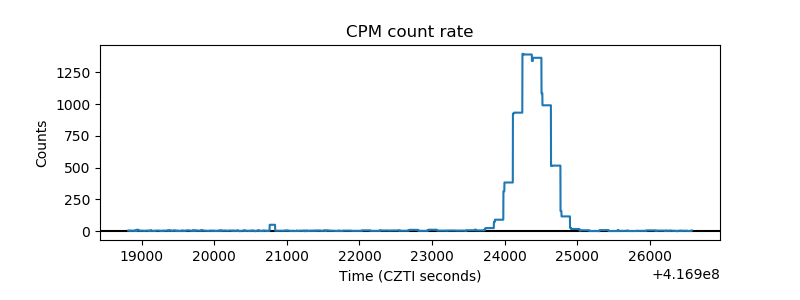 |
| CZT Counter | 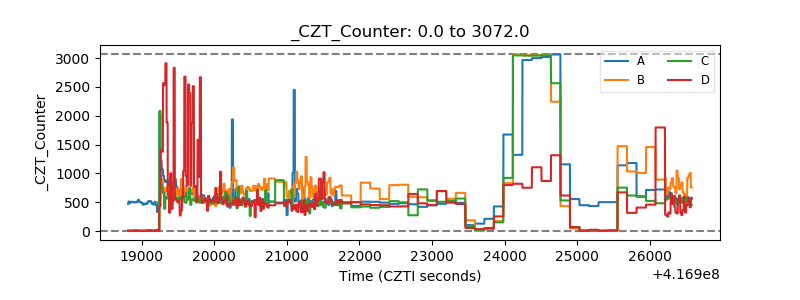 |
| +2.5 Volts monitor | 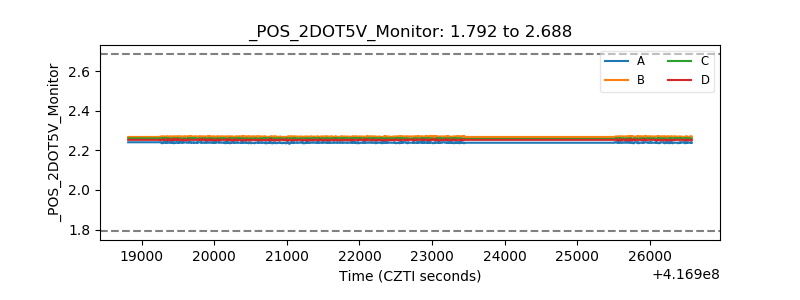 |
| +5 Volts monitor | 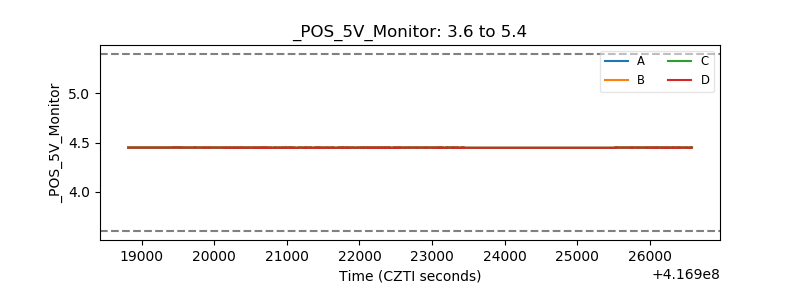 |
| _ROLL_ROT | 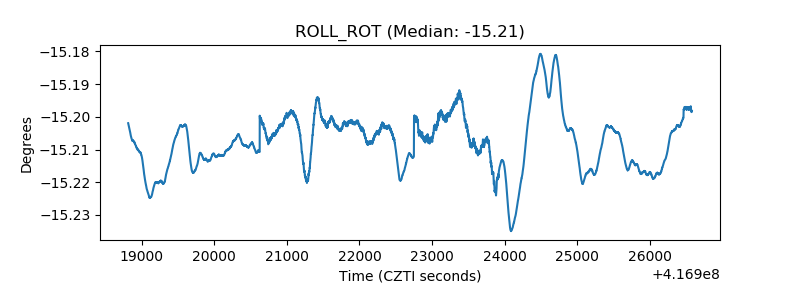 |
| _Roll_DEC | 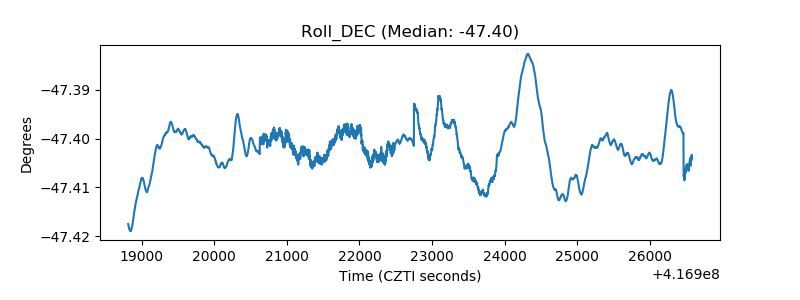 |
| _Roll_RA | 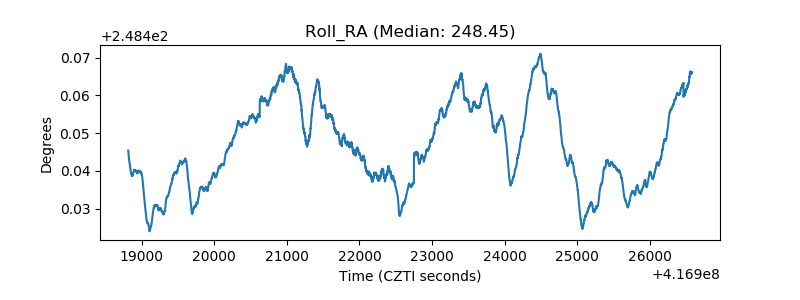 |
| Veto Counter | 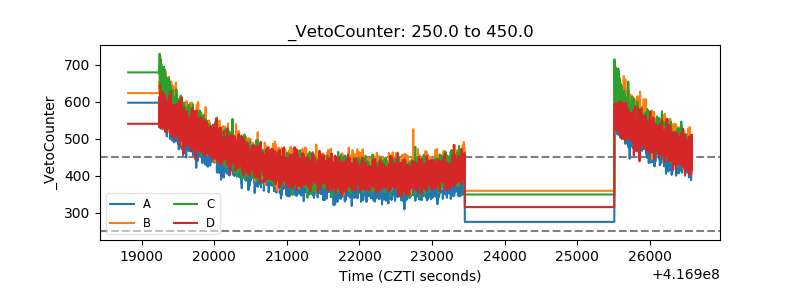 |