| Param | Original file | Final file |
|---|---|---|
| Filename | modeM0/AS1A12_056T02_9000005538_40403cztM0_level2.fits | modeM0/AS1A12_056T02_9000005538_40403cztM0_level2_quad_clean.evt |
| Size (bytes) | 383,181,120 | 93,121,920 |
| Size | 365.4 MB | 88.8 MB |
| Events in quadrant A | 3,475,536 | 673,367 |
| Events in quadrant B | 4,145,355 | 696,019 |
| Events in quadrant C | 2,818,944 | 660,605 |
| Events in quadrant D | 3,338,841 | 425,938 |
| Mode M0 | |||
|---|---|---|---|
| Quadrant | BADHDUFLAG | Total packets | Discarded packets |
| A | 0 | 13408 | 3 |
| B | 0 | 16076 | 2 |
| C | 0 | 11417 | 2 |
| D | 0 | 13527 | 2 |
| Mode M9 | |||
|---|---|---|---|
| Quadrant | BADHDUFLAG | Total packets | Discarded packets |
| A | 0 | 30 | 0 |
| B | 0 | 30 | 0 |
| C | 0 | 30 | 0 |
| D | 0 | 31 | 0 |
| Mode SS | |||
|---|---|---|---|
| Quadrant | BADHDUFLAG | Total packets | Discarded packets |
| A | 0 | 106 | 0 |
| B | 0 | 106 | 0 |
| C | 0 | 106 | 0 |
| D | 0 | 106 | 0 |
| Quadrant | Total seconds | Saturated seconds | Saturation percentage |
|---|---|---|---|
| A | 5194 | 182 | 3.504043% |
| B | 5194 | 112 | 2.156334% |
| C | 5194 | 20 | 0.385060% |
| D | 5194 | 1679 | 32.325760% |
Noise dominated data is calculated using 1-second bins in cleaned event files. If a bin has >2000 counts, and if more than 50% of those come from <1% of pixels, then it is considered to be noise-dominated and hence unusable.
| Quadrant | # 1 sec bins | Bins with >0 counts | Bins with >2000 counts | High rate bins dominated by noise | Noise dominated (total time) | Noise dominated (detector-on time) | Marked lightcurve |
|---|---|---|---|---|---|---|---|
| A | 7316 | 5195 | 112 | 112 | 1.53% | 2.16% | 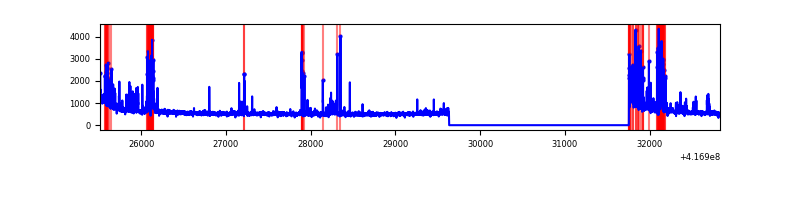 |
| B | 7316 | 5195 | 57 | 57 | 0.78% | 1.10% | 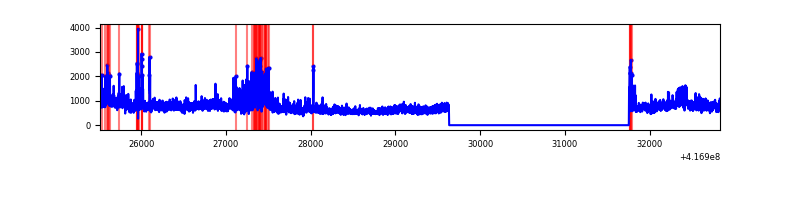 |
| C | 7316 | 5195 | 10 | 10 | 0.14% | 0.19% | 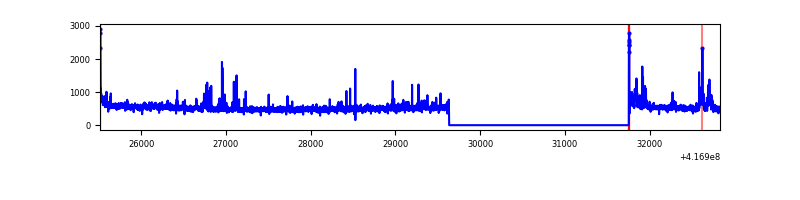 |
| D | 7316 | 5195 | 96 | 96 | 1.31% | 1.85% | 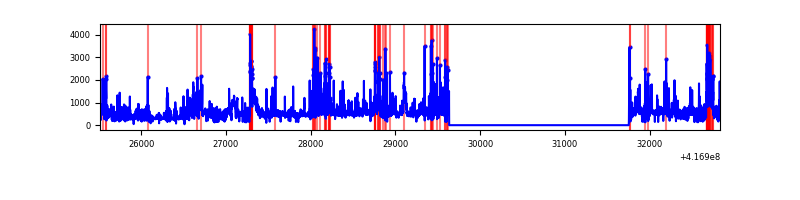 |
Top three noisy pixels from each quadrant. If the there are fewer than three noisy pixels in the level2.evt file, extra rows are filled as -1
| Pixel properties | Quadrant properties | ||||||
|---|---|---|---|---|---|---|---|
| Quadrant | DetID | PixID | Counts | Sigma | Mean | Median | Sigma |
| A | 13 | 248 | 520539 | 4152.96 | 623 | 613 | 125.2 |
| A | 10 | 83 | 473503 | 3777.26 | 623 | 613 | 125.2 |
| A | 2 | 79 | 40540 | 318.92 | 623 | 613 | 125.2 |
| B | 7 | 202 | 1276487 | 10846.22 | 621 | 606 | 117.6 |
| B | 4 | 170 | 383204 | 3252.45 | 621 | 606 | 117.6 |
| B | 0 | 230 | 39608 | 331.55 | 621 | 606 | 117.6 |
| C | 15 | 214 | 225375 | 1614.11 | 606 | 612 | 139.2 |
| C | 9 | 54 | 168114 | 1202.9 | 606 | 612 | 139.2 |
| C | 3 | 233 | 24946 | 174.75 | 606 | 612 | 139.2 |
| D | 12 | 227 | 383590 | 3221.98 | 485 | 472 | 118.9 |
| D | 12 | 191 | 319524 | 2683.19 | 485 | 472 | 118.9 |
| D | 13 | 171 | 258420 | 2169.31 | 485 | 472 | 118.9 |
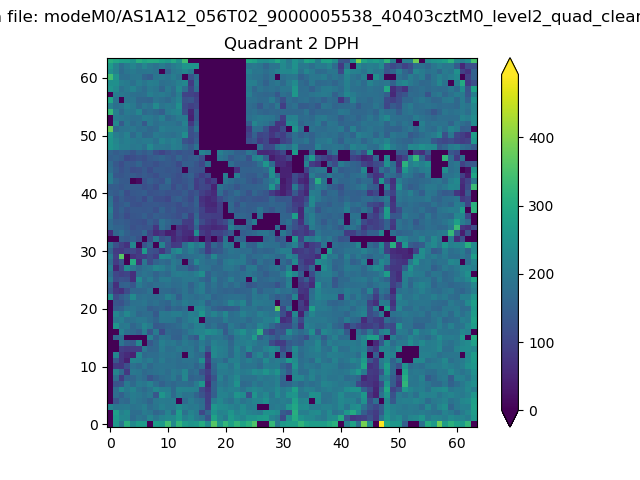
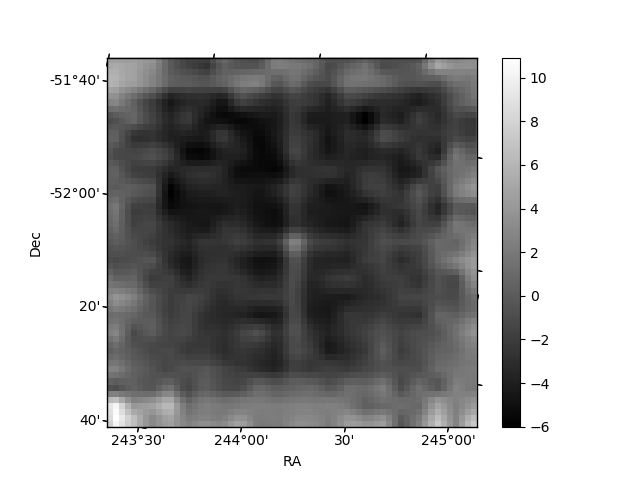
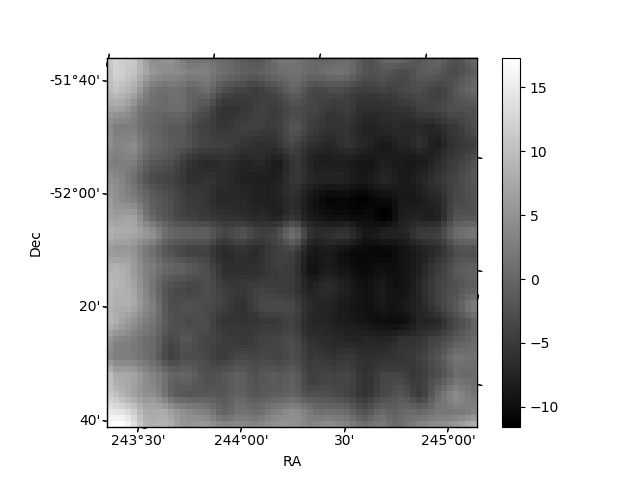
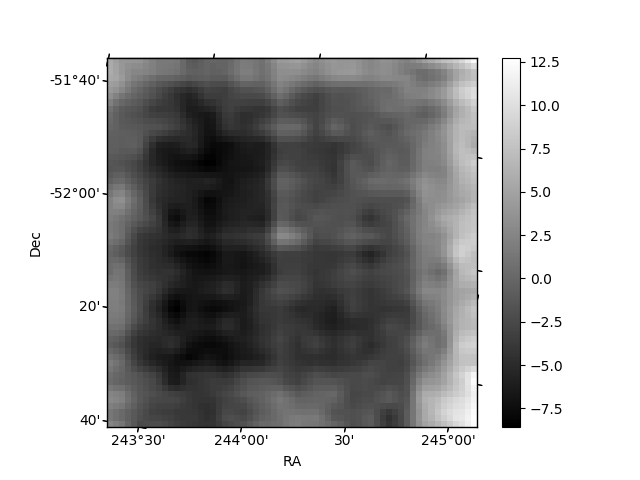
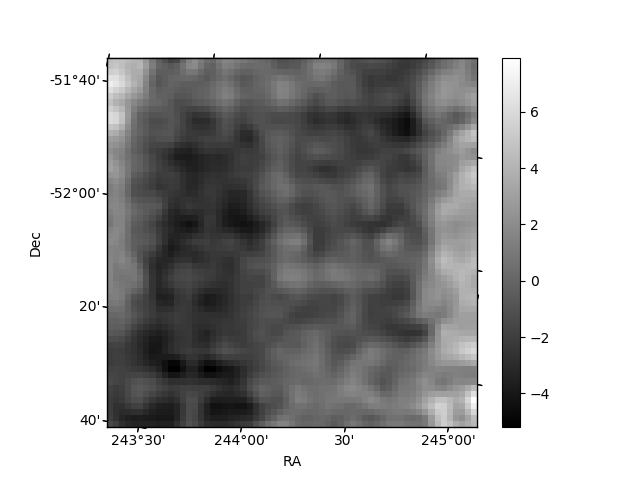
Histogram calculated using DETX and DETY for each event in the final _common_clean file
| Quadrant A | 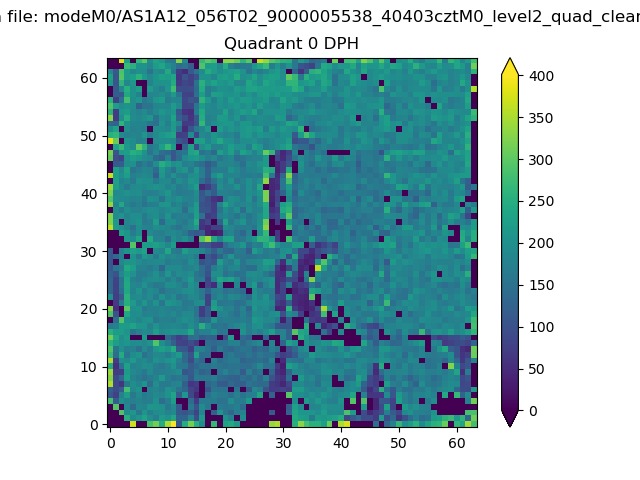 |
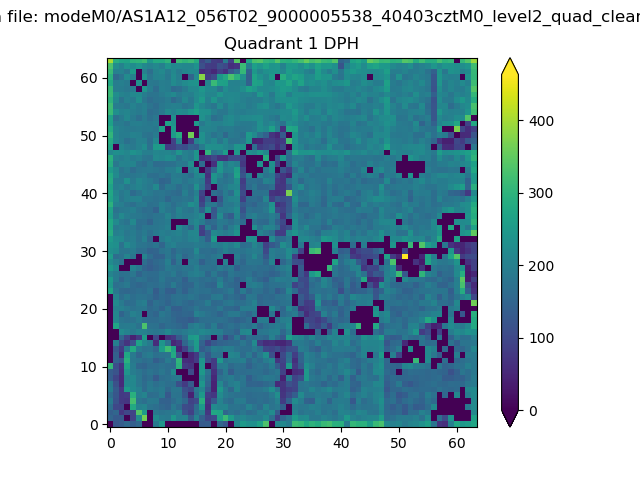 |
Quadrant B |
|---|---|---|---|
| Quadrant D | 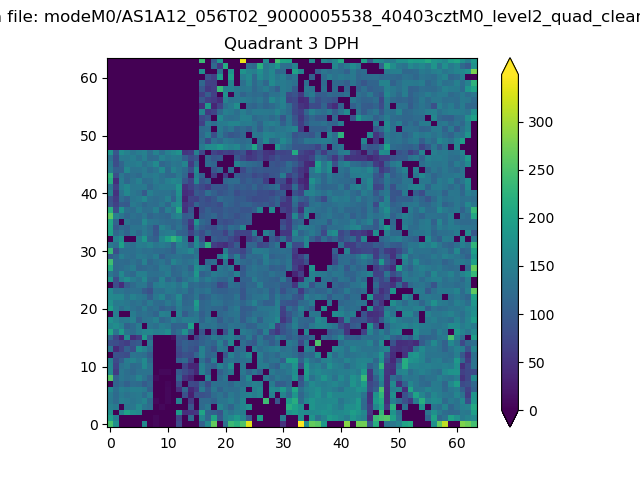 |
 |
Quadrant C |
| Plot type | Count rate plots | Images |
|---|---|---|
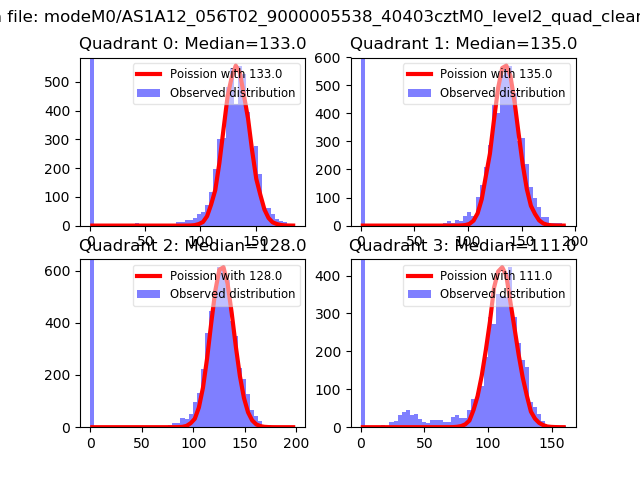
| Comparison with Poisson distribution Blue bars denote a histogram of data divided into 1 sec bins. Red curve is a Poisson curve with rate = median count rate of data. |
 |
 |
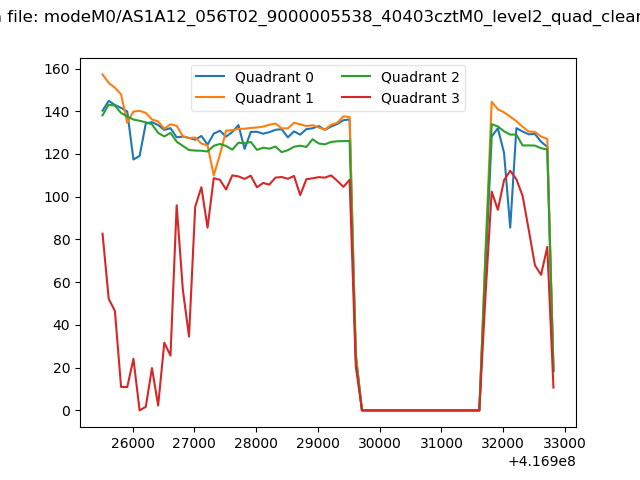
| Quadrant-wise count rates Data is divided into 100 sec bins |
 |
|
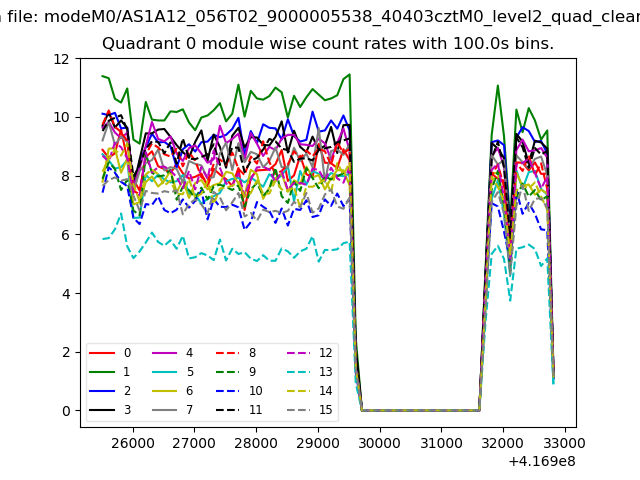
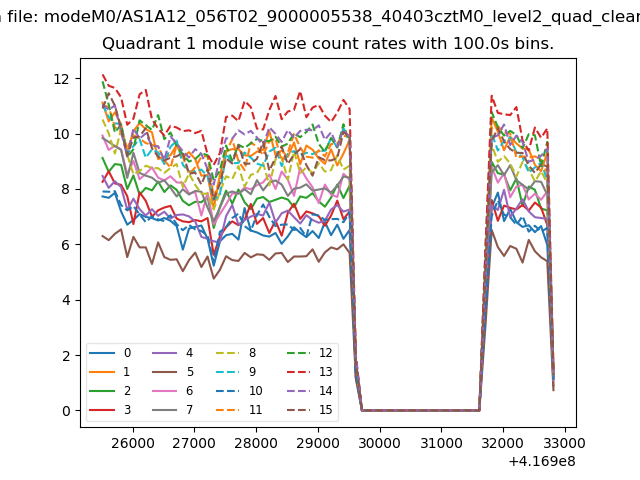
| Module-wise count rates for Quadrant A Data is divided into 100 sec bins |
 |
 |
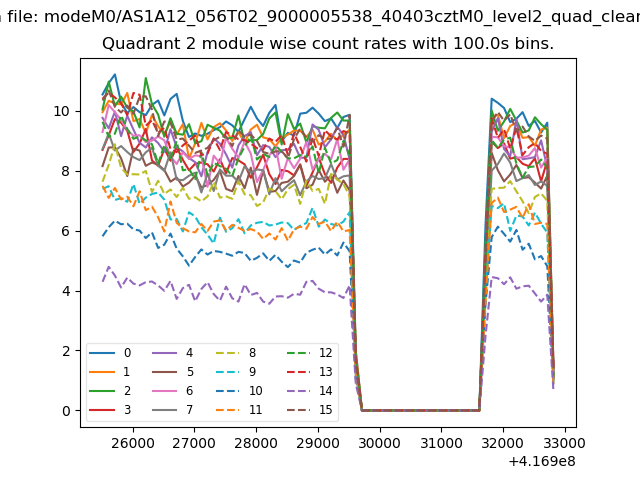
| Module-wise count rates for Quadrant B Data is divided into 100 sec bins |
 |
 |
| Module-wise count rates for Quadrant C Data is divided into 100 sec bins |
 |
 |
| Module-wise count rates for Quadrant D Data is divided into 100 sec bins |
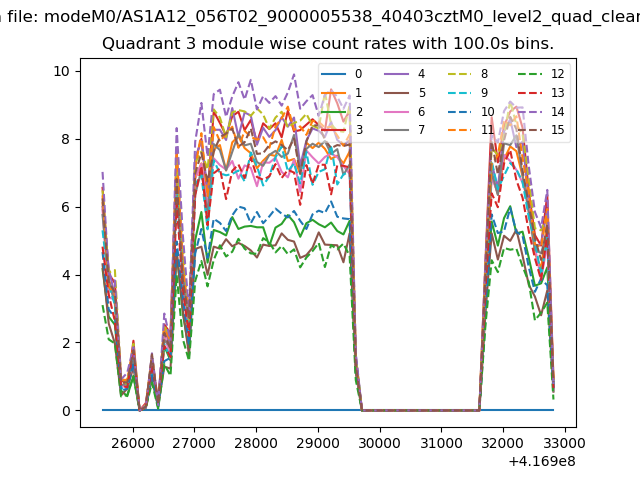 |
 |
| Parameter | Plot |
|---|---|
| CZT HV Monitor | 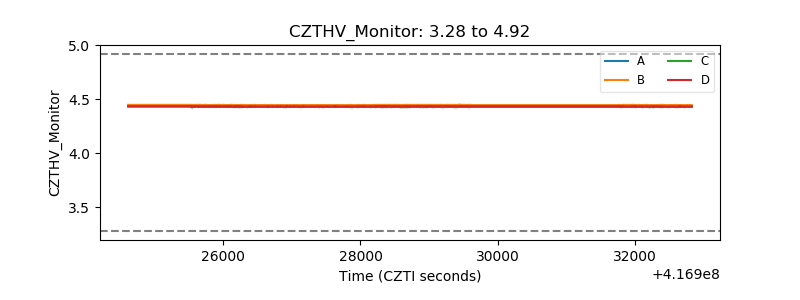 |
| D_VDD | 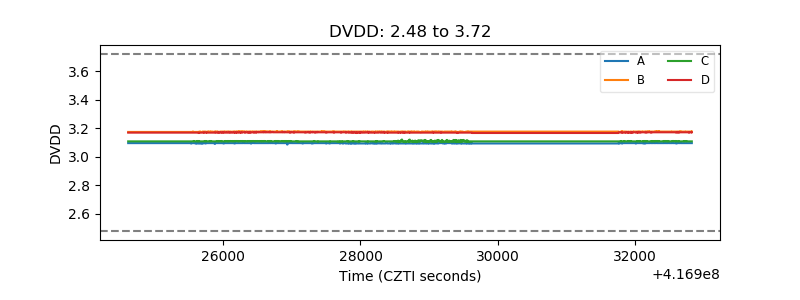 |
| Temperature 1 | 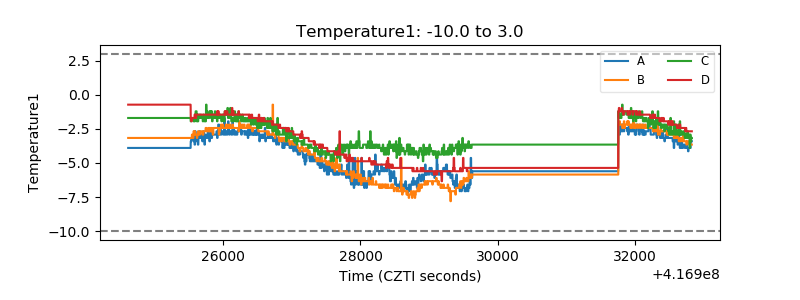 |
| Veto HV Monitor | 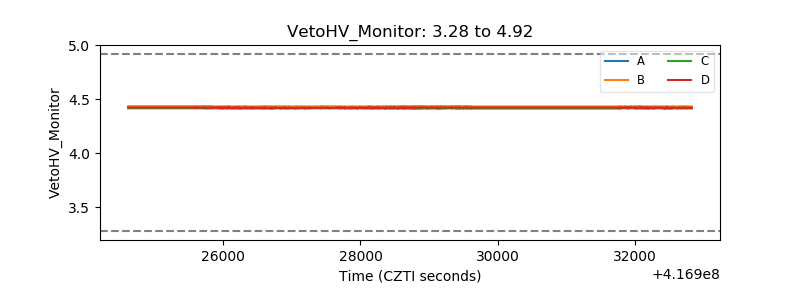 |
| Veto LLD | 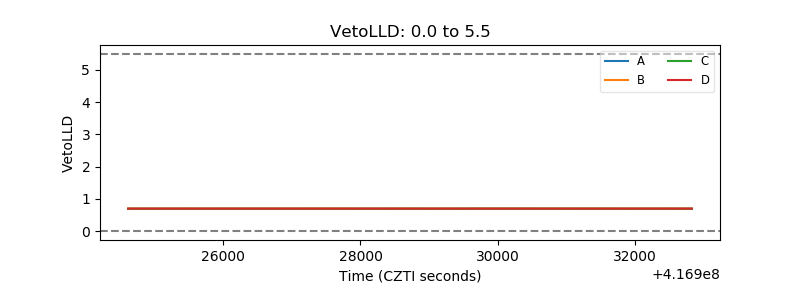 |
| Alpha Counter | 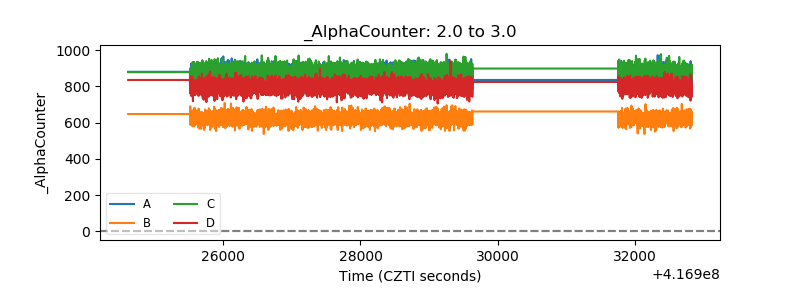 |
| _CPM_Rate | 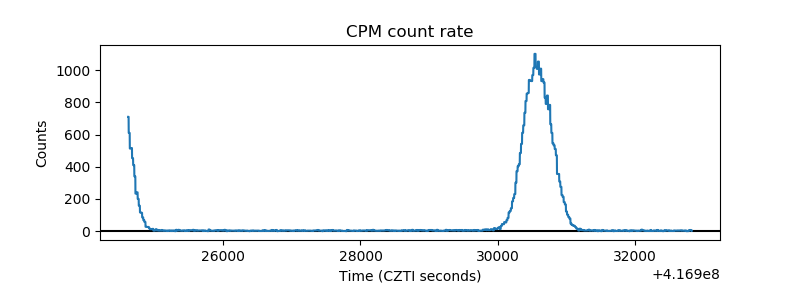 |
| CZT Counter | 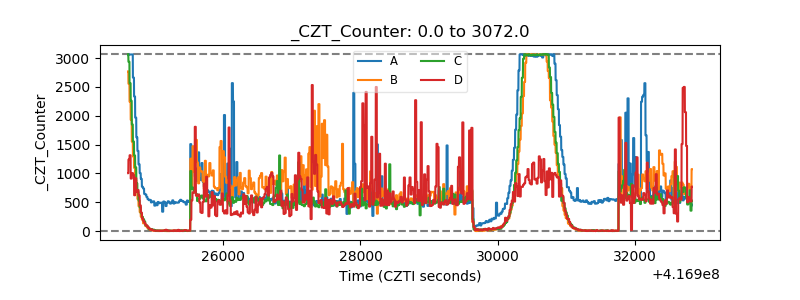 |
| +2.5 Volts monitor |  |
| +5 Volts monitor | 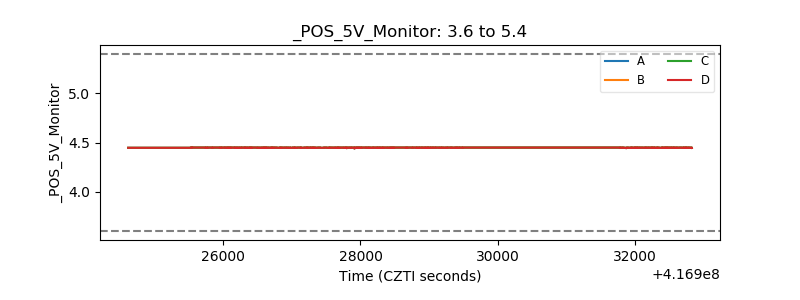 |
| _ROLL_ROT | 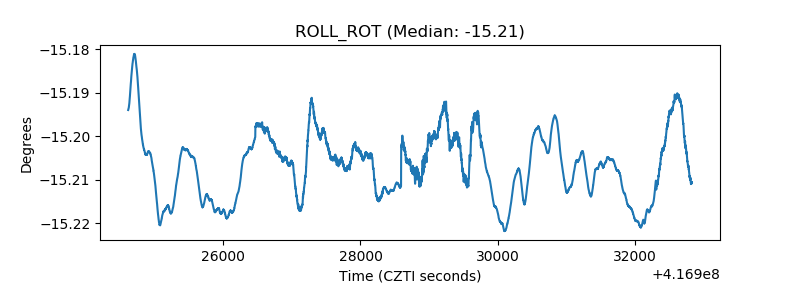 |
| _Roll_DEC | 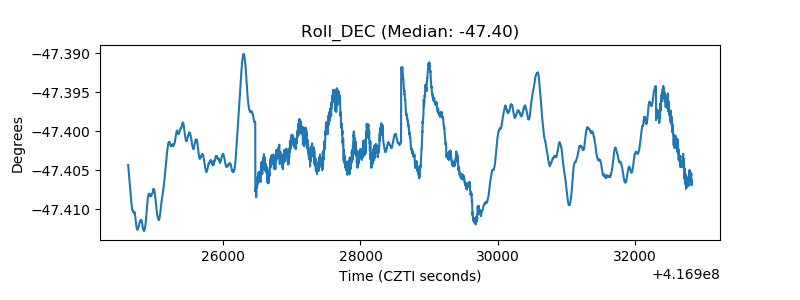 |
| _Roll_RA | 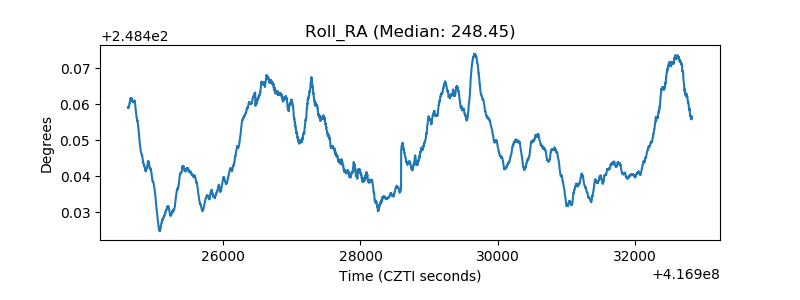 |
| Veto Counter | 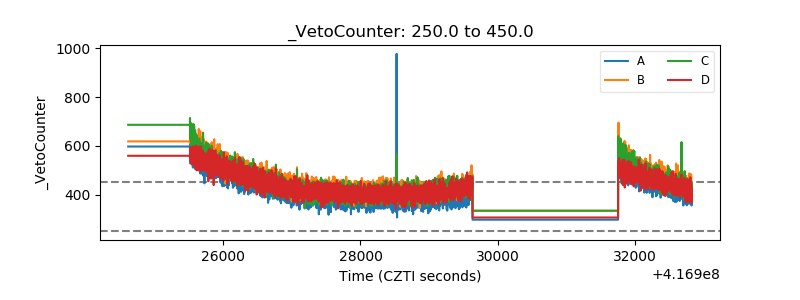 |