| Param | Original file | Final file |
|---|---|---|
| Filename | modeM0/AS1A12_056T02_9000005538_40404cztM0_level2.fits | modeM0/AS1A12_056T02_9000005538_40404cztM0_level2_quad_clean.evt |
| Size (bytes) | 339,137,280 | 90,322,560 |
| Size | 323.4 MB | 86.1 MB |
| Events in quadrant A | 3,263,470 | 630,715 |
| Events in quadrant B | 2,974,961 | 655,495 |
| Events in quadrant C | 2,644,037 | 618,385 |
| Events in quadrant D | 3,274,212 | 474,493 |
| Mode M0 | |||
|---|---|---|---|
| Quadrant | BADHDUFLAG | Total packets | Discarded packets |
| A | 0 | 12738 | 3 |
| B | 0 | 12244 | 2 |
| C | 0 | 10887 | 2 |
| D | 0 | 13153 | 2 |
| Mode M9 | |||
|---|---|---|---|
| Quadrant | BADHDUFLAG | Total packets | Discarded packets |
| A | 0 | 22 | 0 |
| B | 0 | 22 | 0 |
| C | 0 | 22 | 0 |
| D | 0 | 23 | 0 |
| Mode SS | |||
|---|---|---|---|
| Quadrant | BADHDUFLAG | Total packets | Discarded packets |
| A | 0 | 102 | 0 |
| B | 0 | 102 | 0 |
| C | 0 | 102 | 0 |
| D | 0 | 102 | 0 |
| Quadrant | Total seconds | Saturated seconds | Saturation percentage |
|---|---|---|---|
| A | 5085 | 162 | 3.185841% |
| B | 5085 | 28 | 0.550639% |
| C | 5085 | 18 | 0.353982% |
| D | 5085 | 1061 | 20.865290% |
Noise dominated data is calculated using 1-second bins in cleaned event files. If a bin has >2000 counts, and if more than 50% of those come from <1% of pixels, then it is considered to be noise-dominated and hence unusable.
| Quadrant | # 1 sec bins | Bins with >0 counts | Bins with >2000 counts | High rate bins dominated by noise | Noise dominated (total time) | Noise dominated (detector-on time) | Marked lightcurve |
|---|---|---|---|---|---|---|---|
| A | 7206 | 5086 | 102 | 102 | 1.42% | 2.01% | 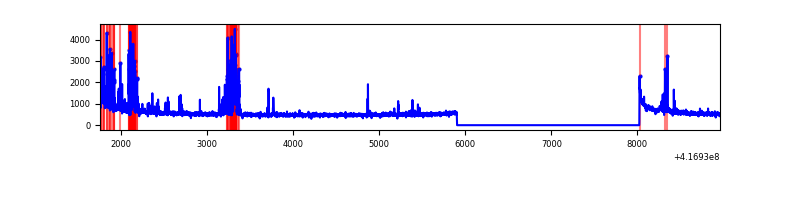 |
| B | 7206 | 5086 | 9 | 9 | 0.12% | 0.18% | 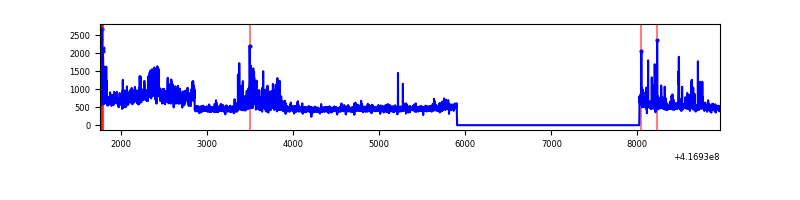 |
| C | 7206 | 5086 | 14 | 14 | 0.19% | 0.28% | 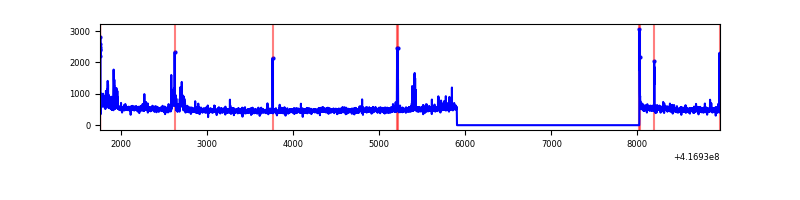 |
| D | 7206 | 5086 | 72 | 72 | 1.00% | 1.42% | 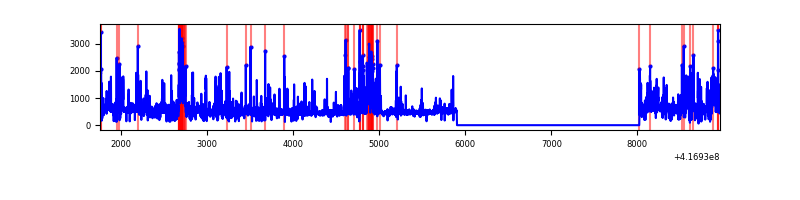 |
Top three noisy pixels from each quadrant. If the there are fewer than three noisy pixels in the level2.evt file, extra rows are filled as -1
| Pixel properties | Quadrant properties | ||||||
|---|---|---|---|---|---|---|---|
| Quadrant | DetID | PixID | Counts | Sigma | Mean | Median | Sigma |
| A | 10 | 83 | 473256 | 3952.54 | 588 | 578 | 119.6 |
| A | 13 | 248 | 471103 | 3934.53 | 588 | 578 | 119.6 |
| A | 2 | 79 | 20472 | 166.35 | 588 | 578 | 119.6 |
| B | 7 | 202 | 377323 | 3376.49 | 590 | 576 | 111.6 |
| B | 4 | 170 | 169419 | 1513.21 | 590 | 576 | 111.6 |
| B | 5 | 255 | 44881 | 397.07 | 590 | 576 | 111.6 |
| C | 15 | 214 | 221057 | 1652.25 | 574 | 578 | 133.4 |
| C | 9 | 54 | 91003 | 677.64 | 574 | 578 | 133.4 |
| C | 12 | 249 | 42492 | 314.1 | 574 | 578 | 133.4 |
| D | 2 | 250 | 297990 | 2361.92 | 520 | 507 | 125.9 |
| D | 12 | 227 | 264963 | 2099.7 | 520 | 507 | 125.9 |
| D | 12 | 191 | 219256 | 1736.8 | 520 | 507 | 125.9 |
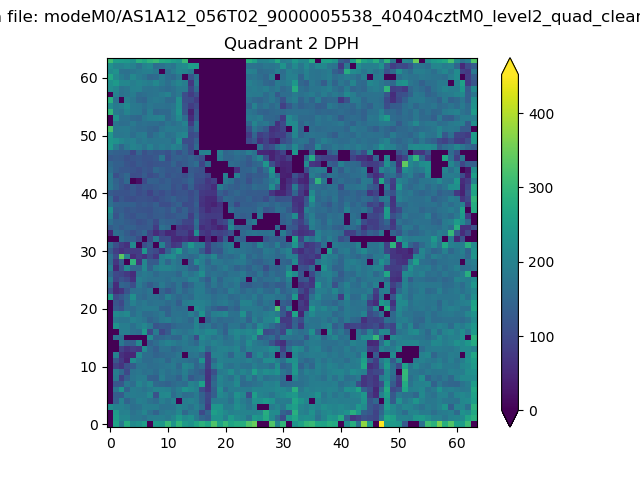
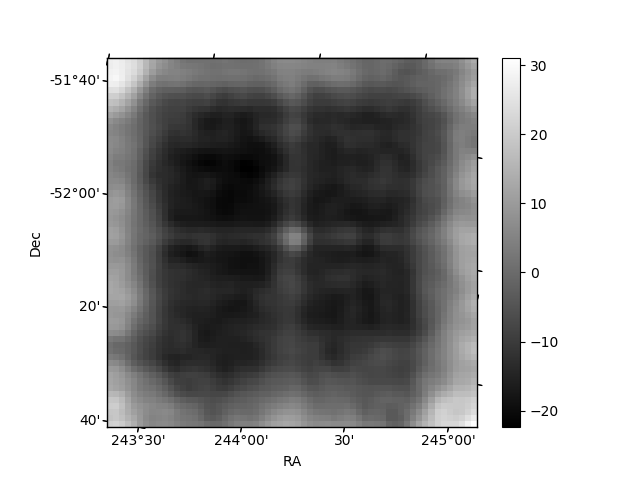
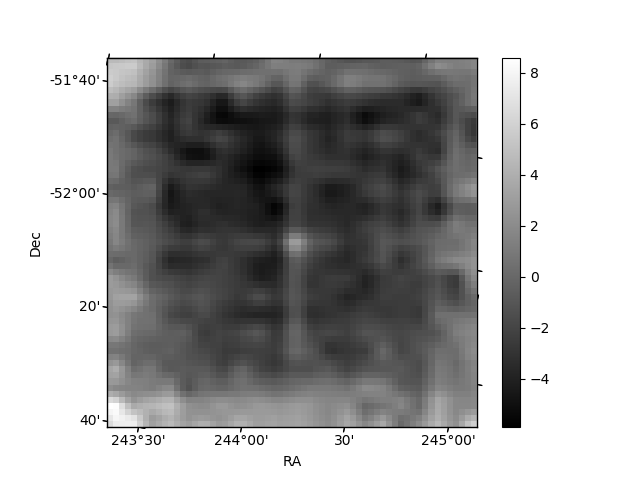
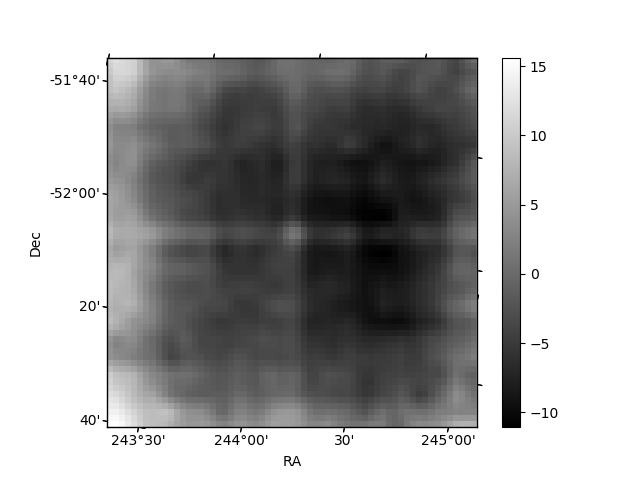
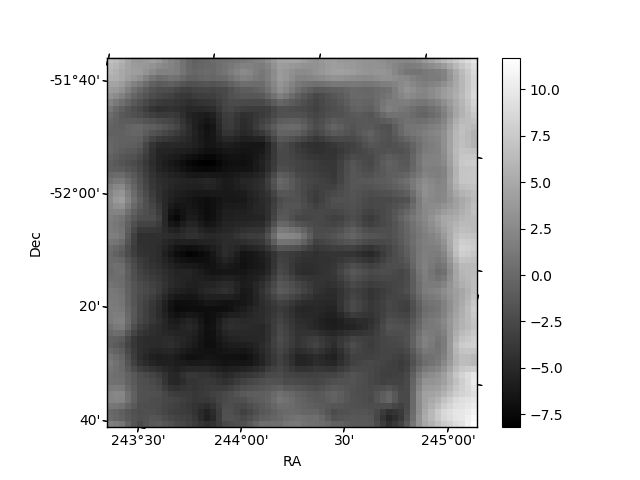
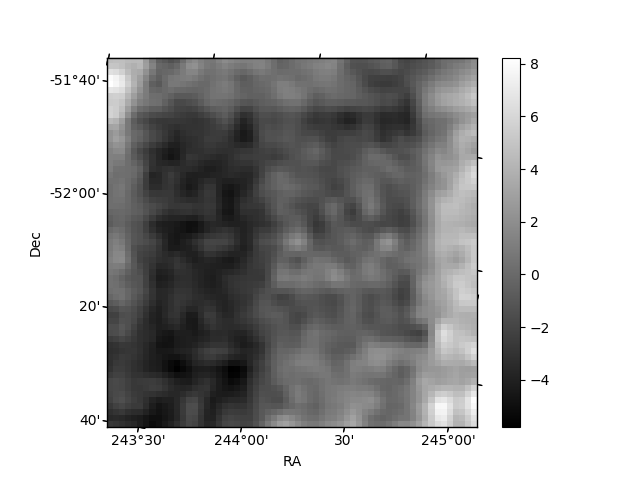
Histogram calculated using DETX and DETY for each event in the final _common_clean file
| Quadrant A | 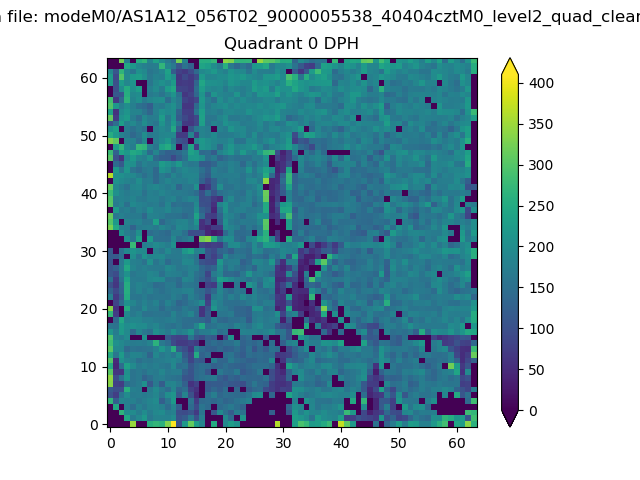 |
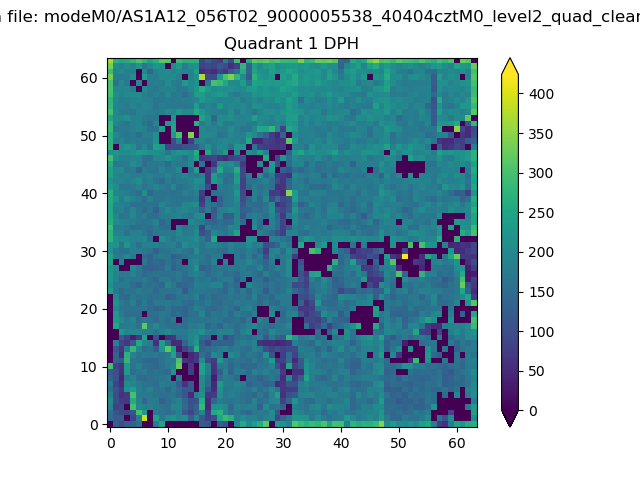 |
Quadrant B |
|---|---|---|---|
| Quadrant D | 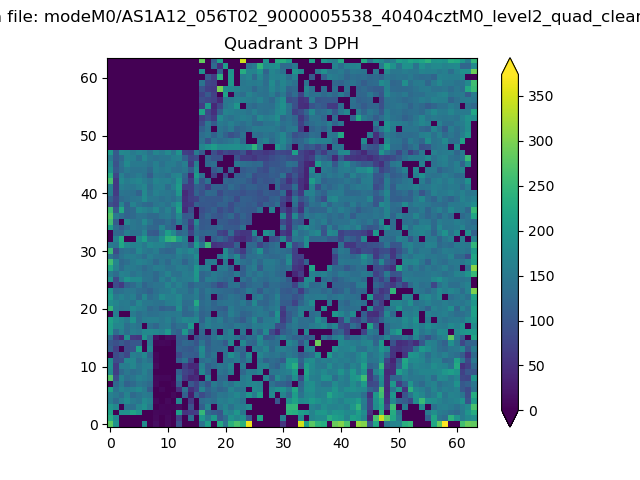 |
 |
Quadrant C |
| Plot type | Count rate plots | Images |
|---|---|---|
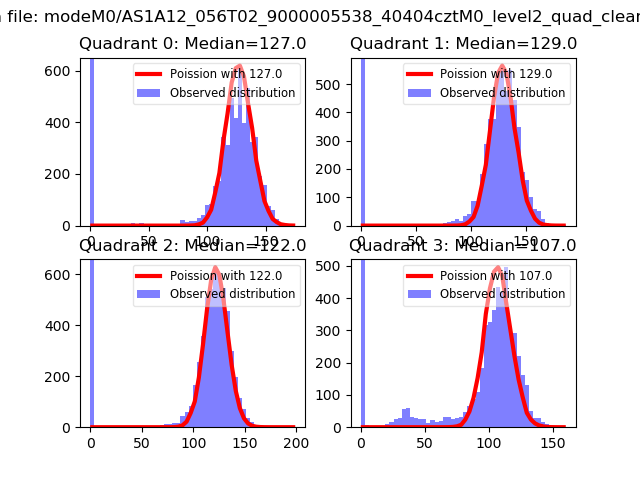
| Comparison with Poisson distribution Blue bars denote a histogram of data divided into 1 sec bins. Red curve is a Poisson curve with rate = median count rate of data. |
 |
 |
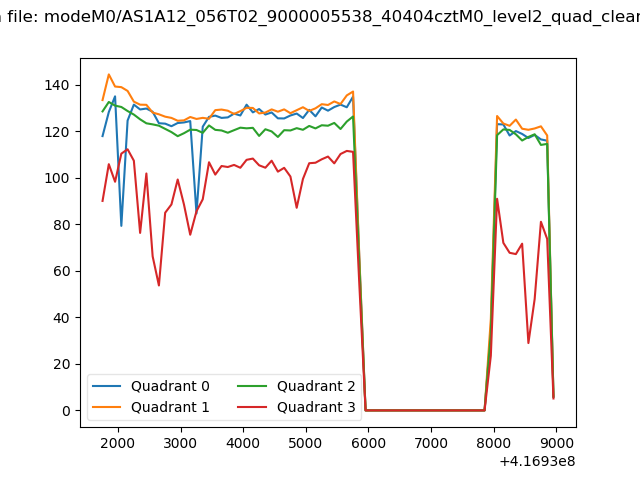
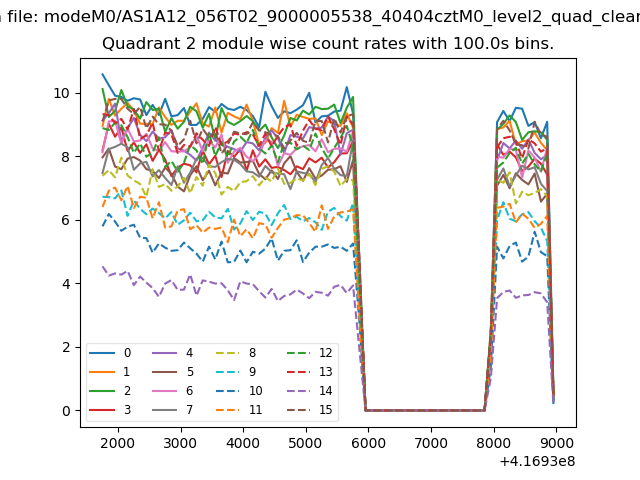
| Quadrant-wise count rates Data is divided into 100 sec bins |
 |
|
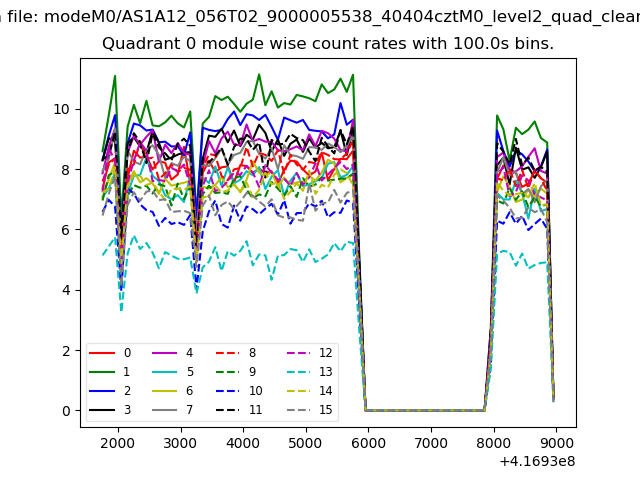
| Module-wise count rates for Quadrant A Data is divided into 100 sec bins |
 |
 |
| Module-wise count rates for Quadrant B Data is divided into 100 sec bins |
 |
 |
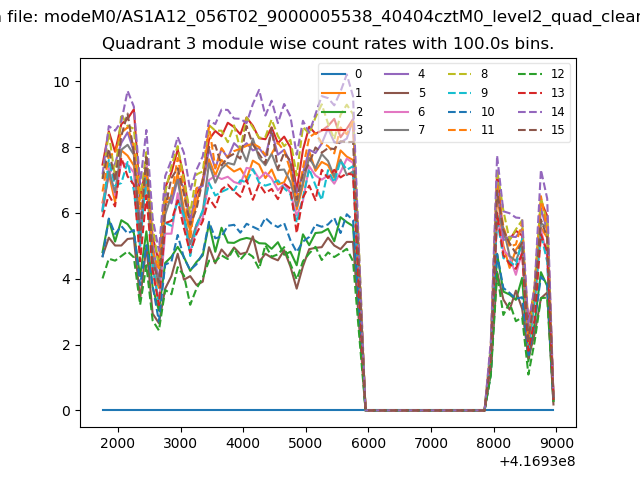
| Module-wise count rates for Quadrant C Data is divided into 100 sec bins |
 |
 |
| Module-wise count rates for Quadrant D Data is divided into 100 sec bins |
 |
 |
| Parameter | Plot |
|---|---|
| CZT HV Monitor |  |
| D_VDD | 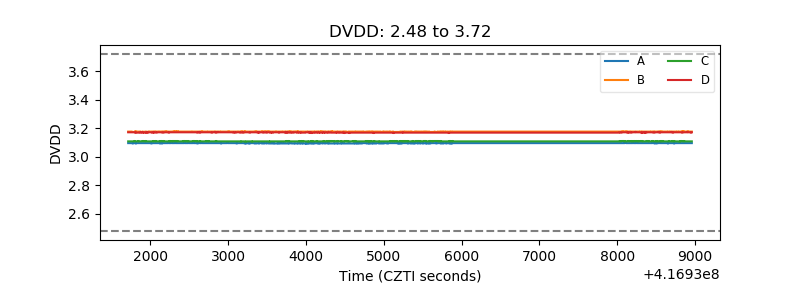 |
| Temperature 1 | 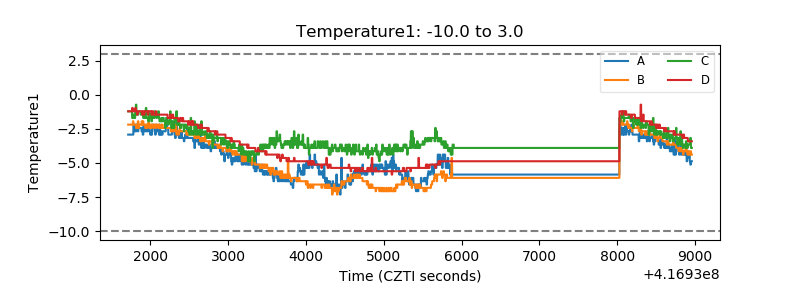 |
| Veto HV Monitor | 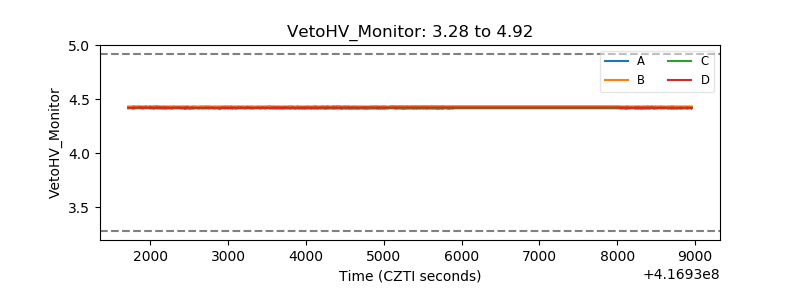 |
| Veto LLD | 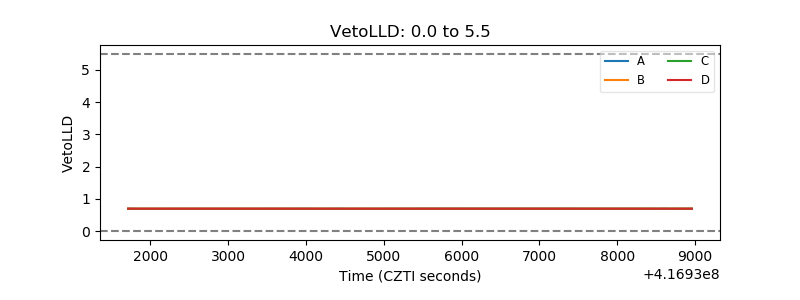 |
| Alpha Counter | 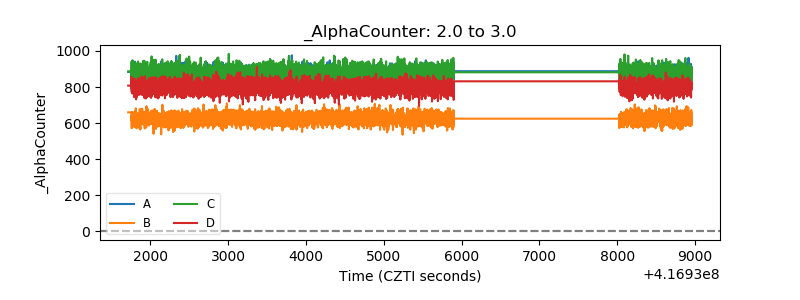 |
| _CPM_Rate |  |
| CZT Counter | 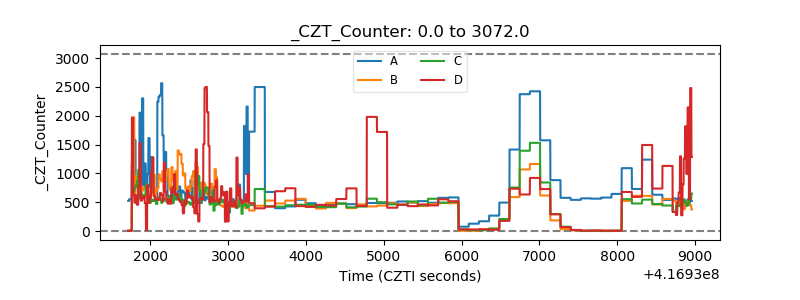 |
| +2.5 Volts monitor | 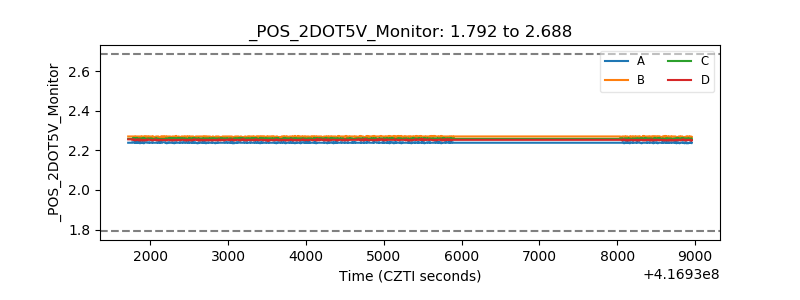 |
| +5 Volts monitor | 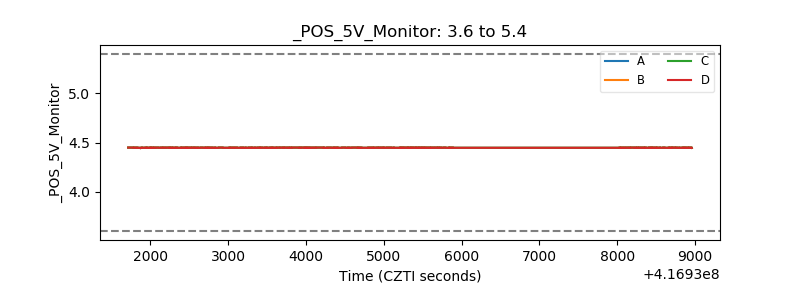 |
| _ROLL_ROT | 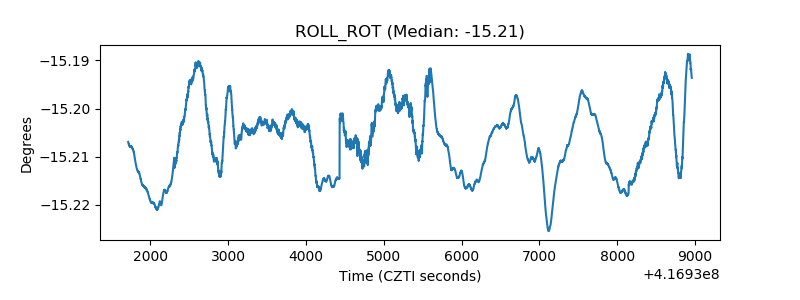 |
| _Roll_DEC |  |
| _Roll_RA | 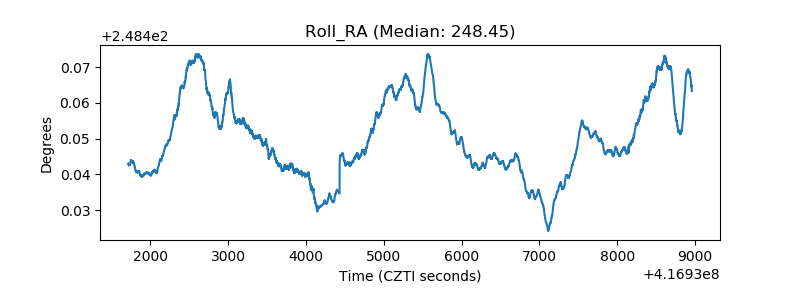 |
| Veto Counter | 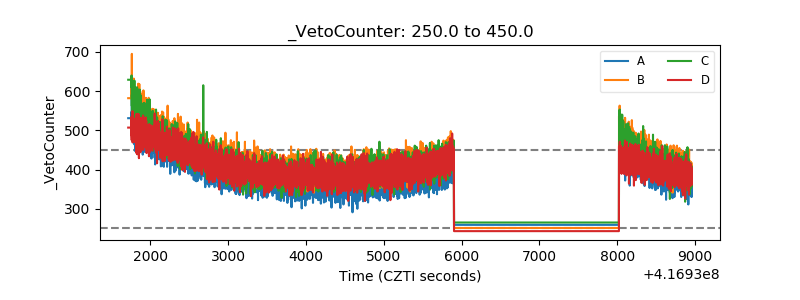 |