| Param | Original file | Final file |
|---|---|---|
| Filename | modeM0/AS1A12_056T02_9000005538_40405cztM0_level2.fits | modeM0/AS1A12_056T02_9000005538_40405cztM0_level2_quad_clean.evt |
| Size (bytes) | 338,284,800 | 86,918,400 |
| Size | 322.6 MB | 82.9 MB |
| Events in quadrant A | 2,954,513 | 606,080 |
| Events in quadrant B | 2,608,654 | 621,255 |
| Events in quadrant C | 2,461,746 | 588,588 |
| Events in quadrant D | 4,101,505 | 460,682 |
| Mode M0 | |||
|---|---|---|---|
| Quadrant | BADHDUFLAG | Total packets | Discarded packets |
| A | 0 | 11876 | 3 |
| B | 0 | 11240 | 2 |
| C | 0 | 10422 | 2 |
| D | 0 | 15727 | 2 |
| Mode M9 | |||
|---|---|---|---|
| Quadrant | BADHDUFLAG | Total packets | Discarded packets |
| A | 0 | 25 | 0 |
| B | 0 | 25 | 0 |
| C | 0 | 25 | 0 |
| D | 0 | 26 | 0 |
| Mode SS | |||
|---|---|---|---|
| Quadrant | BADHDUFLAG | Total packets | Discarded packets |
| A | 0 | 102 | 0 |
| B | 0 | 102 | 0 |
| C | 0 | 102 | 0 |
| D | 0 | 102 | 0 |
| Quadrant | Total seconds | Saturated seconds | Saturation percentage |
|---|---|---|---|
| A | 5073 | 69 | 1.360142% |
| B | 5073 | 30 | 0.591366% |
| C | 5073 | 12 | 0.236546% |
| D | 5073 | 930 | 18.332348% |
Noise dominated data is calculated using 1-second bins in cleaned event files. If a bin has >2000 counts, and if more than 50% of those come from <1% of pixels, then it is considered to be noise-dominated and hence unusable.
| Quadrant | # 1 sec bins | Bins with >0 counts | Bins with >2000 counts | High rate bins dominated by noise | Noise dominated (total time) | Noise dominated (detector-on time) | Marked lightcurve |
|---|---|---|---|---|---|---|---|
| A | 7076 | 5074 | 41 | 41 | 0.58% | 0.81% | 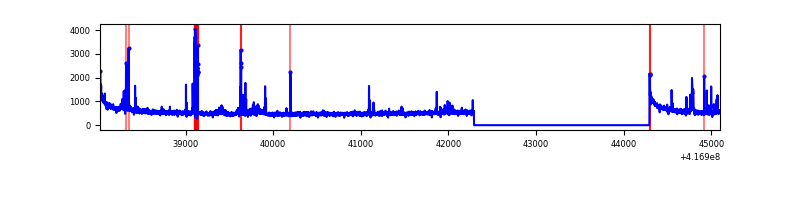 |
| B | 7076 | 5074 | 6 | 6 | 0.08% | 0.12% | 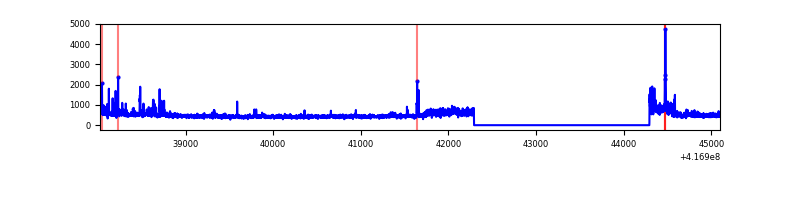 |
| C | 7076 | 5074 | 6 | 6 | 0.08% | 0.12% | 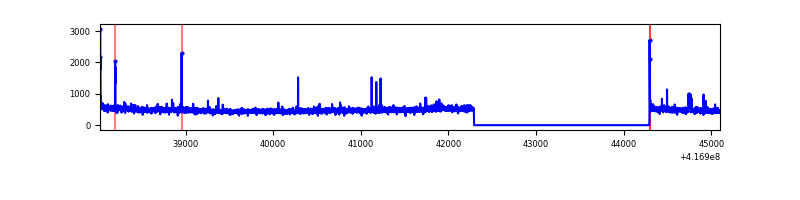 |
| D | 7076 | 5074 | 199 | 199 | 2.81% | 3.92% | 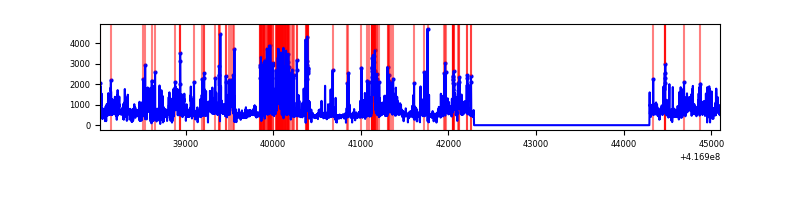 |
Top three noisy pixels from each quadrant. If the there are fewer than three noisy pixels in the level2.evt file, extra rows are filled as -1
| Pixel properties | Quadrant properties | ||||||
|---|---|---|---|---|---|---|---|
| Quadrant | DetID | PixID | Counts | Sigma | Mean | Median | Sigma |
| A | 10 | 83 | 473253 | 4095.64 | 566 | 556 | 115.4 |
| A | 13 | 248 | 176086 | 1520.86 | 566 | 556 | 115.4 |
| A | 9 | 143 | 100921 | 869.6 | 566 | 556 | 115.4 |
| B | 7 | 202 | 170659 | 1553.05 | 567 | 551 | 109.5 |
| B | 5 | 255 | 67024 | 606.89 | 567 | 551 | 109.5 |
| B | 4 | 170 | 62190 | 562.75 | 567 | 551 | 109.5 |
| C | 15 | 214 | 219223 | 1688.3 | 555 | 559 | 129.5 |
| C | 12 | 249 | 28303 | 214.21 | 555 | 559 | 129.5 |
| C | 0 | 10 | 22184 | 166.97 | 555 | 559 | 129.5 |
| D | 12 | 227 | 1264357 | 10171.53 | 508 | 494 | 124.3 |
| D | 2 | 250 | 220456 | 1770.25 | 508 | 494 | 124.3 |
| D | 12 | 191 | 179307 | 1439.08 | 508 | 494 | 124.3 |
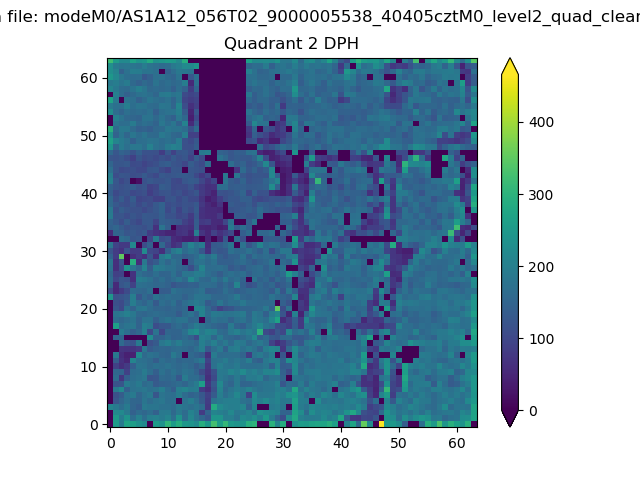
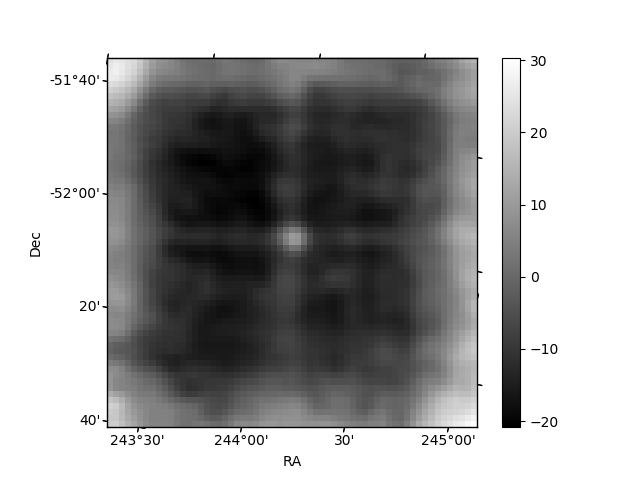
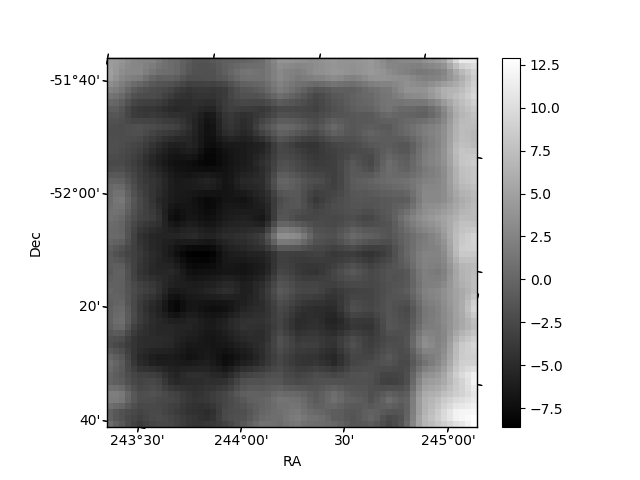
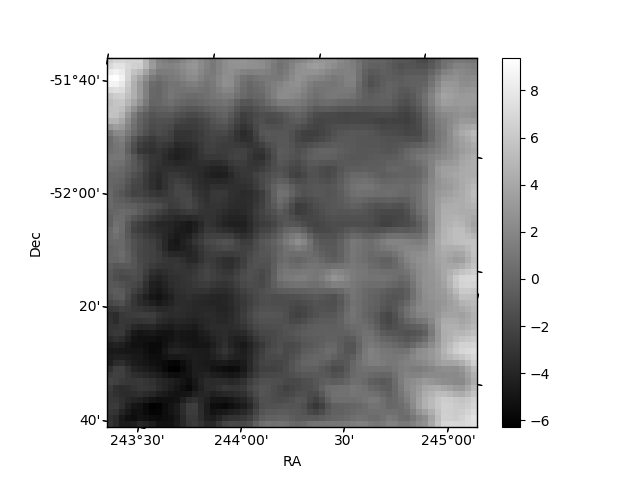
Histogram calculated using DETX and DETY for each event in the final _common_clean file
| Quadrant A | 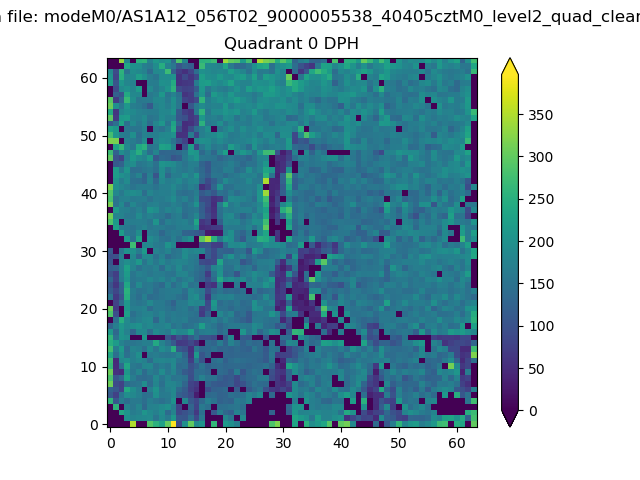 |
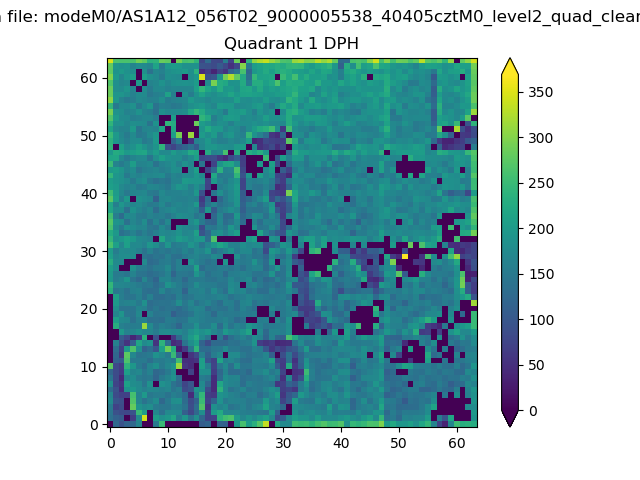 |
Quadrant B |
|---|---|---|---|
| Quadrant D | 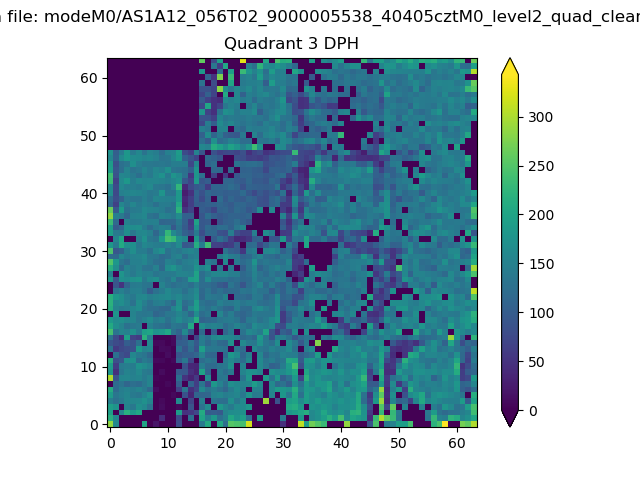 |
 |
Quadrant C |
| Plot type | Count rate plots | Images |
|---|---|---|
| Comparison with Poisson distribution Blue bars denote a histogram of data divided into 1 sec bins. Red curve is a Poisson curve with rate = median count rate of data. |
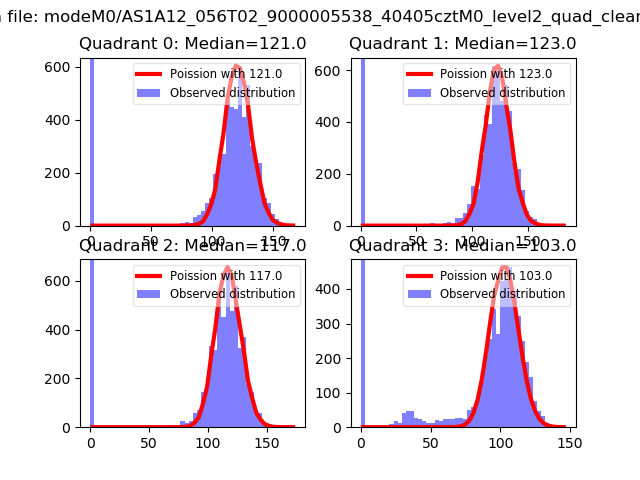 |
 |
| Quadrant-wise count rates Data is divided into 100 sec bins |
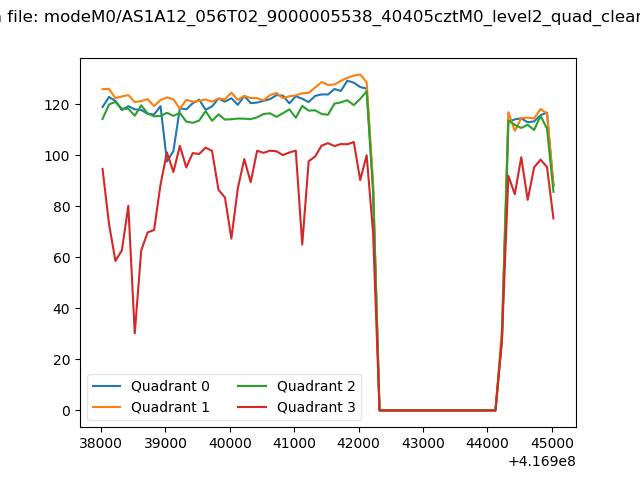 |
|
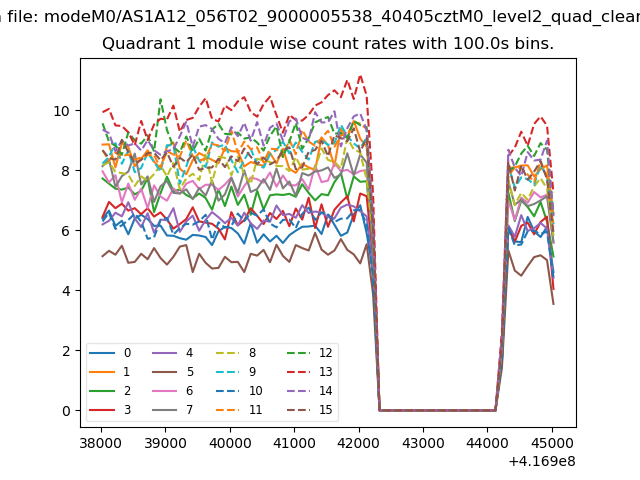
| Module-wise count rates for Quadrant A Data is divided into 100 sec bins |
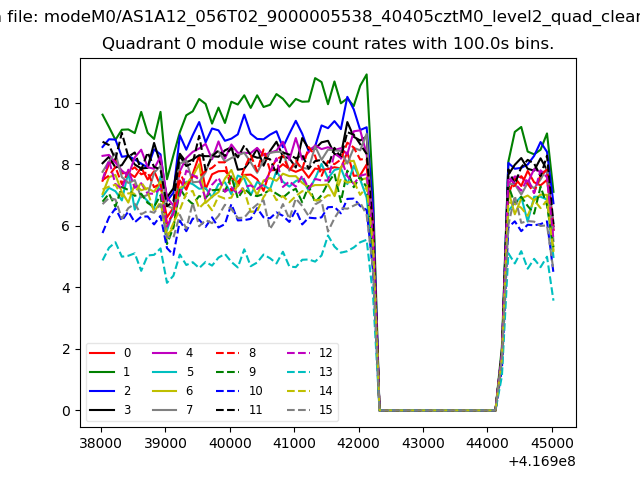 |
 |
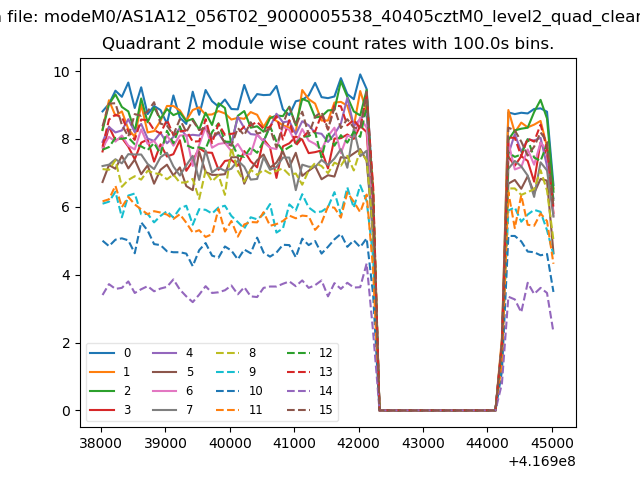
| Module-wise count rates for Quadrant B Data is divided into 100 sec bins |
 |
 |
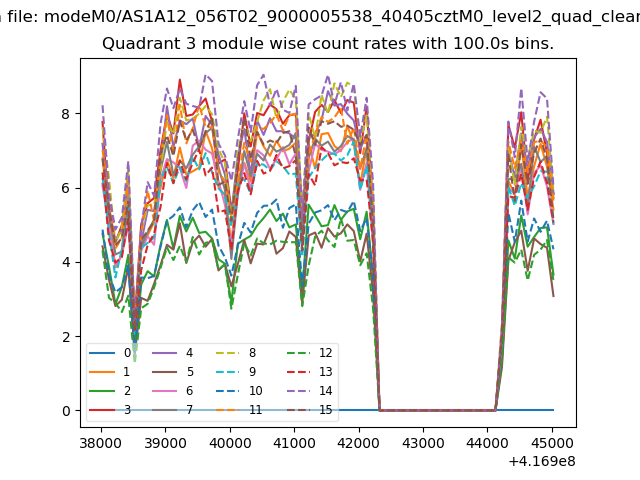
| Module-wise count rates for Quadrant C Data is divided into 100 sec bins |
 |
 |
| Module-wise count rates for Quadrant D Data is divided into 100 sec bins |
 |
 |
| Parameter | Plot |
|---|---|
| CZT HV Monitor |  |
| D_VDD | 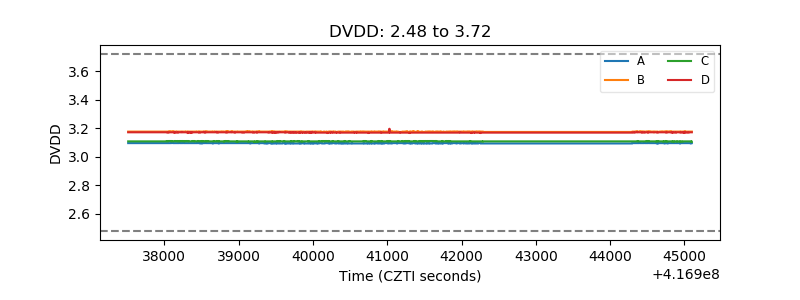 |
| Temperature 1 |  |
| Veto HV Monitor | 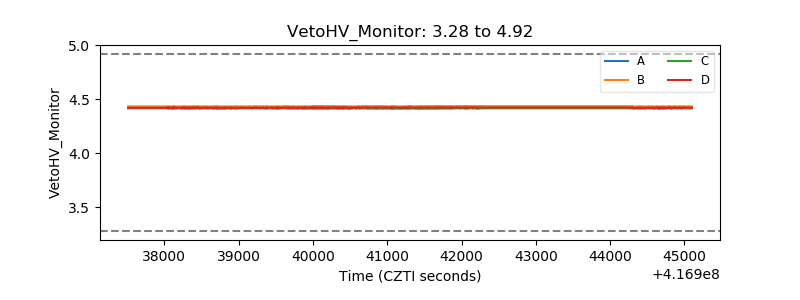 |
| Veto LLD | 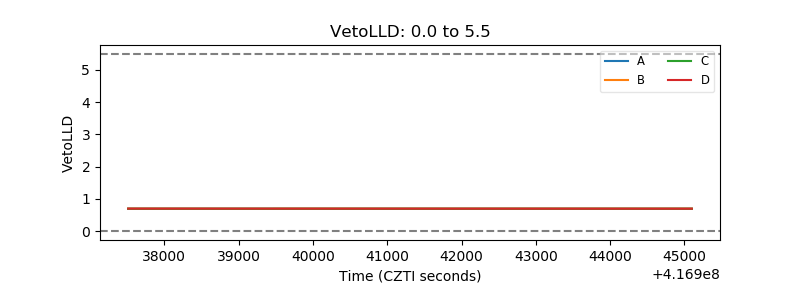 |
| Alpha Counter | 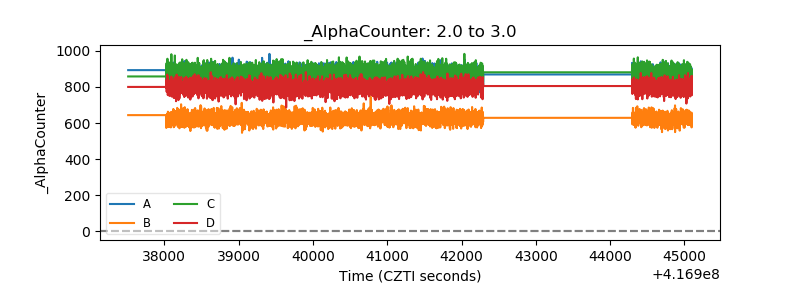 |
| _CPM_Rate | 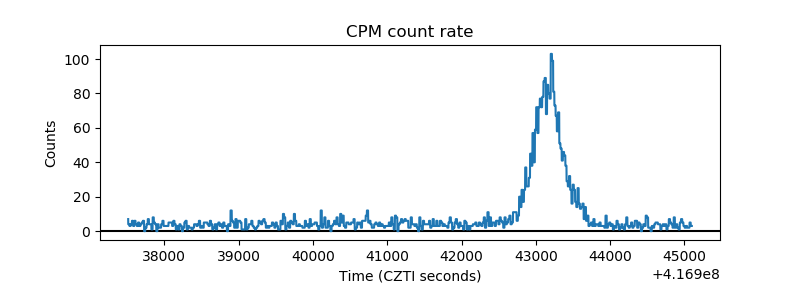 |
| CZT Counter | 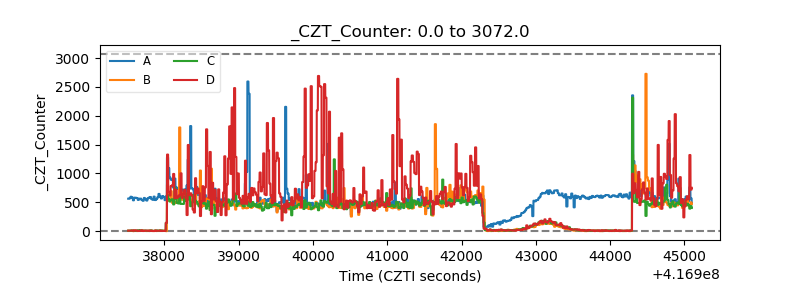 |
| +2.5 Volts monitor | 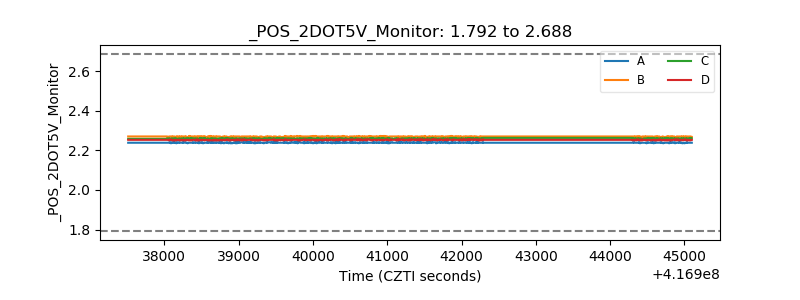 |
| +5 Volts monitor | 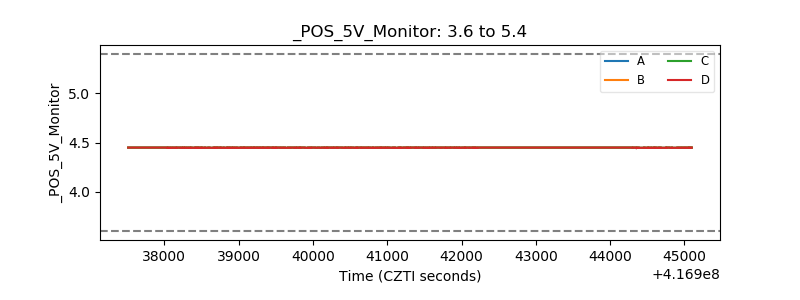 |
| _ROLL_ROT | 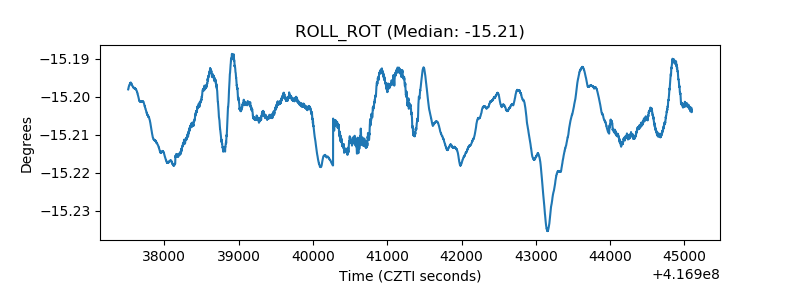 |
| _Roll_DEC | 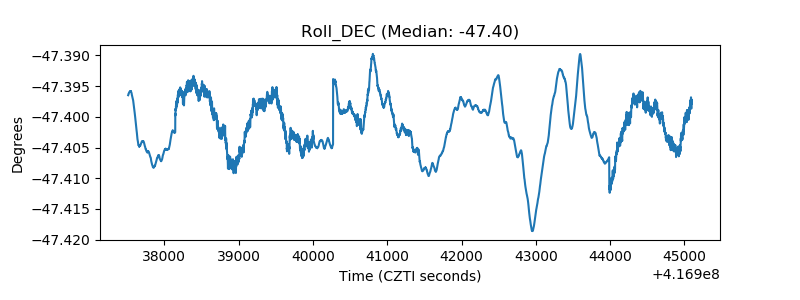 |
| _Roll_RA | 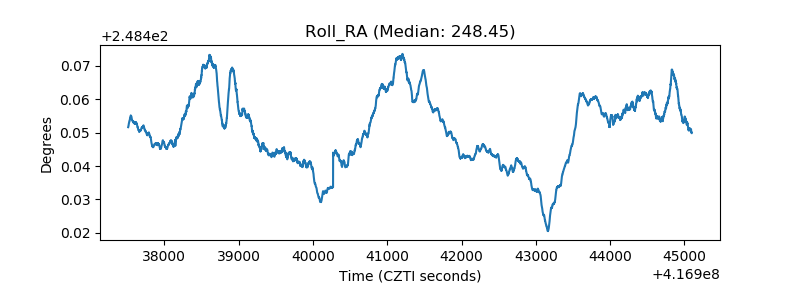 |
| Veto Counter | 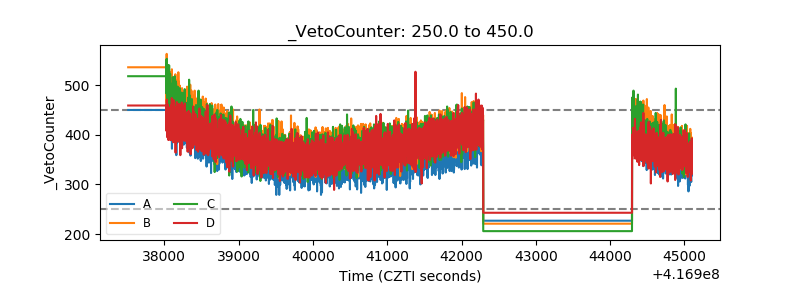 |