| Param | Original file | Final file |
|---|---|---|
| Filename | modeM0/AS1A12_056T02_9000005538_40407cztM0_level2.fits | modeM0/AS1A12_056T02_9000005538_40407cztM0_level2_quad_clean.evt |
| Size (bytes) | 406,028,160 | 101,462,400 |
| Size | 387.2 MB | 96.8 MB |
| Events in quadrant A | 3,472,891 | 697,161 |
| Events in quadrant B | 3,344,825 | 712,388 |
| Events in quadrant C | 2,880,508 | 681,293 |
| Events in quadrant D | 4,859,835 | 558,177 |
| Mode M0 | |||
|---|---|---|---|
| Quadrant | BADHDUFLAG | Total packets | Discarded packets |
| A | 0 | 13997 | 3 |
| B | 0 | 14144 | 2 |
| C | 0 | 12295 | 2 |
| D | 0 | 18565 | 2 |
| Mode M9 | |||
|---|---|---|---|
| Quadrant | BADHDUFLAG | Total packets | Discarded packets |
| A | 0 | 31 | 0 |
| B | 0 | 31 | 0 |
| C | 0 | 31 | 0 |
| D | 0 | 31 | 0 |
| Mode SS | |||
|---|---|---|---|
| Quadrant | BADHDUFLAG | Total packets | Discarded packets |
| A | 0 | 124 | 0 |
| B | 0 | 124 | 0 |
| C | 0 | 124 | 0 |
| D | 0 | 124 | 0 |
| Quadrant | Total seconds | Saturated seconds | Saturation percentage |
|---|---|---|---|
| A | 6063 | 92 | 1.517401% |
| B | 6063 | 79 | 1.302985% |
| C | 6063 | 9 | 0.148441% |
| D | 6063 | 801 | 13.211282% |
Noise dominated data is calculated using 1-second bins in cleaned event files. If a bin has >2000 counts, and if more than 50% of those come from <1% of pixels, then it is considered to be noise-dominated and hence unusable.
| Quadrant | # 1 sec bins | Bins with >0 counts | Bins with >2000 counts | High rate bins dominated by noise | Noise dominated (total time) | Noise dominated (detector-on time) | Marked lightcurve |
|---|---|---|---|---|---|---|---|
| A | 9140 | 6065 | 67 | 67 | 0.73% | 1.10% | 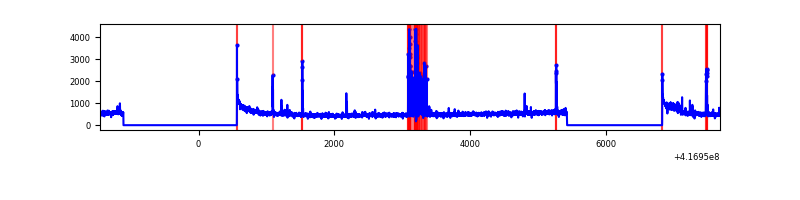 |
| B | 9140 | 6065 | 43 | 43 | 0.47% | 0.71% | 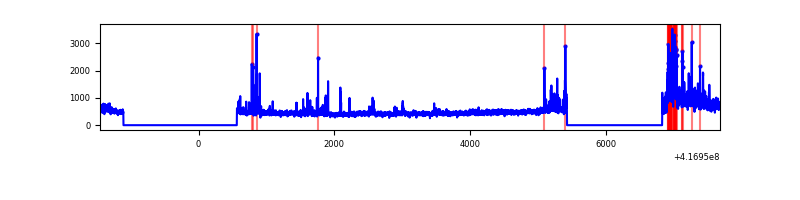 |
| C | 9140 | 6065 | 1 | 1 | 0.01% | 0.02% | 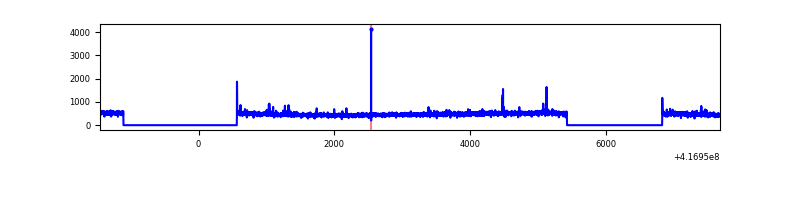 |
| D | 9140 | 6065 | 241 | 241 | 2.64% | 3.97% | 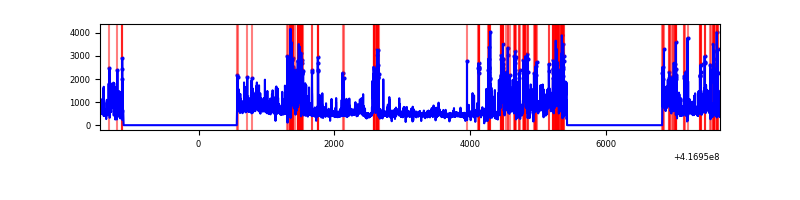 |
Top three noisy pixels from each quadrant. If the there are fewer than three noisy pixels in the level2.evt file, extra rows are filled as -1
| Pixel properties | Quadrant properties | ||||||
|---|---|---|---|---|---|---|---|
| Quadrant | DetID | PixID | Counts | Sigma | Mean | Median | Sigma |
| A | 10 | 83 | 518729 | 3755.52 | 670 | 657 | 137.9 |
| A | 13 | 248 | 288295 | 2085.1 | 670 | 657 | 137.9 |
| A | 9 | 143 | 33384 | 237.24 | 670 | 657 | 137.9 |
| B | 7 | 202 | 399431 | 3097.8 | 667 | 649 | 128.7 |
| B | 4 | 170 | 143661 | 1110.94 | 667 | 649 | 128.7 |
| B | 5 | 255 | 106510 | 822.35 | 667 | 649 | 128.7 |
| C | 15 | 214 | 259987 | 1681.54 | 658 | 664 | 154.2 |
| C | 12 | 249 | 25588 | 161.62 | 658 | 664 | 154.2 |
| C | 14 | 254 | 12472 | 76.57 | 658 | 664 | 154.2 |
| D | 12 | 227 | 1450403 | 9400.83 | 620 | 604 | 154.2 |
| D | 2 | 250 | 501268 | 3246.42 | 620 | 604 | 154.2 |
| D | 13 | 171 | 218593 | 1413.49 | 620 | 604 | 154.2 |
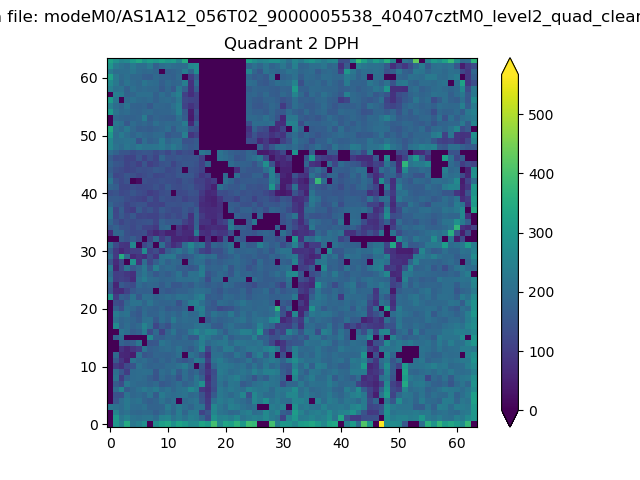
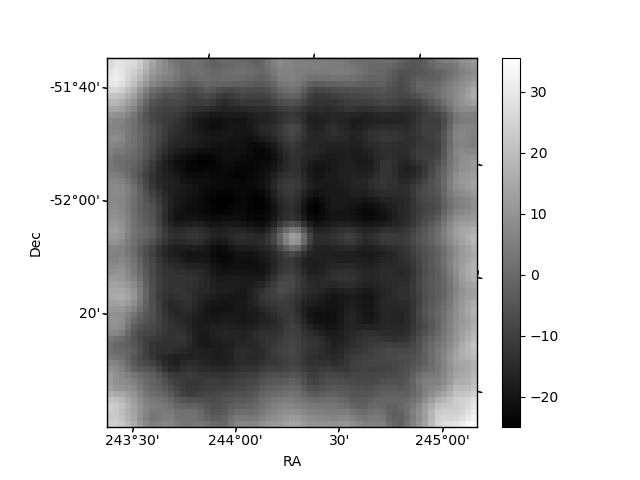
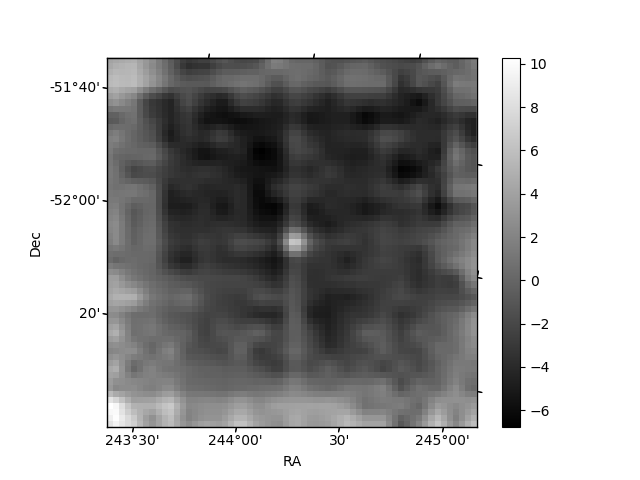
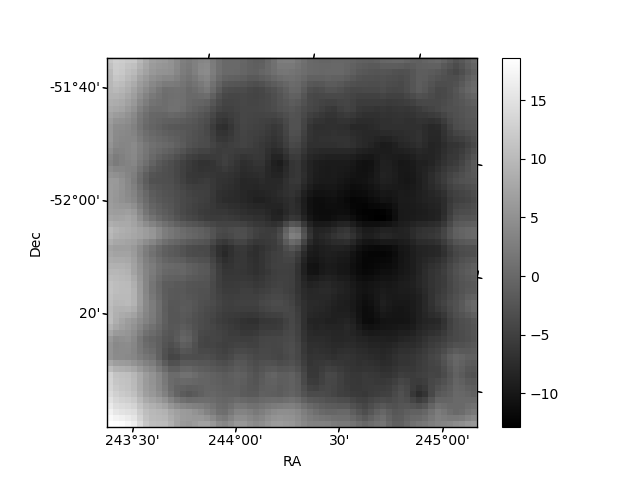
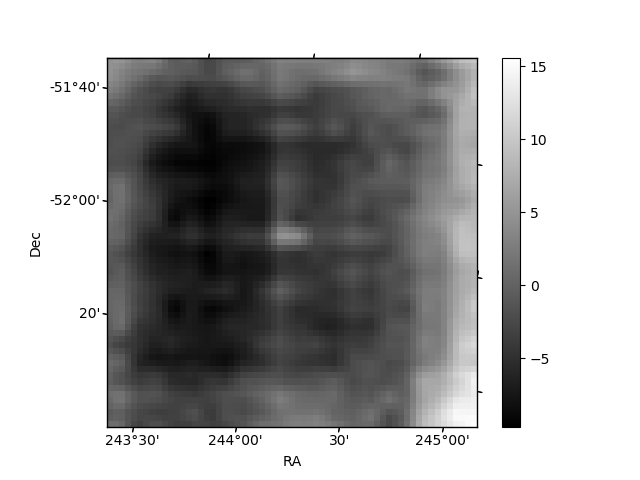
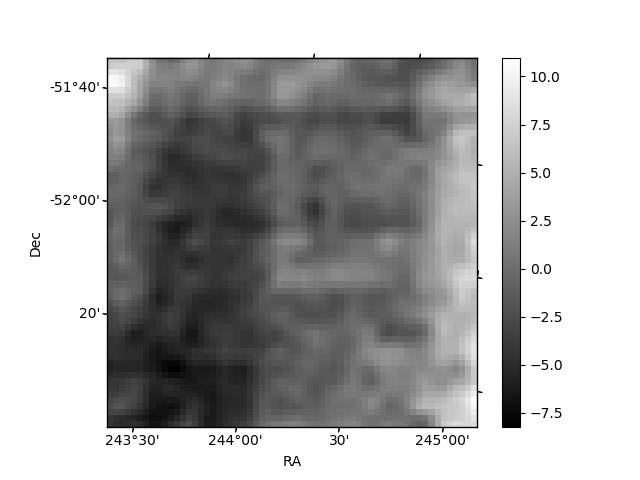
Histogram calculated using DETX and DETY for each event in the final _common_clean file
| Quadrant A | 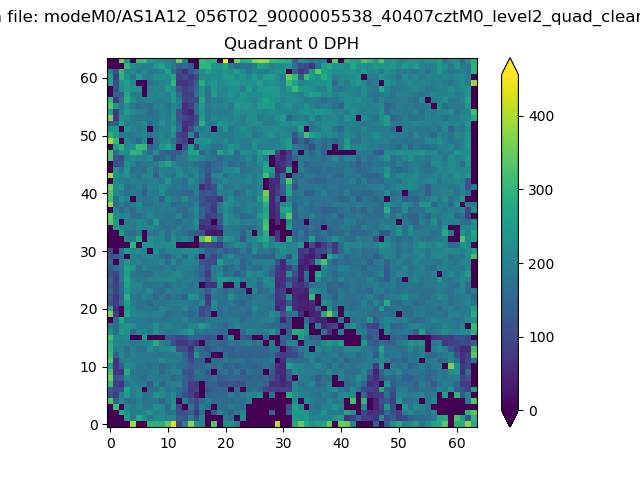 |
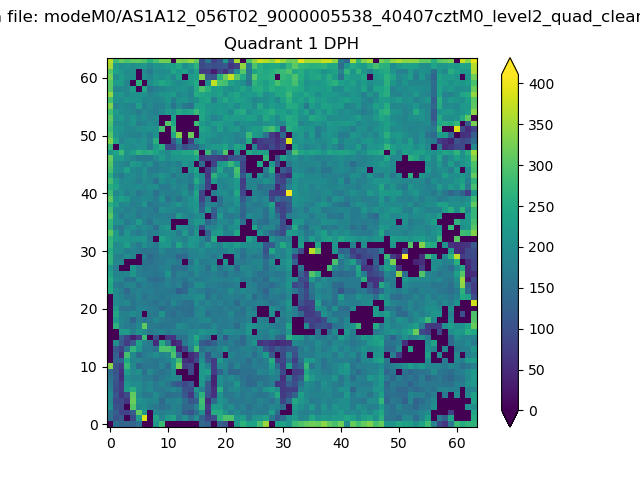 |
Quadrant B |
|---|---|---|---|
| Quadrant D | 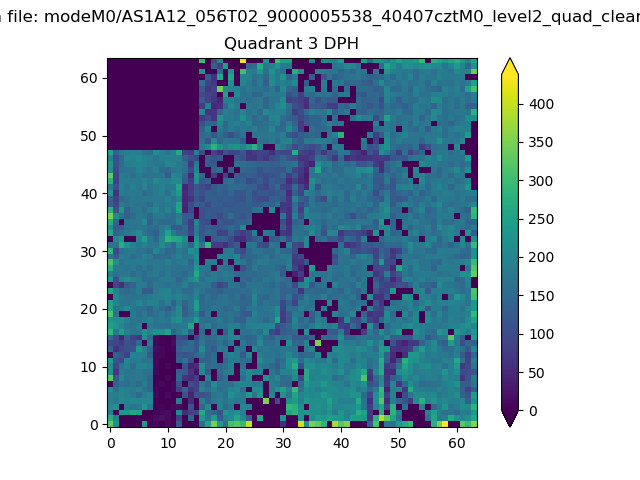 |
 |
Quadrant C |
| Plot type | Count rate plots | Images |
|---|---|---|
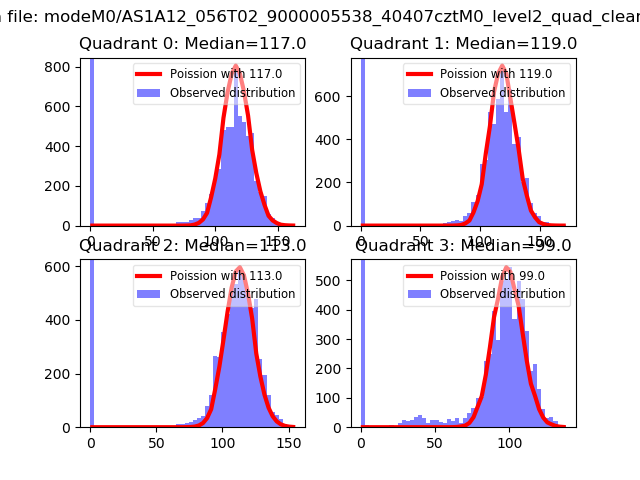
| Comparison with Poisson distribution Blue bars denote a histogram of data divided into 1 sec bins. Red curve is a Poisson curve with rate = median count rate of data. |
 |
 |
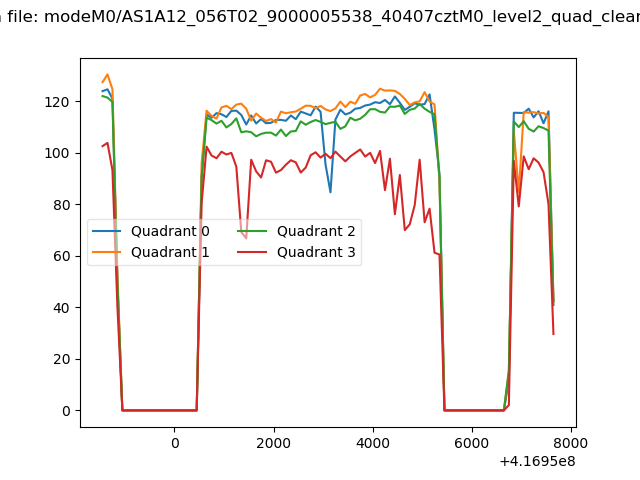
| Quadrant-wise count rates Data is divided into 100 sec bins |
 |
|
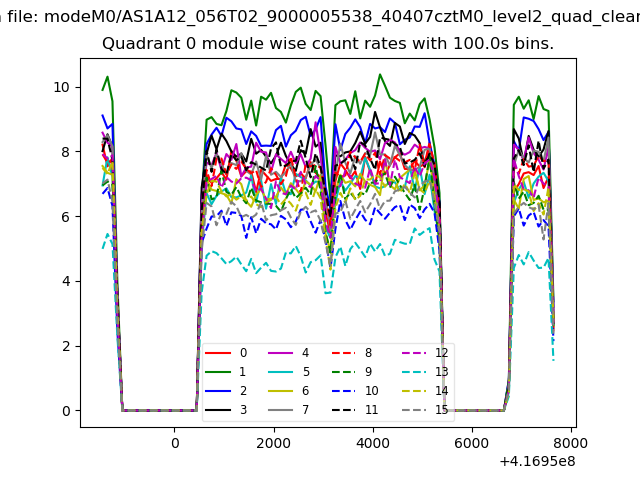
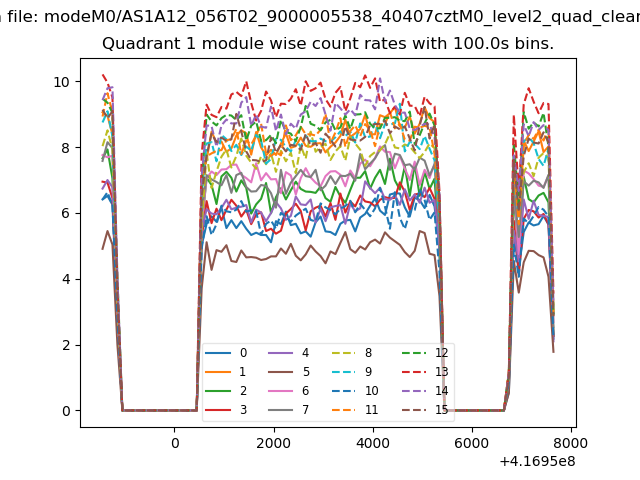
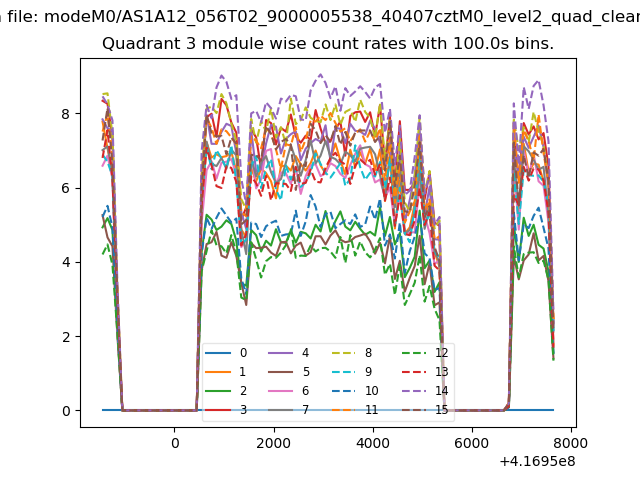
| Module-wise count rates for Quadrant A Data is divided into 100 sec bins |
 |
 |
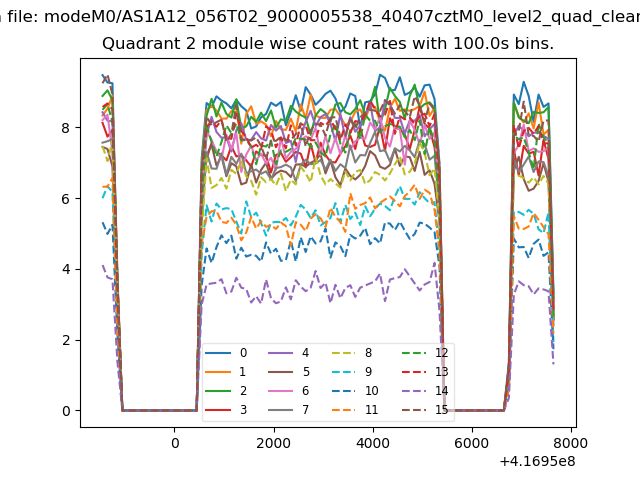
| Module-wise count rates for Quadrant B Data is divided into 100 sec bins |
 |
 |
| Module-wise count rates for Quadrant C Data is divided into 100 sec bins |
 |
 |
| Module-wise count rates for Quadrant D Data is divided into 100 sec bins |
 |
 |
| Parameter | Plot |
|---|---|
| CZT HV Monitor | 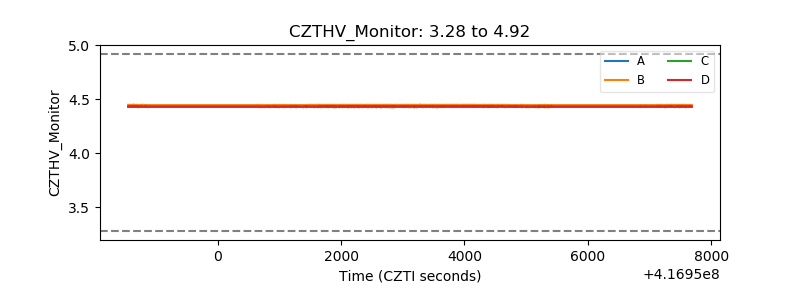 |
| D_VDD | 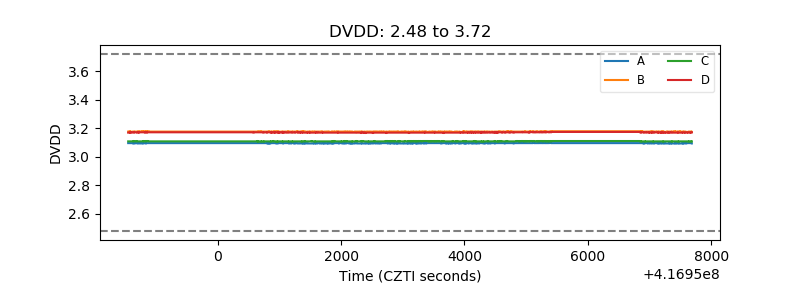 |
| Temperature 1 | 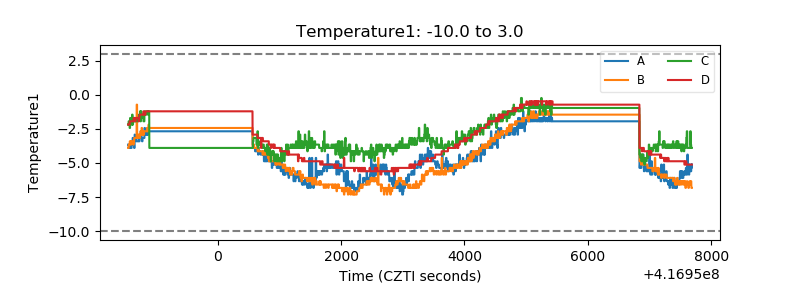 |
| Veto HV Monitor | 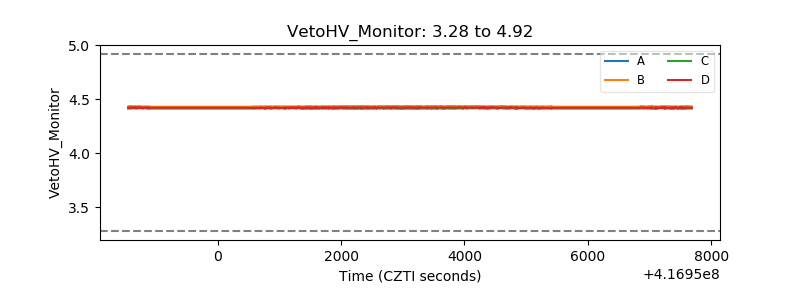 |
| Veto LLD | 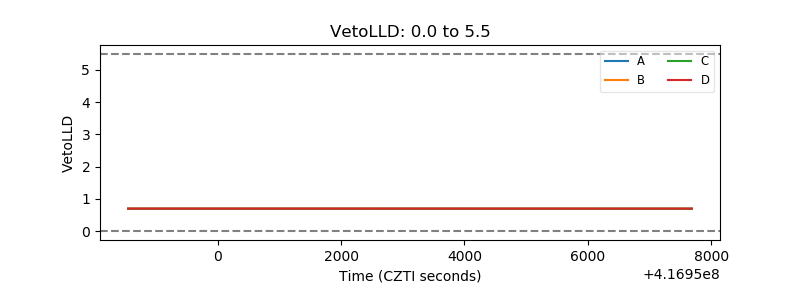 |
| Alpha Counter | 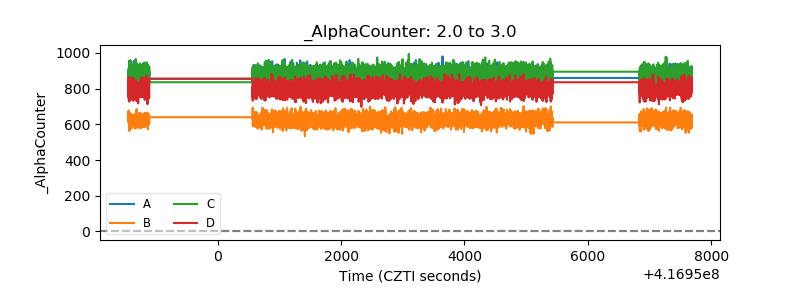 |
| _CPM_Rate | 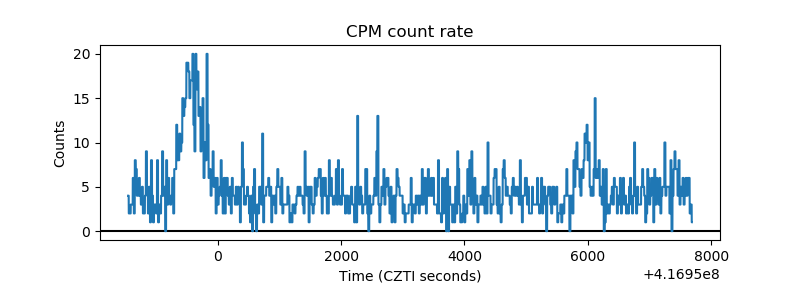 |
| CZT Counter | 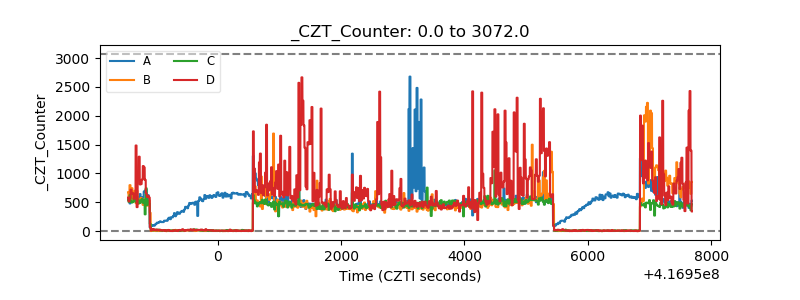 |
| +2.5 Volts monitor | 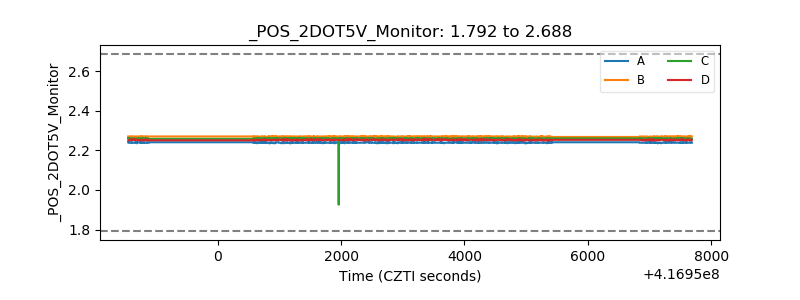 |
| +5 Volts monitor |  |
| _ROLL_ROT | 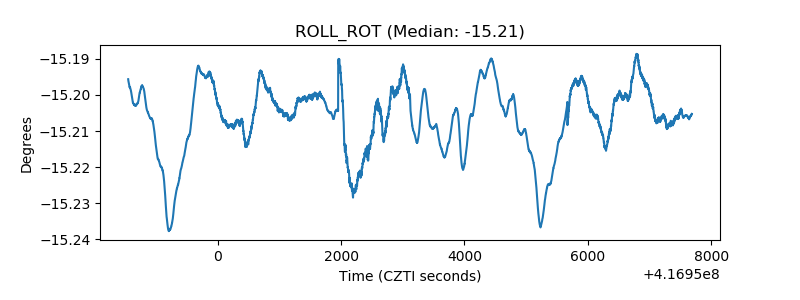 |
| _Roll_DEC | 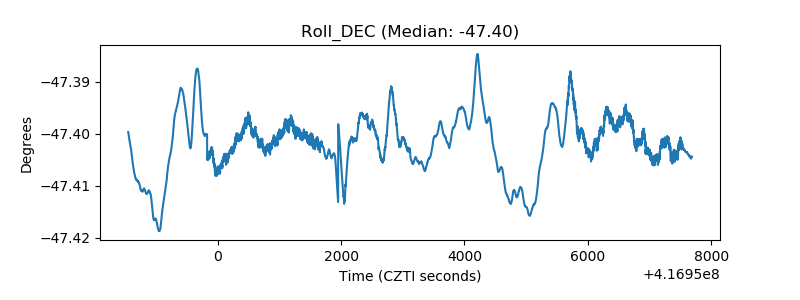 |
| _Roll_RA | 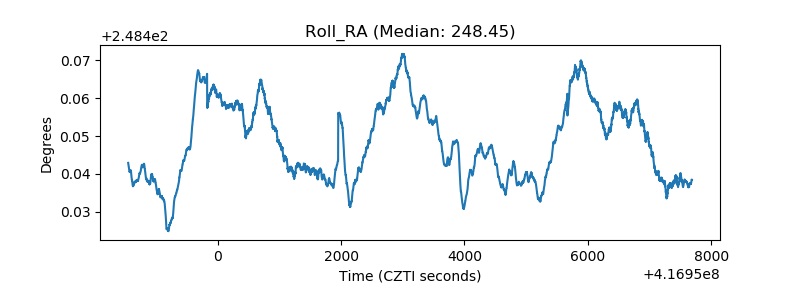 |
| Veto Counter | 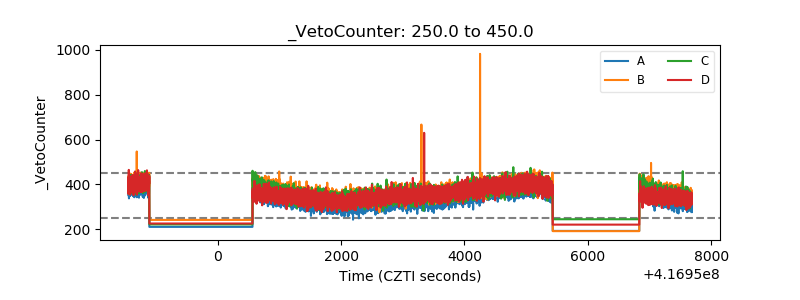 |