| Param | Original file | Final file |
|---|---|---|
| Filename | modeM0/AS1A12_056T02_9000005538_40408cztM0_level2.fits | modeM0/AS1A12_056T02_9000005538_40408cztM0_level2_quad_clean.evt |
| Size (bytes) | 518,973,120 | 93,196,800 |
| Size | 494.9 MB | 88.9 MB |
| Events in quadrant A | 3,543,871 | 671,301 |
| Events in quadrant B | 3,600,196 | 687,085 |
| Events in quadrant C | 2,842,048 | 658,938 |
| Events in quadrant D | 8,761,564 | 388,619 |
| Mode M0 | |||
|---|---|---|---|
| Quadrant | BADHDUFLAG | Total packets | Discarded packets |
| A | 0 | 14210 | 3 |
| B | 0 | 14703 | 2 |
| C | 0 | 12124 | 2 |
| D | 0 | 30159 | 2 |
| Mode M9 | |||
|---|---|---|---|
| Quadrant | BADHDUFLAG | Total packets | Discarded packets |
| A | 0 | 27 | 0 |
| B | 0 | 27 | 0 |
| C | 0 | 27 | 0 |
| D | 0 | 27 | 0 |
| Mode SS | |||
|---|---|---|---|
| Quadrant | BADHDUFLAG | Total packets | Discarded packets |
| A | 0 | 122 | 0 |
| B | 0 | 122 | 0 |
| C | 0 | 122 | 0 |
| D | 0 | 122 | 0 |
| Quadrant | Total seconds | Saturated seconds | Saturation percentage |
|---|---|---|---|
| A | 5956 | 87 | 1.460712% |
| B | 5956 | 74 | 1.242445% |
| C | 5956 | 6 | 0.100739% |
| D | 5956 | 2355 | 39.539960% |
Noise dominated data is calculated using 1-second bins in cleaned event files. If a bin has >2000 counts, and if more than 50% of those come from <1% of pixels, then it is considered to be noise-dominated and hence unusable.
| Quadrant | # 1 sec bins | Bins with >0 counts | Bins with >2000 counts | High rate bins dominated by noise | Noise dominated (total time) | Noise dominated (detector-on time) | Marked lightcurve |
|---|---|---|---|---|---|---|---|
| A | 8673 | 5958 | 76 | 76 | 0.88% | 1.28% | 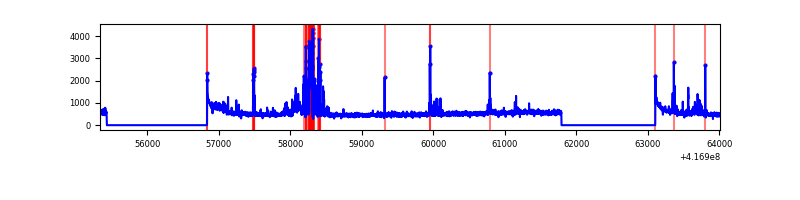 |
| B | 8673 | 5958 | 38 | 38 | 0.44% | 0.64% | 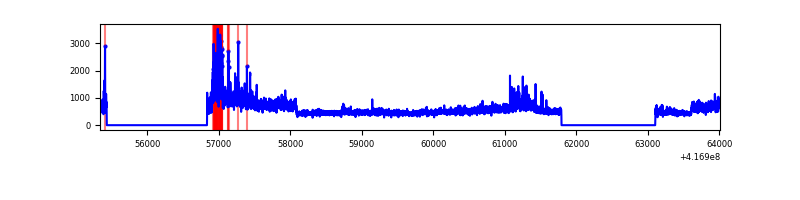 |
| C | 8673 | 5958 | 3 | 3 | 0.03% | 0.05% | 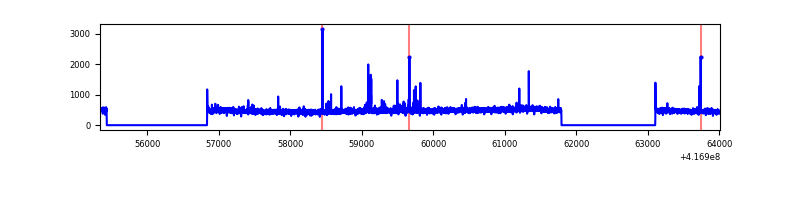 |
| D | 8672 | 5957 | 1629 | 1629 | 18.78% | 27.35% | 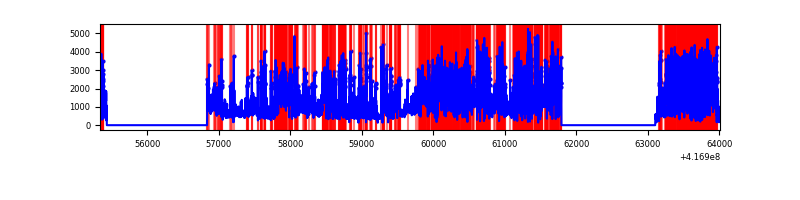 |
Top three noisy pixels from each quadrant. If the there are fewer than three noisy pixels in the level2.evt file, extra rows are filled as -1
| Pixel properties | Quadrant properties | ||||||
|---|---|---|---|---|---|---|---|
| Quadrant | DetID | PixID | Counts | Sigma | Mean | Median | Sigma |
| A | 10 | 83 | 513092 | 3836.67 | 653 | 640 | 133.6 |
| A | 13 | 248 | 317874 | 2375.1 | 653 | 640 | 133.6 |
| A | 9 | 143 | 99399 | 739.4 | 653 | 640 | 133.6 |
| B | 7 | 202 | 763967 | 6042.51 | 652 | 635 | 126.3 |
| B | 4 | 170 | 102290 | 804.7 | 652 | 635 | 126.3 |
| B | 5 | 255 | 64713 | 507.24 | 652 | 635 | 126.3 |
| C | 15 | 214 | 257110 | 1695.52 | 643 | 647 | 151.3 |
| C | 14 | 254 | 40164 | 261.25 | 643 | 647 | 151.3 |
| C | 12 | 249 | 28094 | 181.46 | 643 | 647 | 151.3 |
| D | 12 | 227 | 5080121 | 39555.84 | 517 | 504 | 128.4 |
| D | 2 | 250 | 1264498 | 9842.94 | 517 | 504 | 128.4 |
| D | 13 | 171 | 168860 | 1311.02 | 517 | 504 | 128.4 |
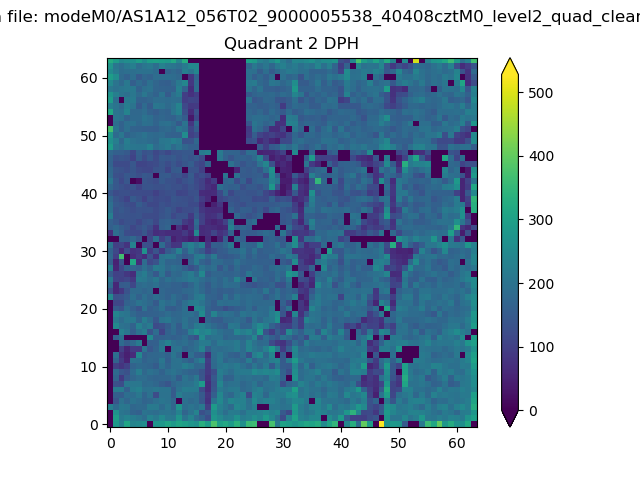
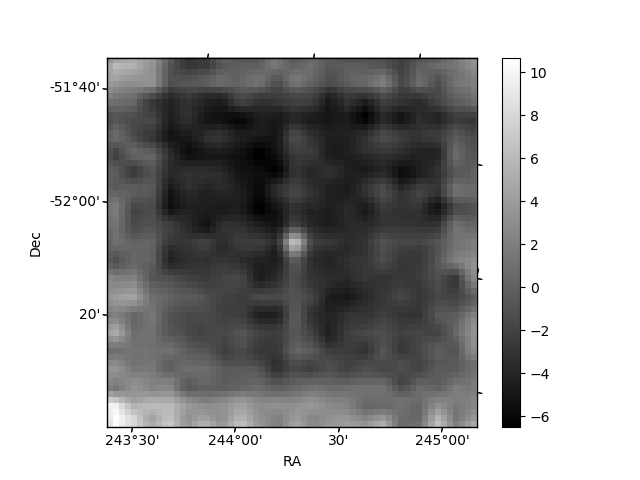
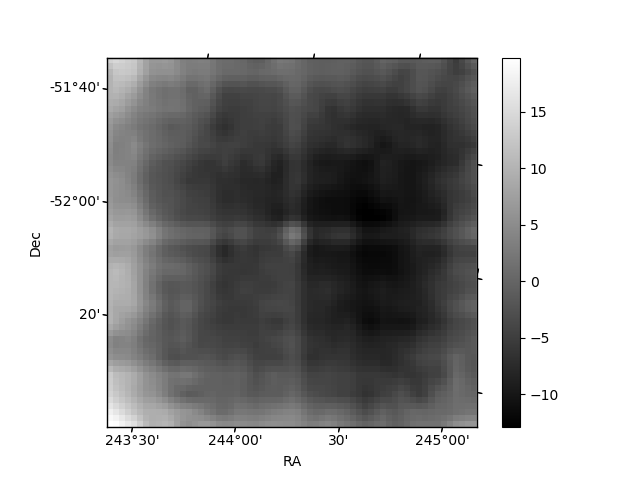
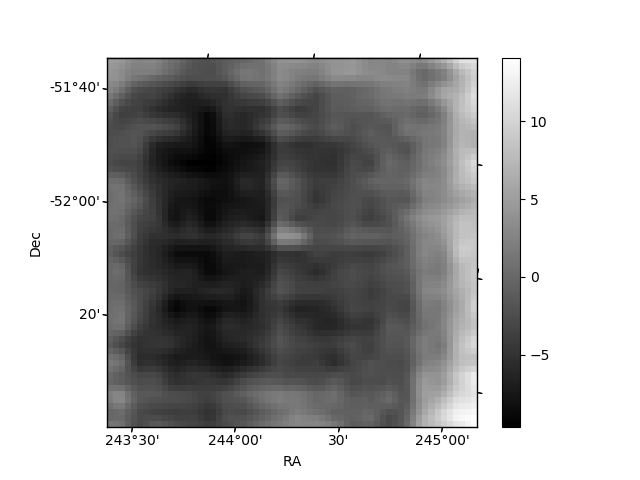
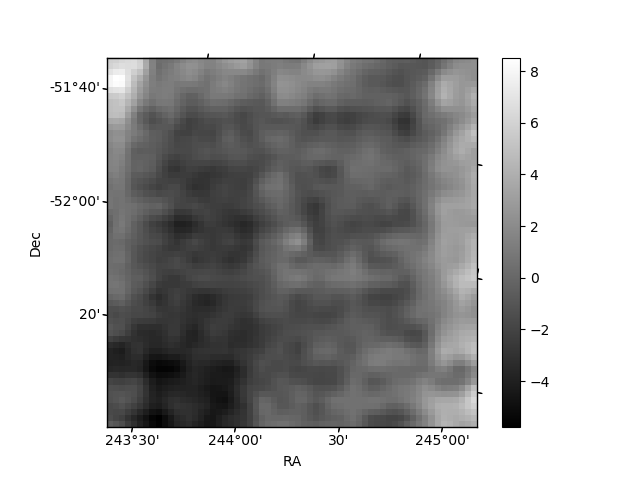
Histogram calculated using DETX and DETY for each event in the final _common_clean file
| Quadrant A | 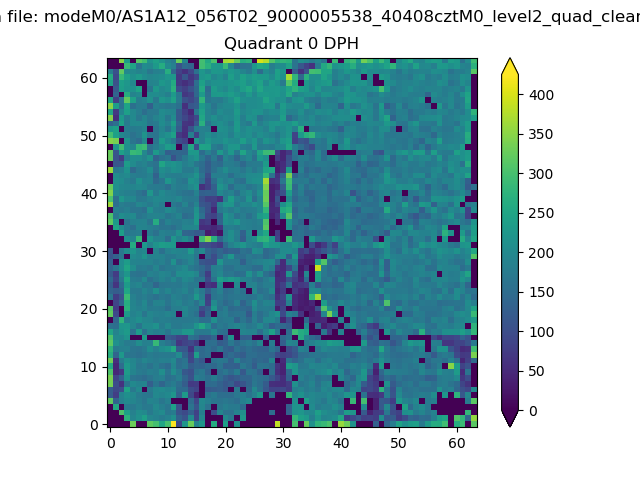 |
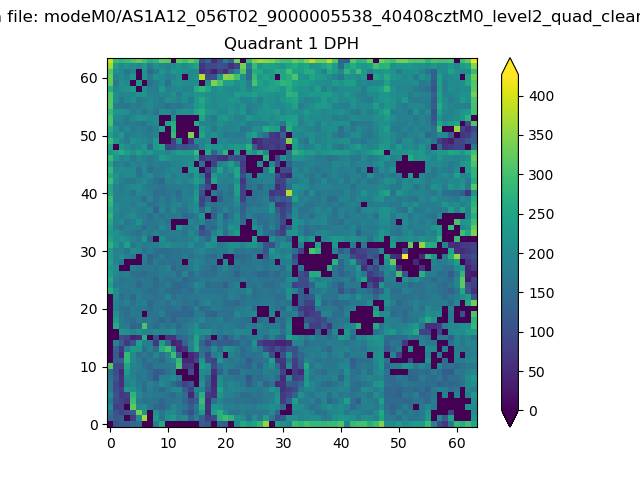 |
Quadrant B |
|---|---|---|---|
| Quadrant D | 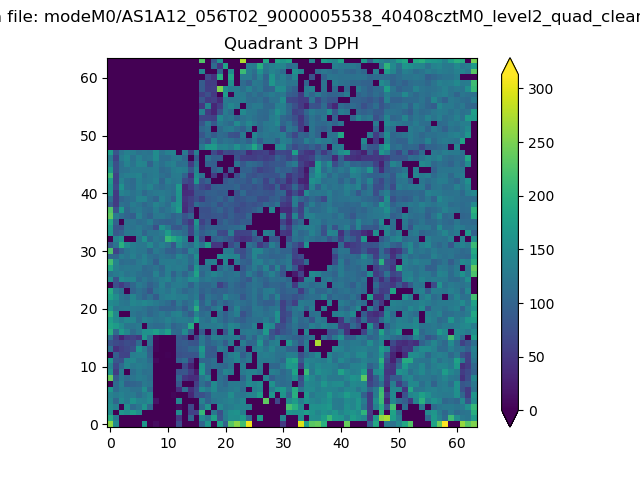 |
 |
Quadrant C |
| Plot type | Count rate plots | Images |
|---|---|---|
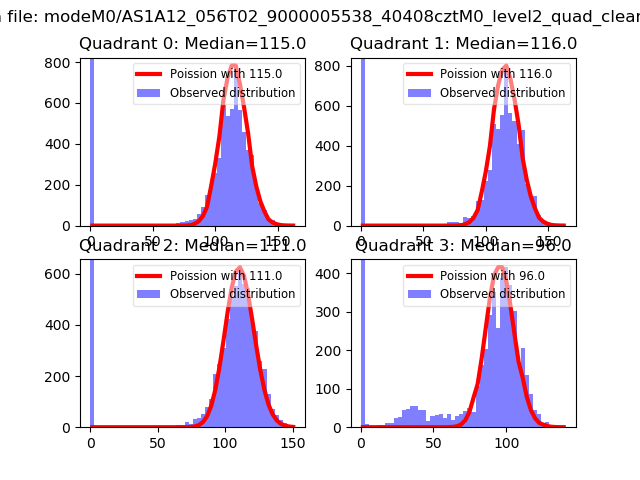
| Comparison with Poisson distribution Blue bars denote a histogram of data divided into 1 sec bins. Red curve is a Poisson curve with rate = median count rate of data. |
 |
 |
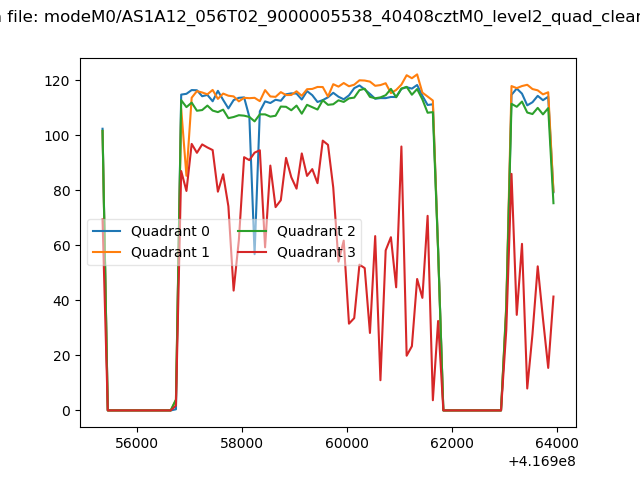
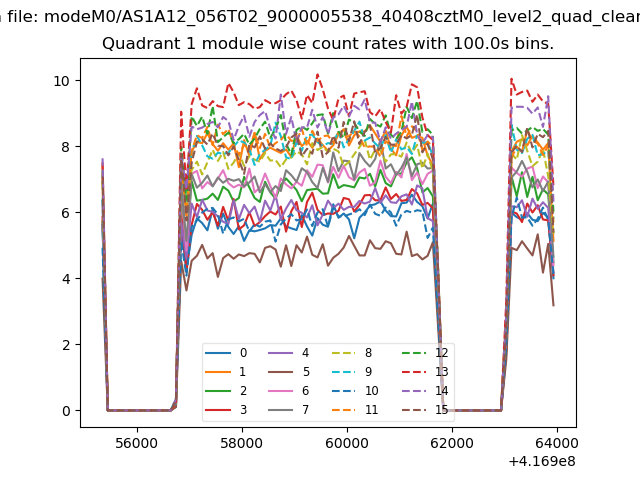
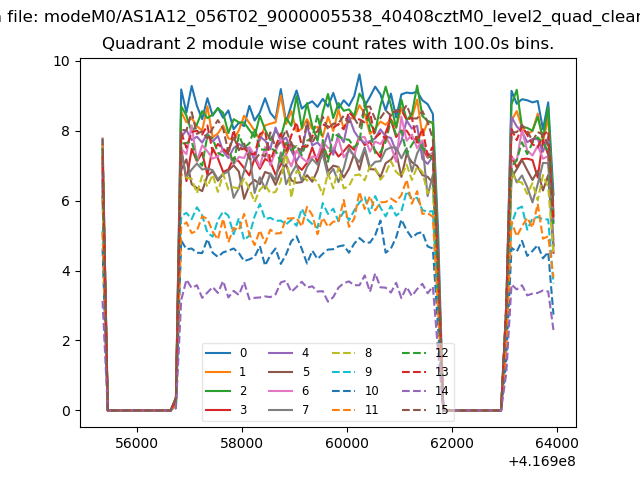
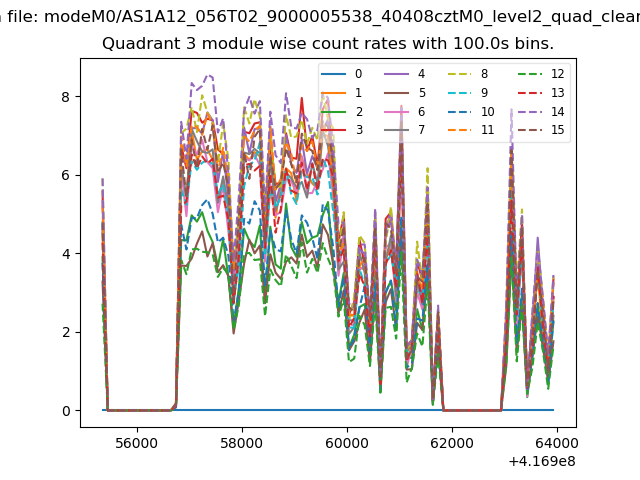
| Quadrant-wise count rates Data is divided into 100 sec bins |
 |
|
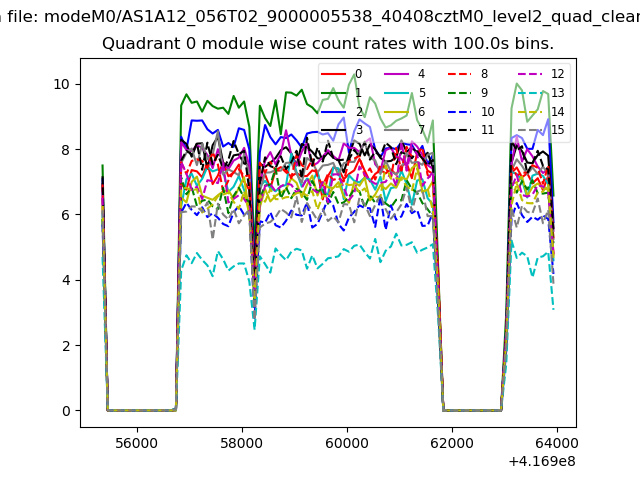
| Module-wise count rates for Quadrant A Data is divided into 100 sec bins |
 |
 |
| Module-wise count rates for Quadrant B Data is divided into 100 sec bins |
 |
 |
| Module-wise count rates for Quadrant C Data is divided into 100 sec bins |
 |
 |
| Module-wise count rates for Quadrant D Data is divided into 100 sec bins |
 |
 |
| Parameter | Plot |
|---|---|
| CZT HV Monitor | 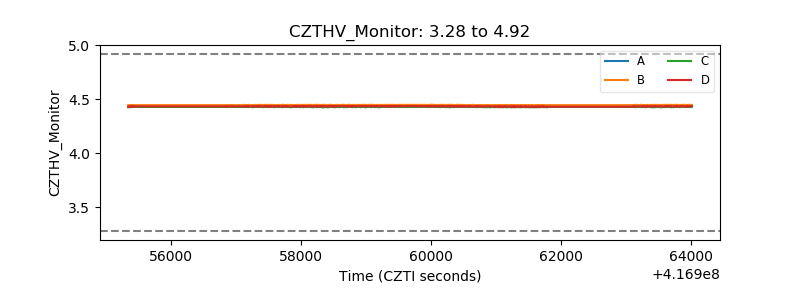 |
| D_VDD | 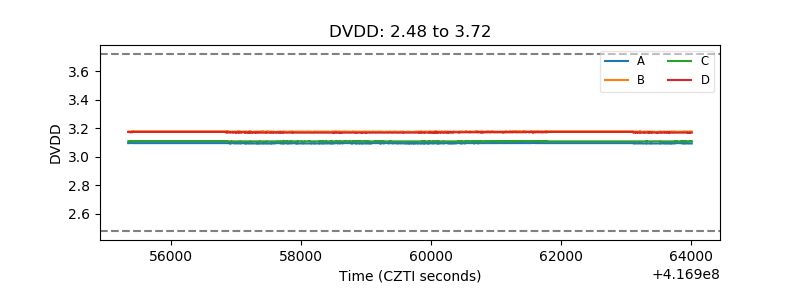 |
| Temperature 1 | 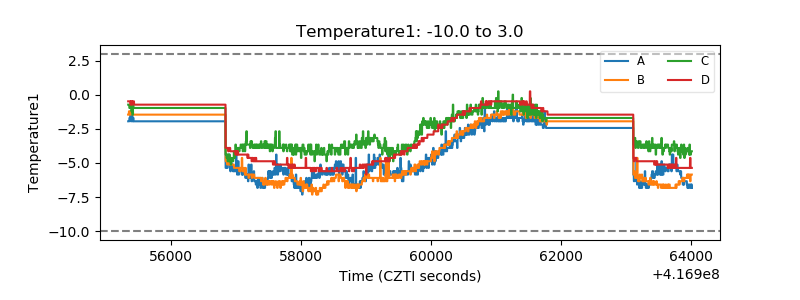 |
| Veto HV Monitor | 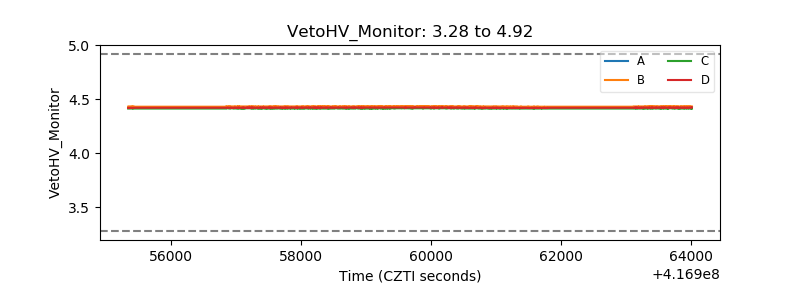 |
| Veto LLD | 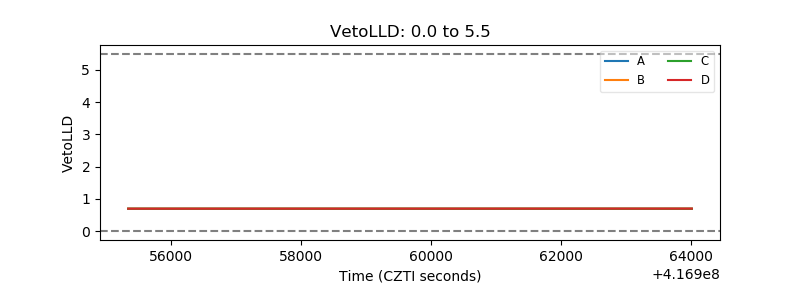 |
| Alpha Counter | 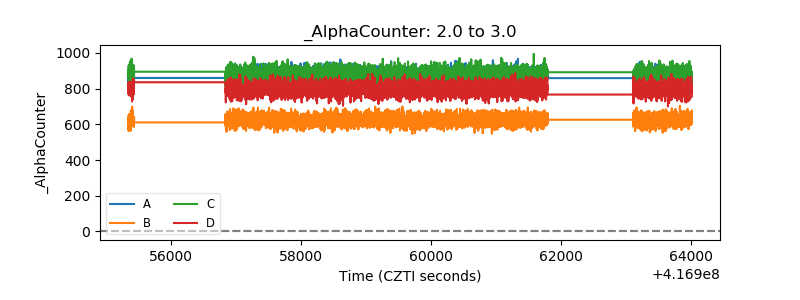 |
| _CPM_Rate | 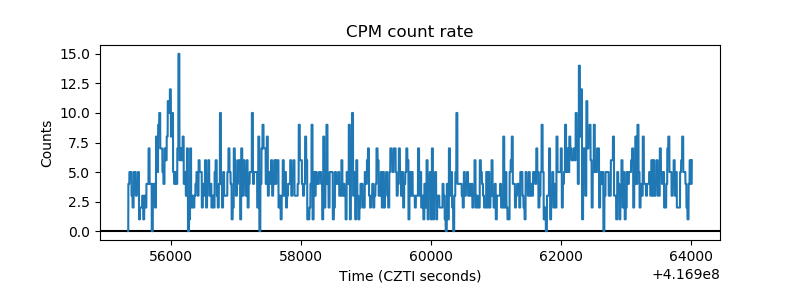 |
| CZT Counter | 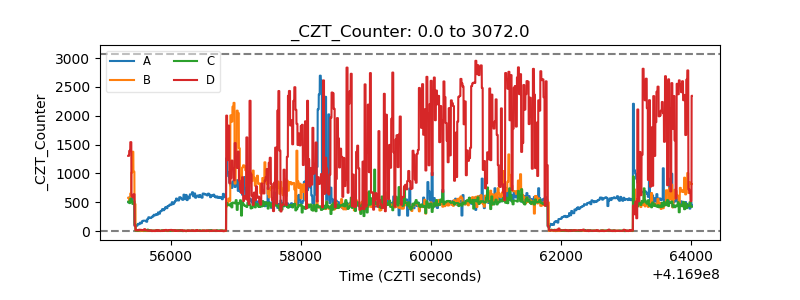 |
| +2.5 Volts monitor | 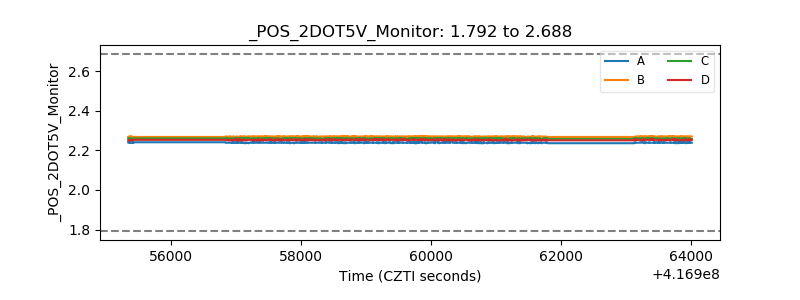 |
| +5 Volts monitor | 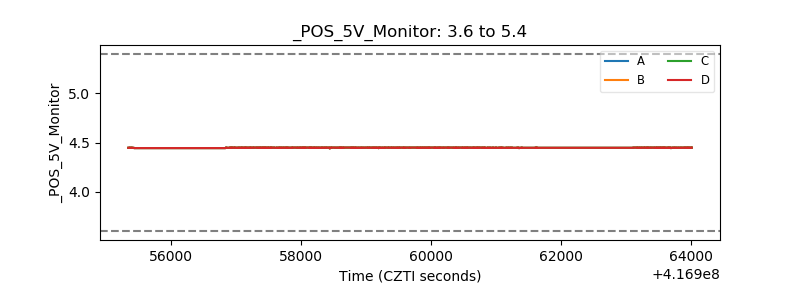 |
| _ROLL_ROT | 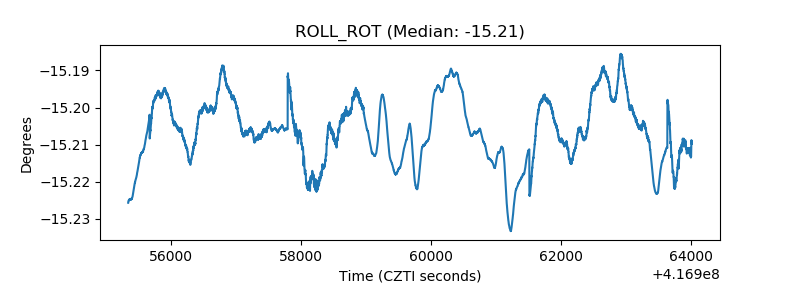 |
| _Roll_DEC | 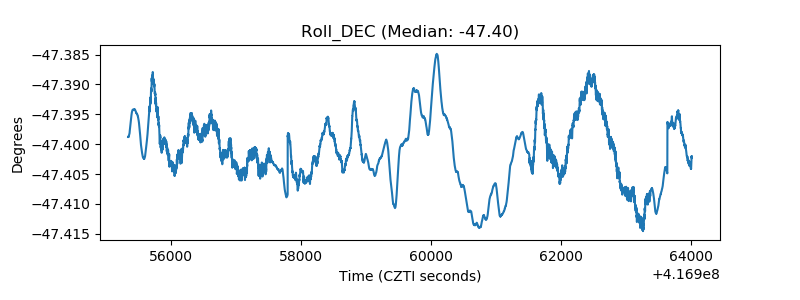 |
| _Roll_RA | 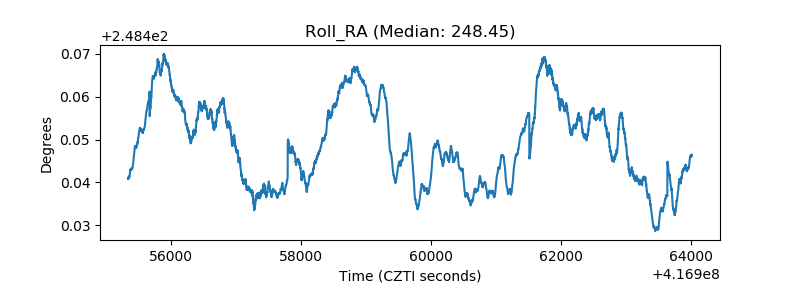 |
| Veto Counter | 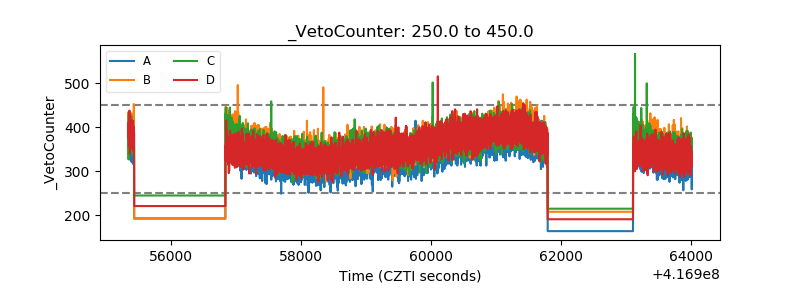 |