| Param | Original file | Final file |
|---|---|---|
| Filename | modeM0/AS1A12_056T02_9000005538_40411cztM0_level2.fits | modeM0/AS1A12_056T02_9000005538_40411cztM0_level2_quad_clean.evt |
| Size (bytes) | 1,021,616,640 | 174,643,200 |
| Size | 974.3 MB | 166.6 MB |
| Events in quadrant A | 7,565,729 | 1,254,927 |
| Events in quadrant B | 8,152,106 | 1,326,529 |
| Events in quadrant C | 5,728,134 | 1,289,739 |
| Events in quadrant D | 15,456,856 | 601,753 |
| Mode M0 | |||
|---|---|---|---|
| Quadrant | BADHDUFLAG | Total packets | Discarded packets |
| A | 0 | 29854 | 3 |
| B | 0 | 32500 | 3 |
| C | 0 | 24292 | 3 |
| D | 0 | 54190 | 3 |
| Mode M9 | |||
|---|---|---|---|
| Quadrant | BADHDUFLAG | Total packets | Discarded packets |
| A | 0 | 40 | 0 |
| B | 0 | 40 | 0 |
| C | 0 | 40 | 0 |
| D | 0 | 40 | 0 |
| Mode SS | |||
|---|---|---|---|
| Quadrant | BADHDUFLAG | Total packets | Discarded packets |
| A | 0 | 240 | 0 |
| B | 0 | 240 | 0 |
| C | 0 | 240 | 0 |
| D | 0 | 240 | 0 |
| Quadrant | Total seconds | Saturated seconds | Saturation percentage |
|---|---|---|---|
| A | 11777 | 543 | 4.610682% |
| B | 11777 | 263 | 2.233166% |
| C | 11777 | 29 | 0.246243% |
| D | 11777 | 6222 | 52.831791% |
Noise dominated data is calculated using 1-second bins in cleaned event files. If a bin has >2000 counts, and if more than 50% of those come from <1% of pixels, then it is considered to be noise-dominated and hence unusable.
| Quadrant | # 1 sec bins | Bins with >0 counts | Bins with >2000 counts | High rate bins dominated by noise | Noise dominated (total time) | Noise dominated (detector-on time) | Marked lightcurve |
|---|---|---|---|---|---|---|---|
| A | 15774 | 11780 | 282 | 282 | 1.79% | 2.39% | 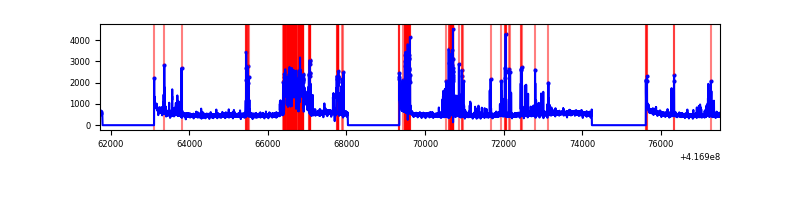 |
| B | 15774 | 11780 | 144 | 144 | 0.91% | 1.22% | 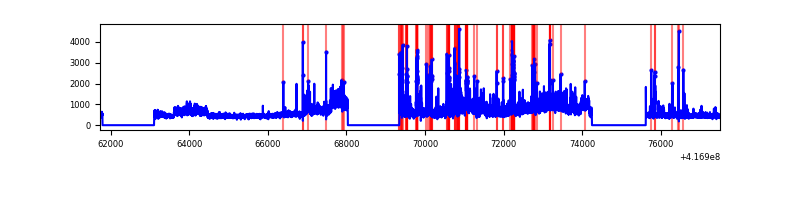 |
| C | 15774 | 11780 | 18 | 18 | 0.11% | 0.15% | 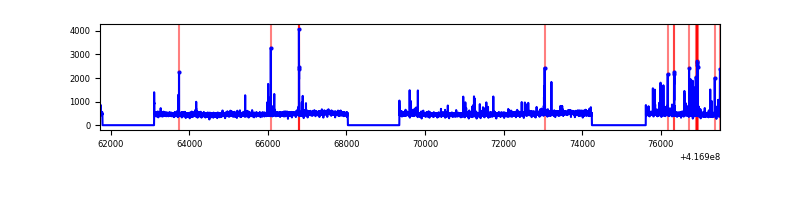 |
| D | 15774 | 11780 | 2920 | 2920 | 18.51% | 24.79% | 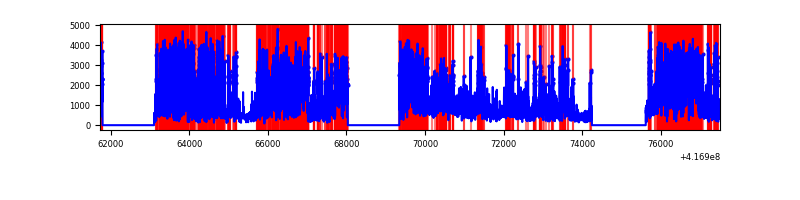 |
Top three noisy pixels from each quadrant. If the there are fewer than three noisy pixels in the level2.evt file, extra rows are filled as -1
| Pixel properties | Quadrant properties | ||||||
|---|---|---|---|---|---|---|---|
| Quadrant | DetID | PixID | Counts | Sigma | Mean | Median | Sigma |
| A | 15 | 235 | 989636 | 3822.05 | 1279 | 1253 | 258.6 |
| A | 10 | 83 | 935681 | 3613.41 | 1279 | 1253 | 258.6 |
| A | 13 | 248 | 646375 | 2494.67 | 1279 | 1253 | 258.6 |
| B | 7 | 202 | 1929403 | 7895.08 | 1280 | 1245 | 244.2 |
| B | 5 | 255 | 839913 | 3434.03 | 1280 | 1245 | 244.2 |
| B | 4 | 171 | 135046 | 547.86 | 1280 | 1245 | 244.2 |
| C | 15 | 214 | 504206 | 1697.54 | 1274 | 1284 | 296.3 |
| C | 14 | 254 | 214542 | 719.82 | 1274 | 1284 | 296.3 |
| C | 9 | 54 | 17338 | 54.19 | 1274 | 1284 | 296.3 |
| D | 2 | 250 | 9476179 | 42793.48 | 892 | 866 | 221.4 |
| D | 12 | 227 | 1050018 | 4738.3 | 892 | 866 | 221.4 |
| D | 13 | 171 | 501076 | 2259.11 | 892 | 866 | 221.4 |
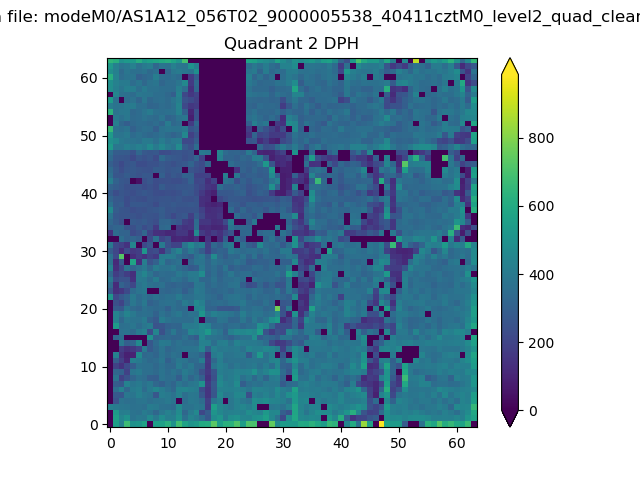
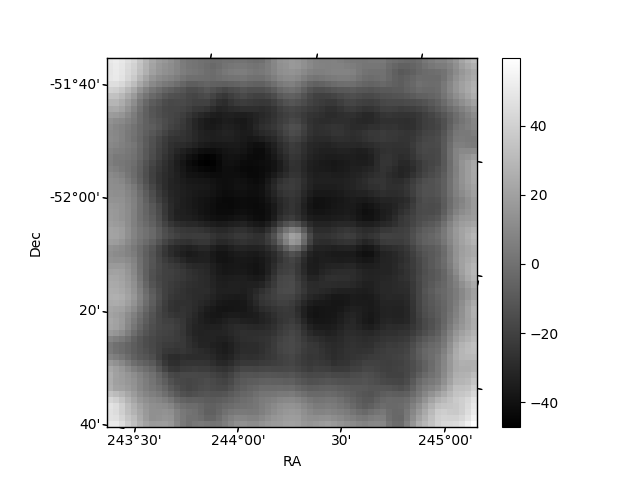
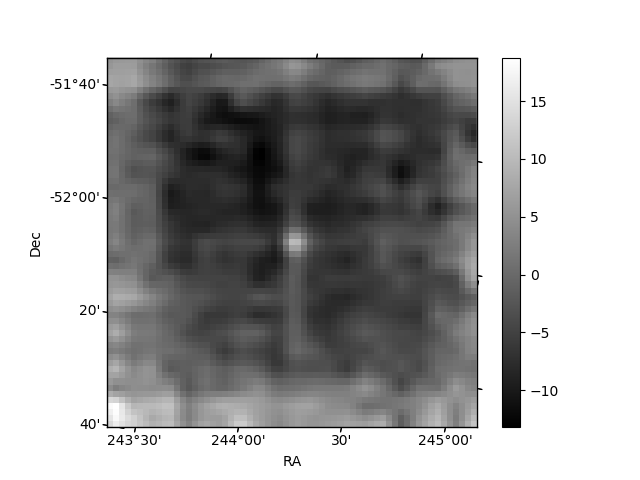
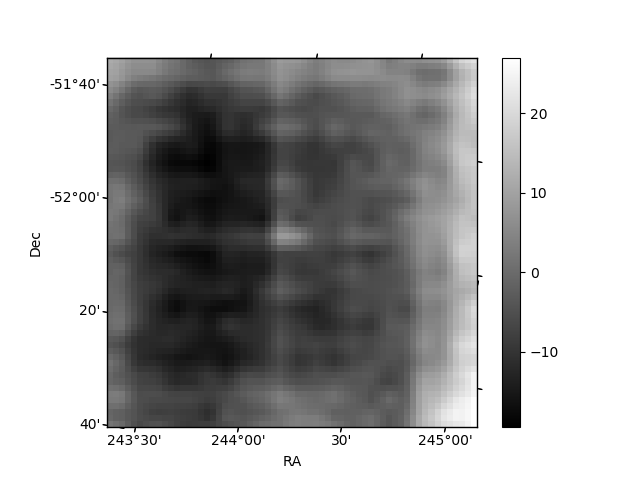
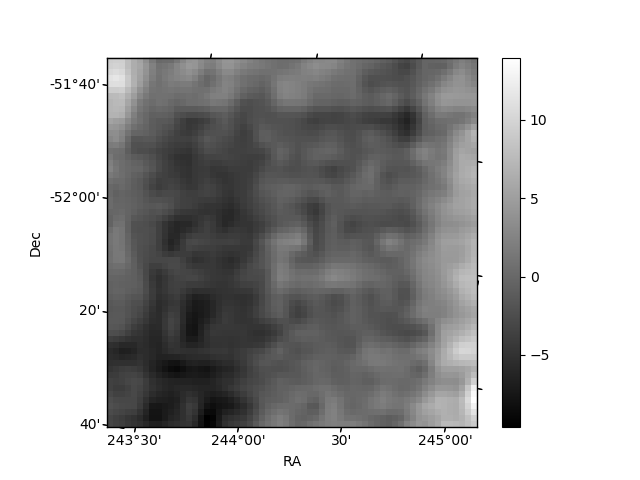
Histogram calculated using DETX and DETY for each event in the final _common_clean file
| Quadrant A | 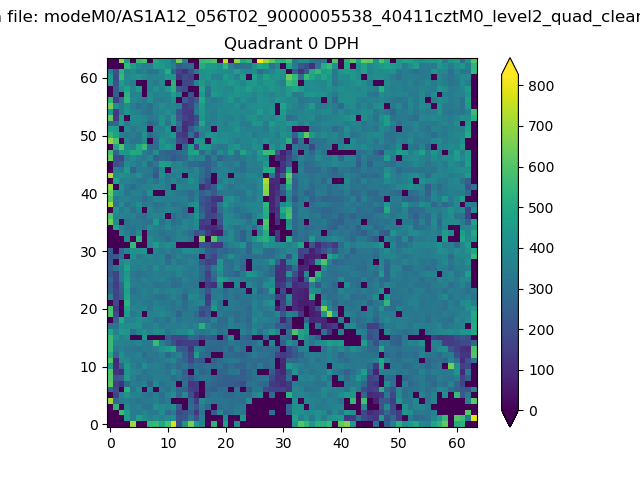 |
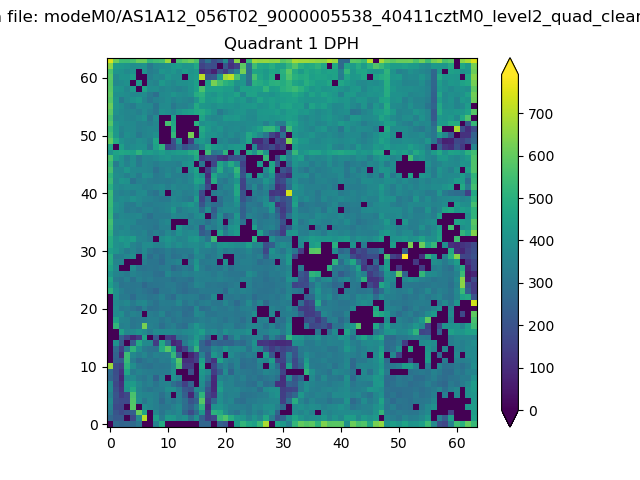 |
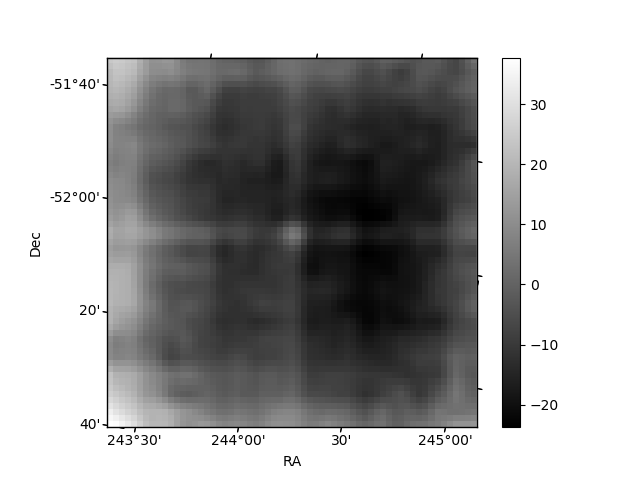
Quadrant B |
|---|---|---|---|
| Quadrant D | 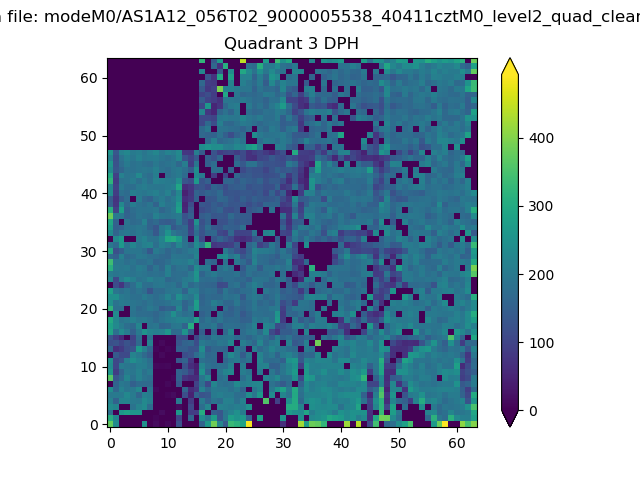 |
 |
Quadrant C |
| Plot type | Count rate plots | Images |
|---|---|---|
| Comparison with Poisson distribution Blue bars denote a histogram of data divided into 1 sec bins. Red curve is a Poisson curve with rate = median count rate of data. |
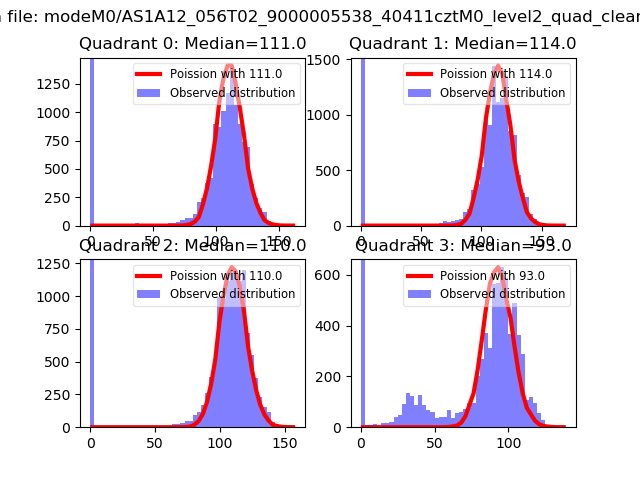 |
 |
| Quadrant-wise count rates Data is divided into 100 sec bins |
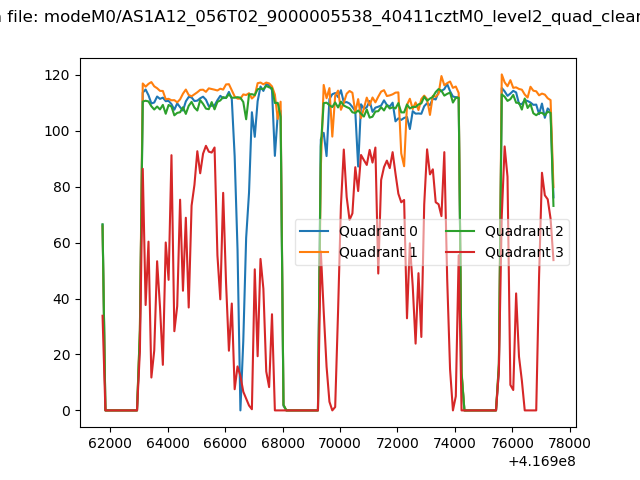 |
|
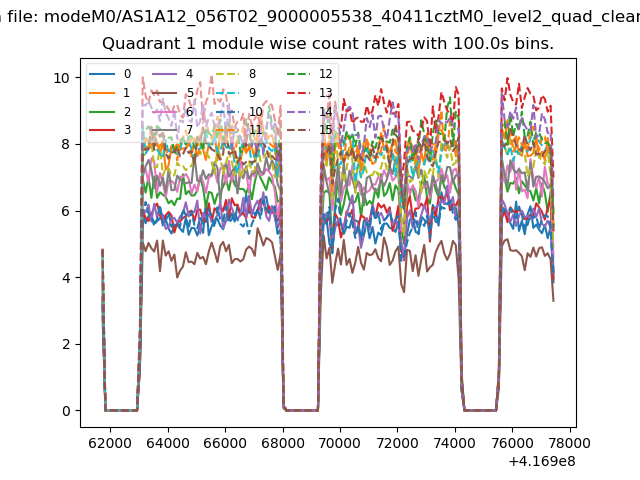
| Module-wise count rates for Quadrant A Data is divided into 100 sec bins |
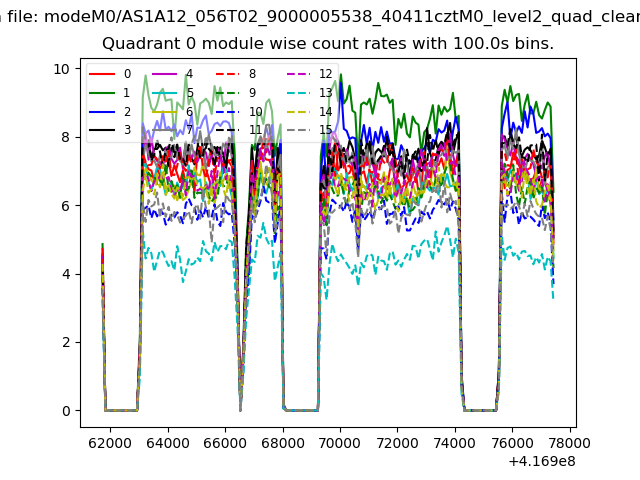 |
 |
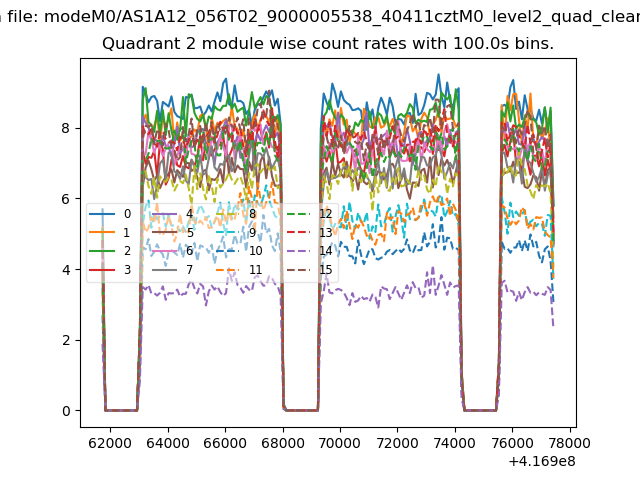
| Module-wise count rates for Quadrant B Data is divided into 100 sec bins |
 |
 |
| Module-wise count rates for Quadrant C Data is divided into 100 sec bins |
 |
 |
| Module-wise count rates for Quadrant D Data is divided into 100 sec bins |
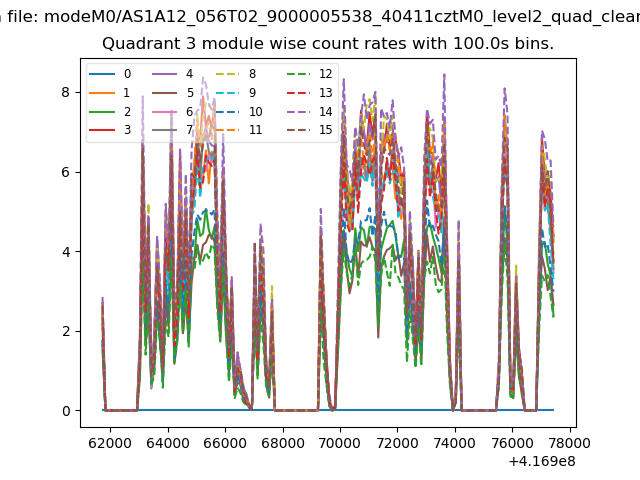 |
 |
| Parameter | Plot |
|---|---|
| CZT HV Monitor | 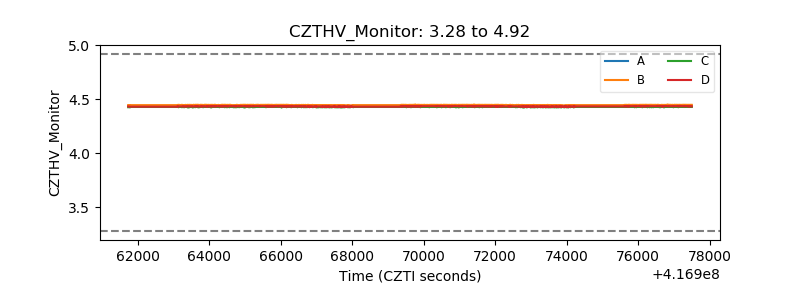 |
| D_VDD | 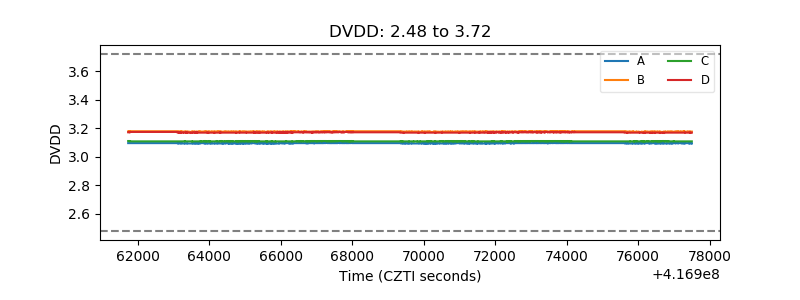 |
| Temperature 1 | 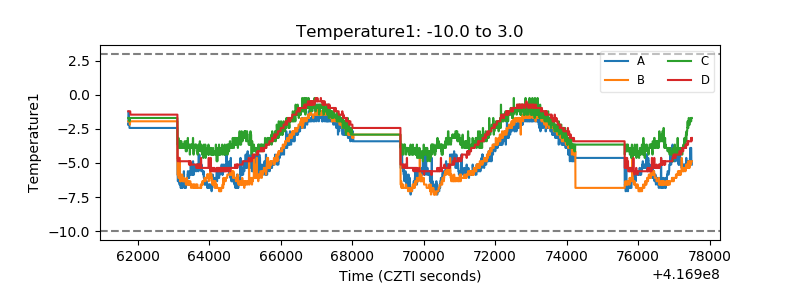 |
| Veto HV Monitor | 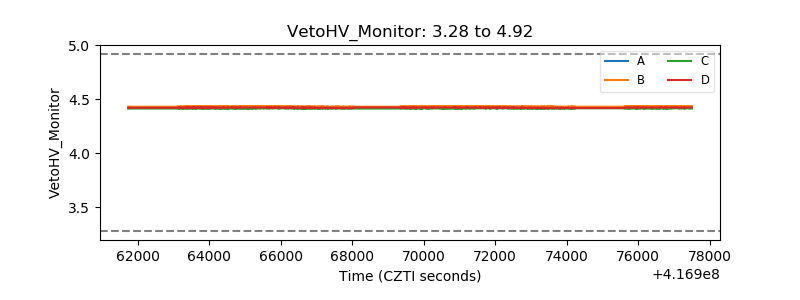 |
| Veto LLD | 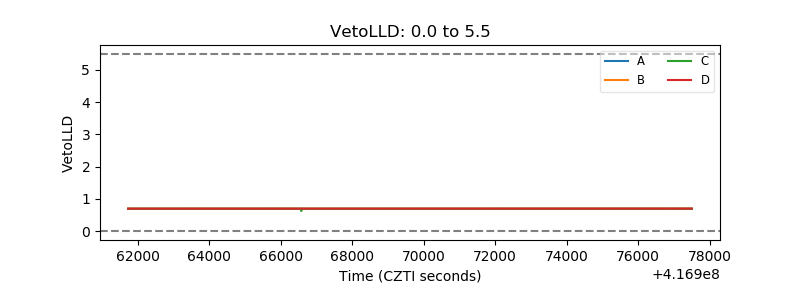 |
| Alpha Counter | 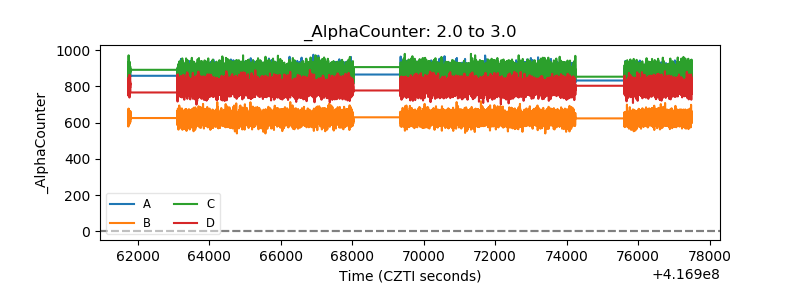 |
| _CPM_Rate | 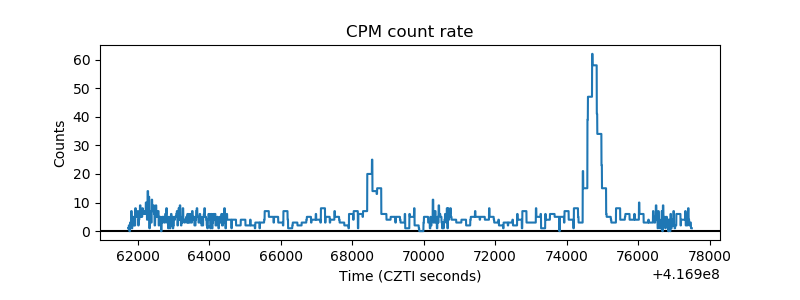 |
| CZT Counter | 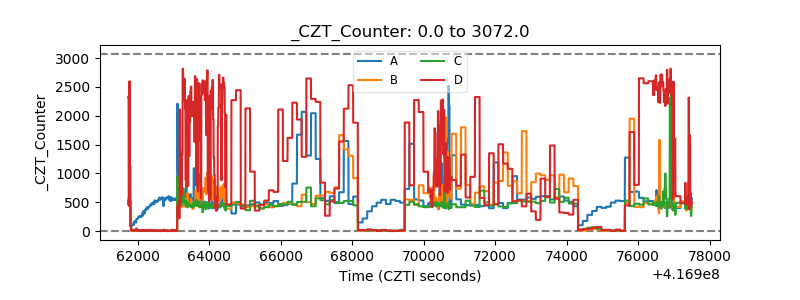 |
| +2.5 Volts monitor | 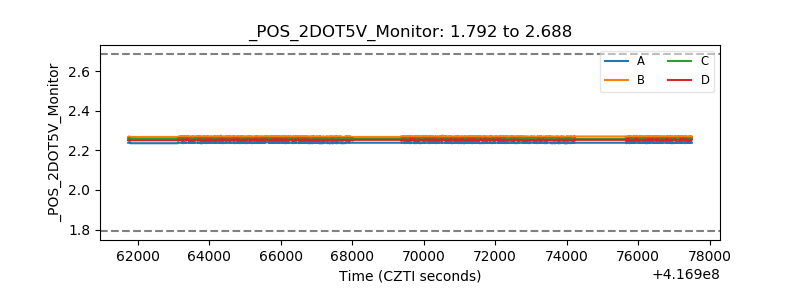 |
| +5 Volts monitor | 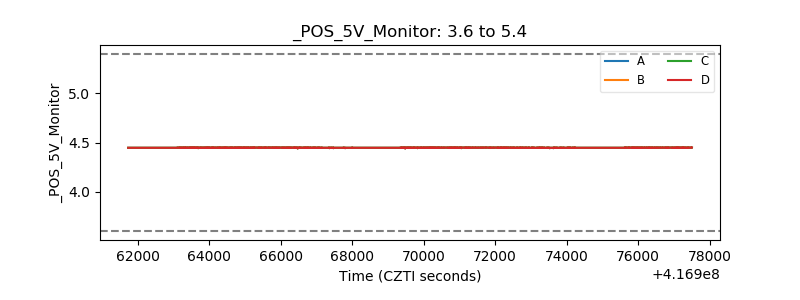 |
| _ROLL_ROT | 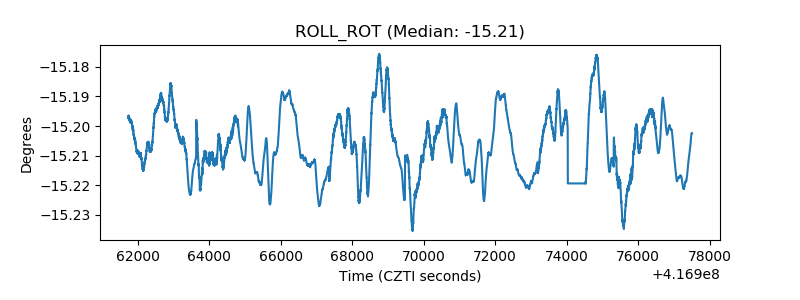 |
| _Roll_DEC | 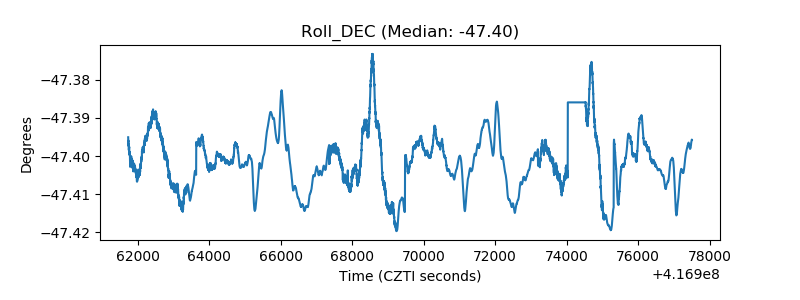 |
| _Roll_RA | 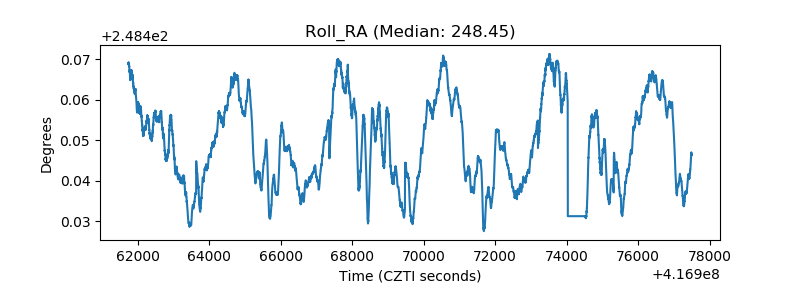 |
| Veto Counter | 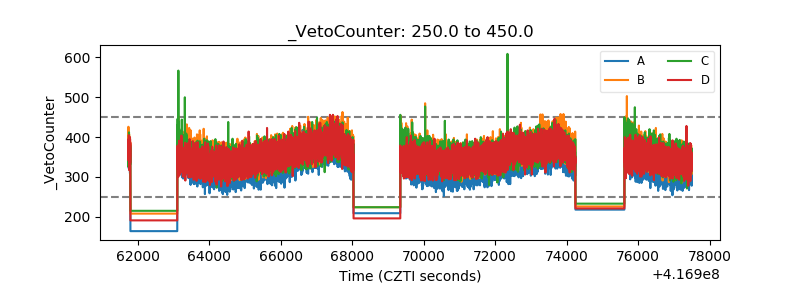 |