| Param | Original file | Final file |
|---|---|---|
| Filename | modeM0/AS1A12_022T01_9000005540_40411cztM0_level2.fits | modeM0/AS1A12_022T01_9000005540_40411cztM0_level2_quad_clean.evt |
| Size (bytes) | 265,152,960 | 40,374,720 |
| Size | 252.9 MB | 38.5 MB |
| Events in quadrant A | 1,562,319 | 309,841 |
| Events in quadrant B | 2,738,220 | 301,471 |
| Events in quadrant C | 1,427,351 | 302,056 |
| Events in quadrant D | 3,868,610 | 110,162 |
| Mode M0 | |||
|---|---|---|---|
| Quadrant | BADHDUFLAG | Total packets | Discarded packets |
| A | 0 | 6205 | 2 |
| B | 0 | 10064 | 1 |
| C | 0 | 5898 | 1 |
| D | 0 | 13402 | 1 |
| Mode M9 | |||
|---|---|---|---|
| Quadrant | BADHDUFLAG | Total packets | Discarded packets |
| A | 0 | 15 | 0 |
| B | 0 | 15 | 0 |
| C | 0 | 15 | 0 |
| D | 0 | 15 | 0 |
| Mode SS | |||
|---|---|---|---|
| Quadrant | BADHDUFLAG | Total packets | Discarded packets |
| A | 0 | 58 | 0 |
| B | 0 | 58 | 0 |
| C | 0 | 58 | 0 |
| D | 0 | 58 | 0 |
| Quadrant | Total seconds | Saturated seconds | Saturation percentage |
|---|---|---|---|
| A | 2782 | 7 | 0.251618% |
| B | 2782 | 208 | 7.476636% |
| C | 2782 | 11 | 0.395399% |
| D | 2782 | 1734 | 62.329260% |
Noise dominated data is calculated using 1-second bins in cleaned event files. If a bin has >2000 counts, and if more than 50% of those come from <1% of pixels, then it is considered to be noise-dominated and hence unusable.
| Quadrant | # 1 sec bins | Bins with >0 counts | Bins with >2000 counts | High rate bins dominated by noise | Noise dominated (total time) | Noise dominated (detector-on time) | Marked lightcurve |
|---|---|---|---|---|---|---|---|
| A | 4275 | 2783 | 3 | 3 | 0.07% | 0.11% | 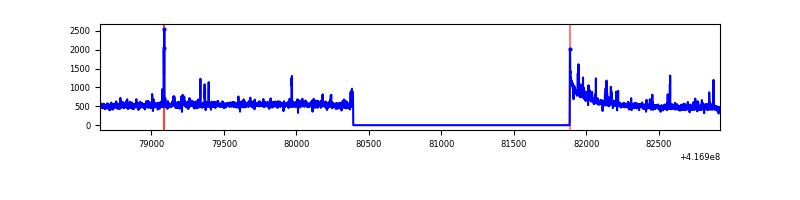 |
| B | 4275 | 2783 | 97 | 97 | 2.27% | 3.49% | 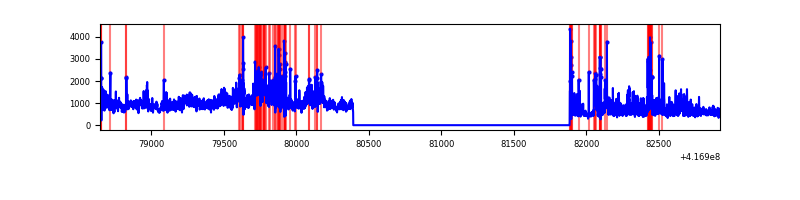 |
| C | 4275 | 2783 | 6 | 6 | 0.14% | 0.22% | 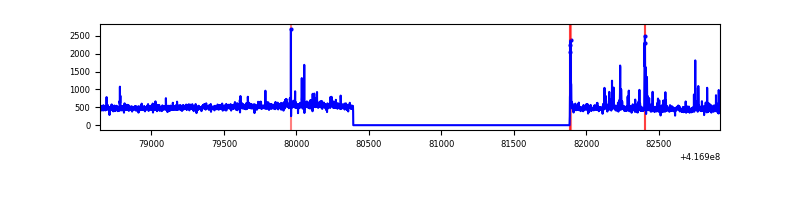 |
| D | 4275 | 2782 | 912 | 912 | 21.33% | 32.78% | 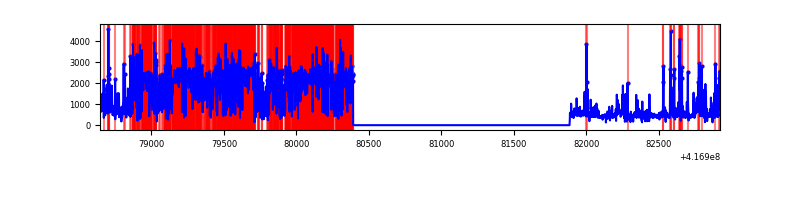 |
Top three noisy pixels from each quadrant. If the there are fewer than three noisy pixels in the level2.evt file, extra rows are filled as -1
| Pixel properties | Quadrant properties | ||||||
|---|---|---|---|---|---|---|---|
| Quadrant | DetID | PixID | Counts | Sigma | Mean | Median | Sigma |
| A | 10 | 83 | 264191 | 3992.26 | 314 | 308 | 66.1 |
| A | 13 | 248 | 39144 | 587.55 | 314 | 308 | 66.1 |
| A | 15 | 235 | 25998 | 388.66 | 314 | 308 | 66.1 |
| B | 7 | 202 | 998645 | 16398.36 | 307 | 298 | 60.9 |
| B | 5 | 255 | 328783 | 5395.53 | 307 | 298 | 60.9 |
| B | 4 | 171 | 134562 | 2205.36 | 307 | 298 | 60.9 |
| C | 15 | 214 | 122857 | 1654.99 | 310 | 311 | 74.0 |
| C | 14 | 254 | 80614 | 1084.5 | 310 | 311 | 74.0 |
| C | 3 | 233 | 12288 | 161.75 | 310 | 311 | 74.0 |
| D | 2 | 250 | 2902166 | 65897.04 | 171 | 166 | 44.0 |
| D | 12 | 191 | 96728 | 2192.68 | 171 | 166 | 44.0 |
| D | 12 | 227 | 62563 | 1416.88 | 171 | 166 | 44.0 |
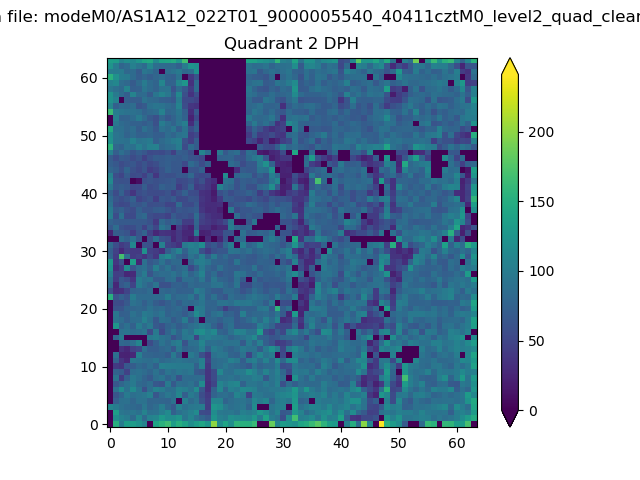
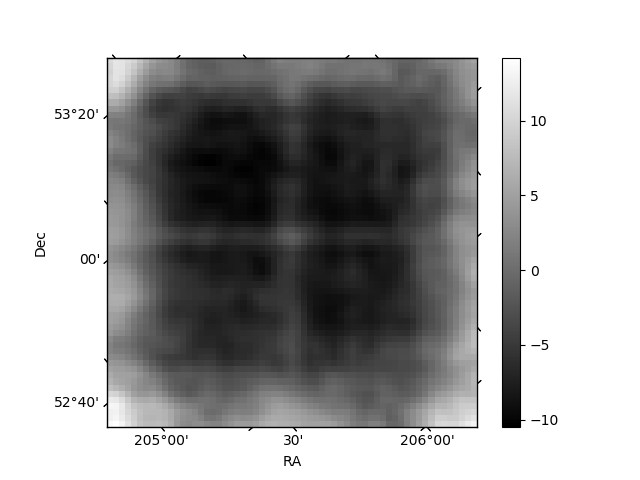
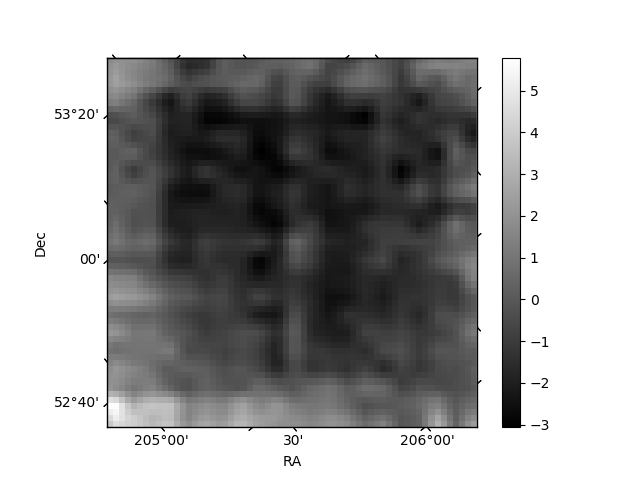
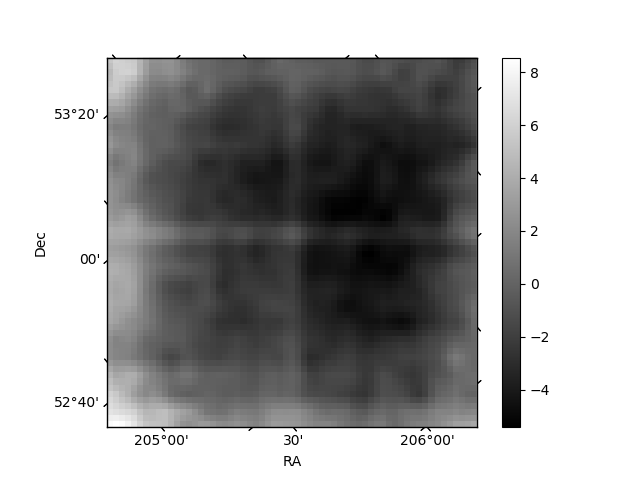
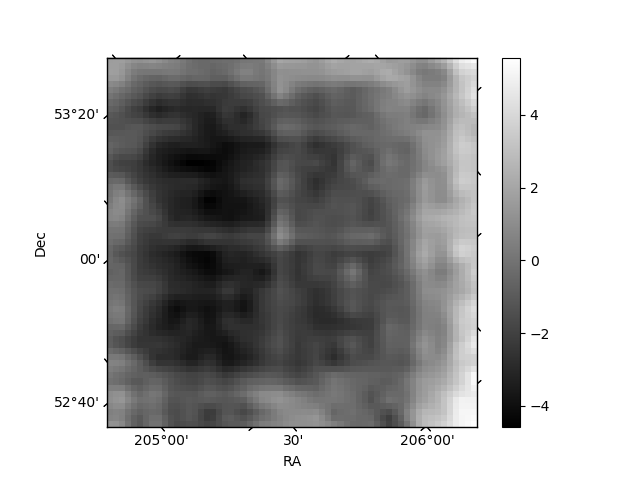
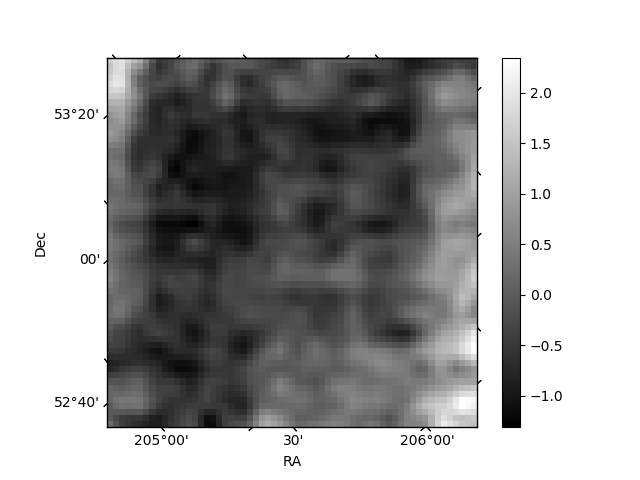
Histogram calculated using DETX and DETY for each event in the final _common_clean file
| Quadrant A | 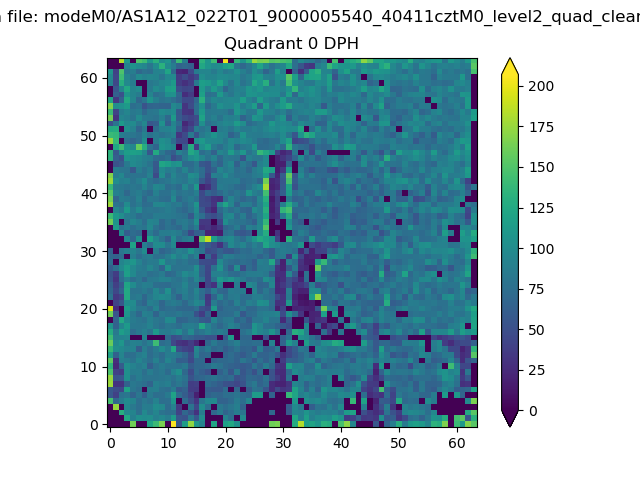 |
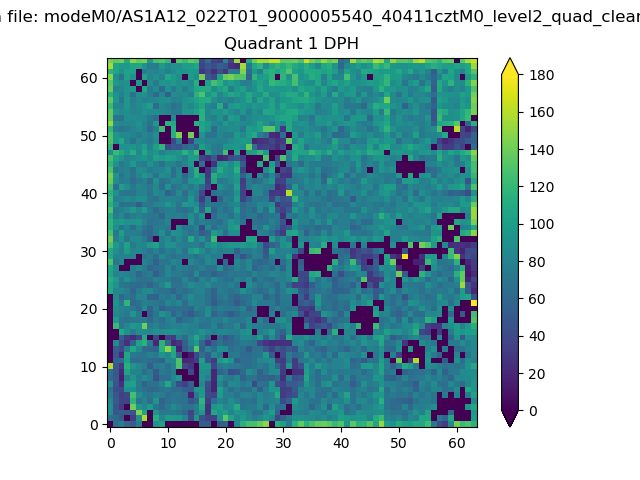 |
Quadrant B |
|---|---|---|---|
| Quadrant D | 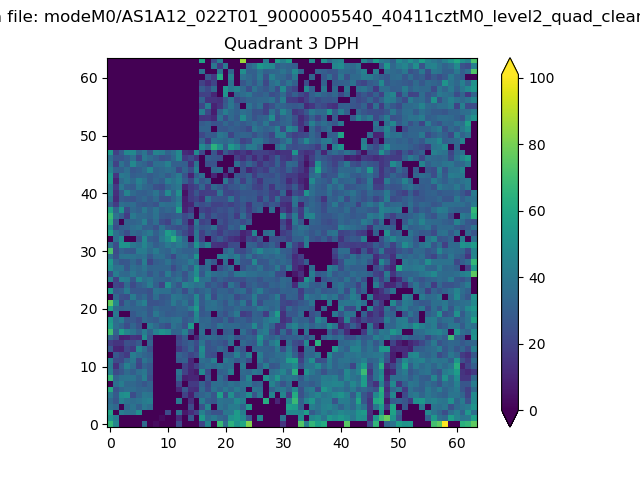 |
 |
Quadrant C |
| Plot type | Count rate plots | Images |
|---|---|---|
| Comparison with Poisson distribution Blue bars denote a histogram of data divided into 1 sec bins. Red curve is a Poisson curve with rate = median count rate of data. |
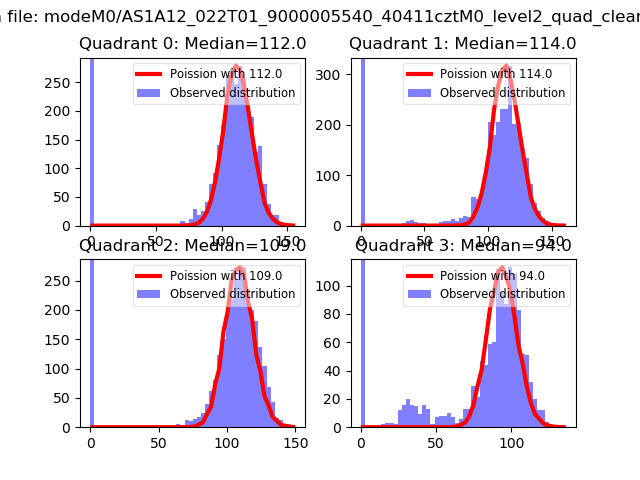 |
 |
| Quadrant-wise count rates Data is divided into 100 sec bins |
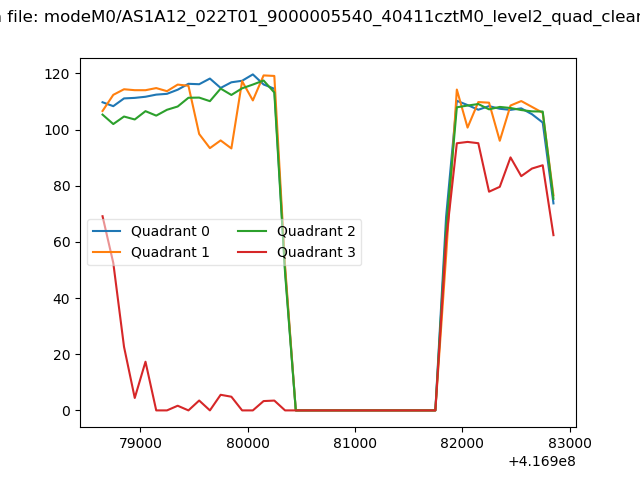 |
|
| Module-wise count rates for Quadrant A Data is divided into 100 sec bins |
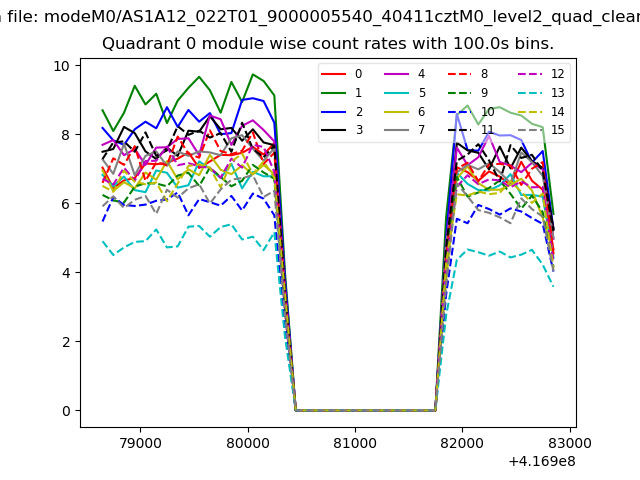 |
 |
| Module-wise count rates for Quadrant B Data is divided into 100 sec bins |
 |
 |
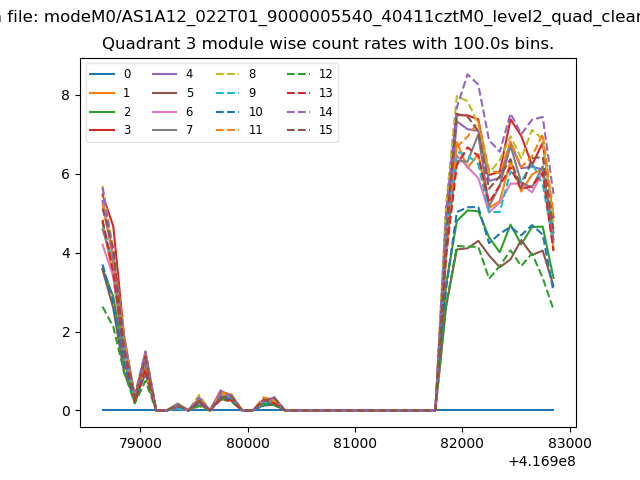
| Module-wise count rates for Quadrant C Data is divided into 100 sec bins |
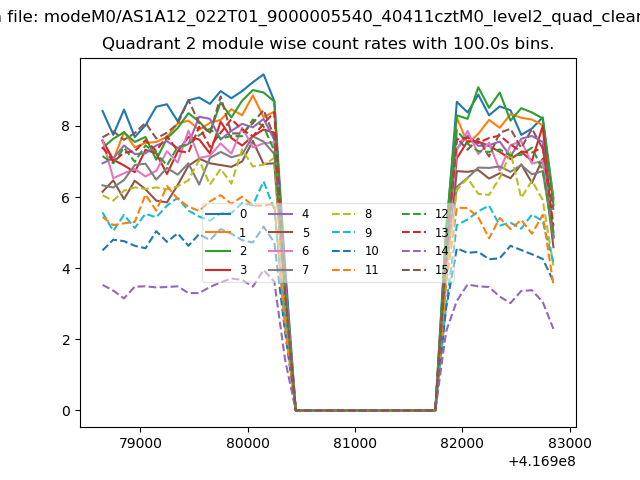 |
 |
| Module-wise count rates for Quadrant D Data is divided into 100 sec bins |
 |
 |
| Parameter | Plot |
|---|---|
| CZT HV Monitor | 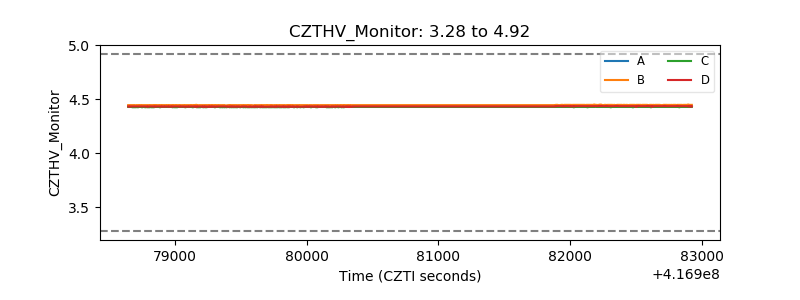 |
| D_VDD | 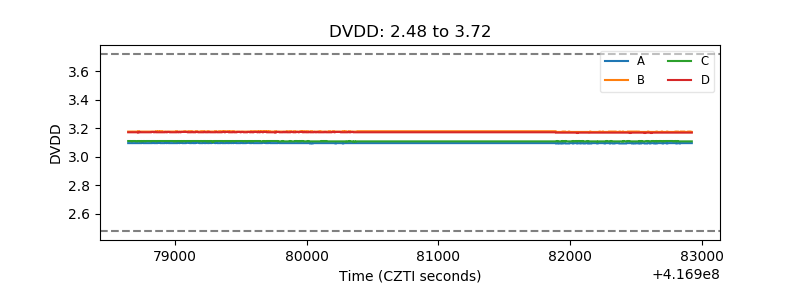 |
| Temperature 1 | 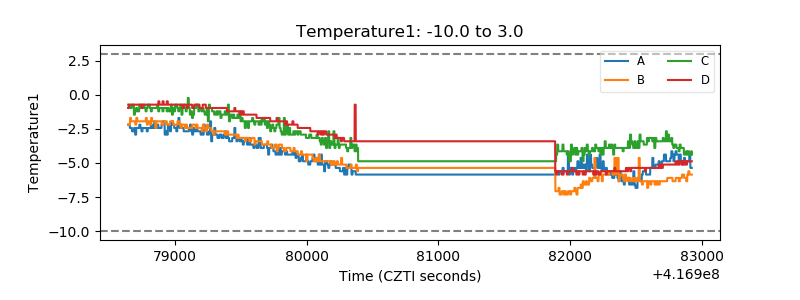 |
| Veto HV Monitor | 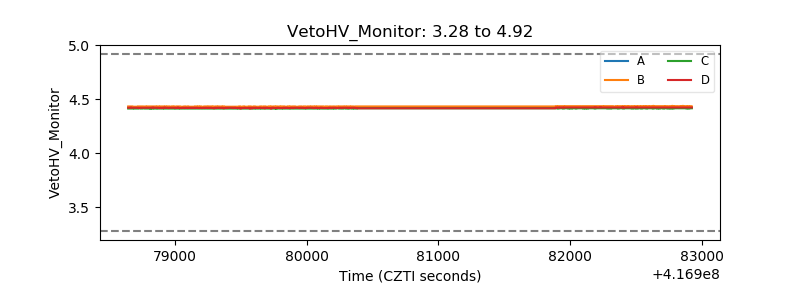 |
| Veto LLD | 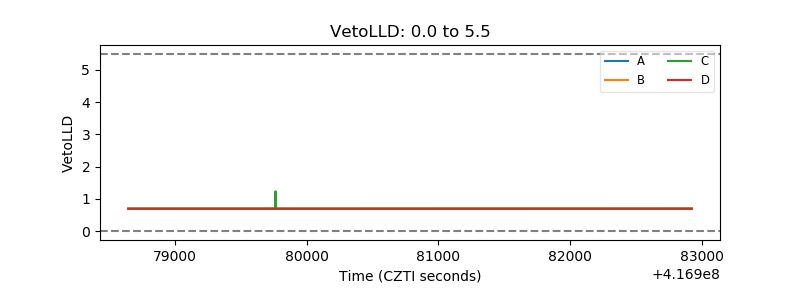 |
| Alpha Counter | 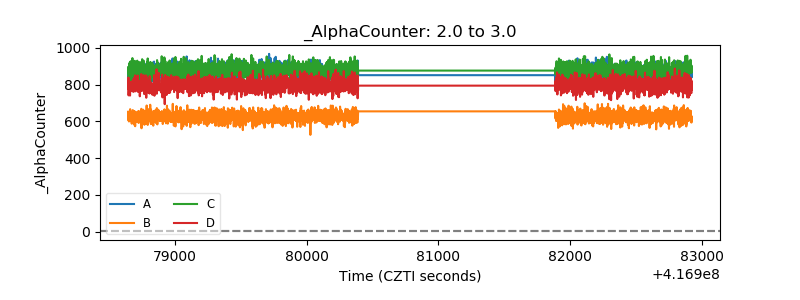 |
| _CPM_Rate | 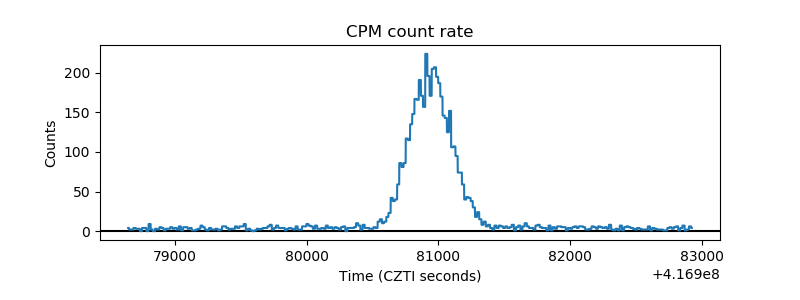 |
| CZT Counter | 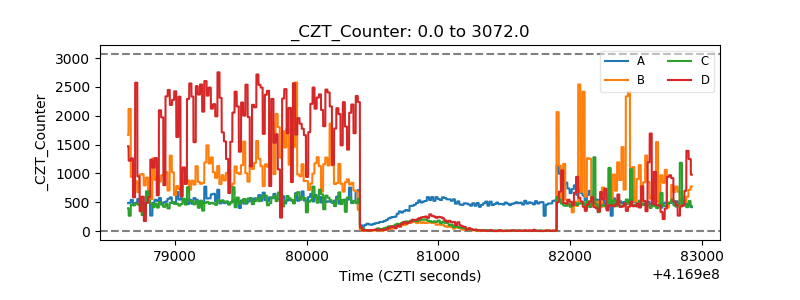 |
| +2.5 Volts monitor | 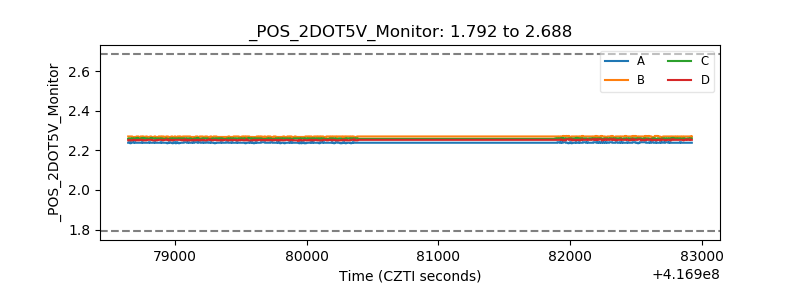 |
| +5 Volts monitor | 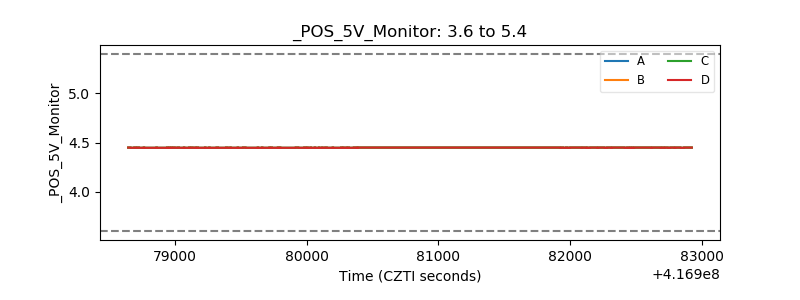 |
| _ROLL_ROT | 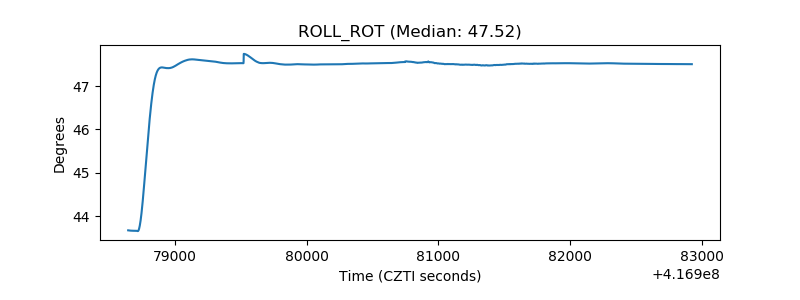 |
| _Roll_DEC | 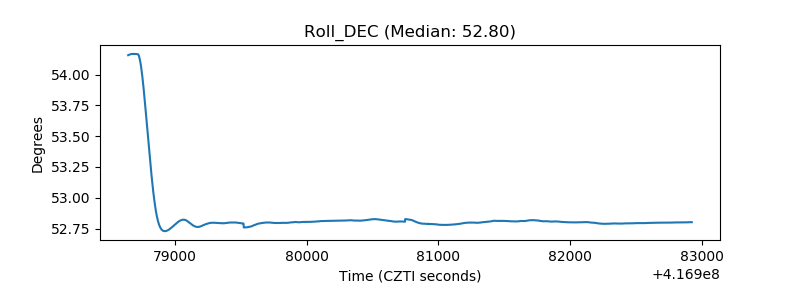 |
| _Roll_RA | 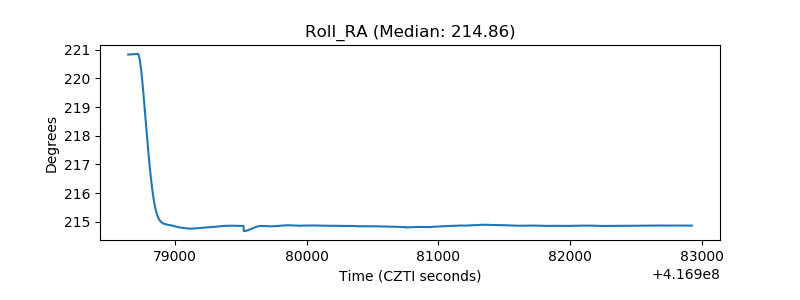 |
| Veto Counter | 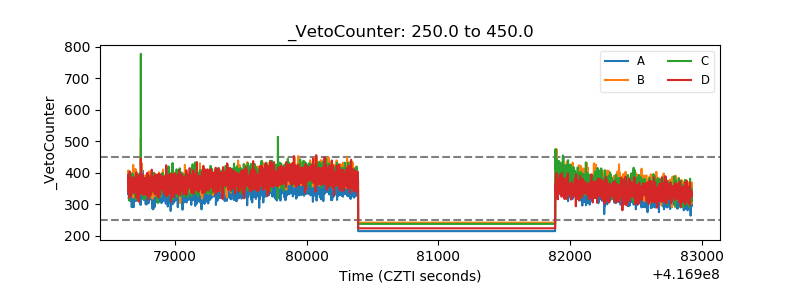 |