| Param | Original file | Final file |
|---|---|---|
| Filename | modeM0/AS1A12_022T01_9000005540_40412cztM0_level2.fits | modeM0/AS1A12_022T01_9000005540_40412cztM0_level2_quad_clean.evt |
| Size (bytes) | 523,808,640 | 78,894,720 |
| Size | 499.5 MB | 75.2 MB |
| Events in quadrant A | 3,131,695 | 595,883 |
| Events in quadrant B | 4,359,523 | 588,361 |
| Events in quadrant C | 2,783,730 | 588,874 |
| Events in quadrant D | 8,682,427 | 227,515 |
| Mode M0 | |||
|---|---|---|---|
| Quadrant | BADHDUFLAG | Total packets | Discarded packets |
| A | 0 | 12666 | 3 |
| B | 0 | 16665 | 2 |
| C | 0 | 11784 | 2 |
| D | 0 | 29610 | 2 |
| Mode M9 | |||
|---|---|---|---|
| Quadrant | BADHDUFLAG | Total packets | Discarded packets |
| A | 0 | 27 | 0 |
| B | 0 | 27 | 0 |
| C | 0 | 27 | 0 |
| D | 0 | 28 | 0 |
| Mode SS | |||
|---|---|---|---|
| Quadrant | BADHDUFLAG | Total packets | Discarded packets |
| A | 0 | 112 | 0 |
| B | 0 | 112 | 0 |
| C | 0 | 112 | 0 |
| D | 0 | 112 | 0 |
| Quadrant | Total seconds | Saturated seconds | Saturation percentage |
|---|---|---|---|
| A | 5549 | 84 | 1.513786% |
| B | 5549 | 367 | 6.613804% |
| C | 5549 | 22 | 0.396468% |
| D | 5549 | 3372 | 60.767706% |
Noise dominated data is calculated using 1-second bins in cleaned event files. If a bin has >2000 counts, and if more than 50% of those come from <1% of pixels, then it is considered to be noise-dominated and hence unusable.
| Quadrant | # 1 sec bins | Bins with >0 counts | Bins with >2000 counts | High rate bins dominated by noise | Noise dominated (total time) | Noise dominated (detector-on time) | Marked lightcurve |
|---|---|---|---|---|---|---|---|
| A | 7192 | 5550 | 61 | 61 | 0.85% | 1.10% | 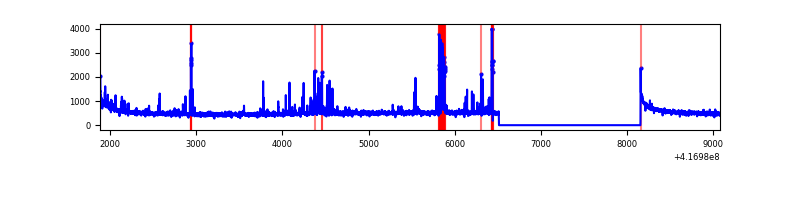 |
| B | 7192 | 5550 | 251 | 251 | 3.49% | 4.52% | 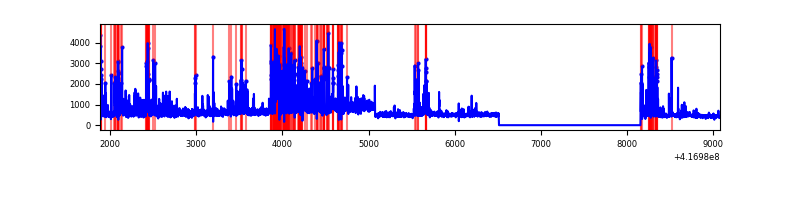 |
| C | 7192 | 5550 | 13 | 13 | 0.18% | 0.23% | 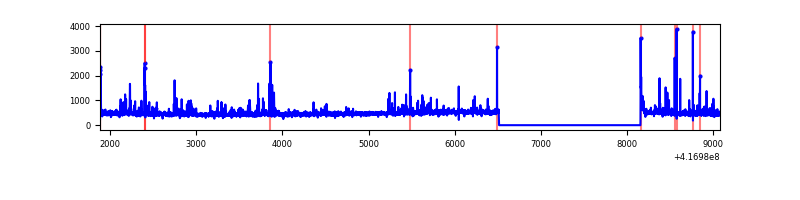 |
| D | 7192 | 5549 | 2174 | 2174 | 30.23% | 39.18% | 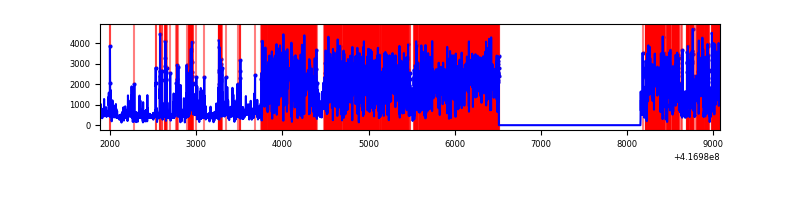 |
Top three noisy pixels from each quadrant. If the there are fewer than three noisy pixels in the level2.evt file, extra rows are filled as -1
| Pixel properties | Quadrant properties | ||||||
|---|---|---|---|---|---|---|---|
| Quadrant | DetID | PixID | Counts | Sigma | Mean | Median | Sigma |
| A | 10 | 83 | 490034 | 3988.7 | 598 | 585 | 122.7 |
| A | 13 | 248 | 308220 | 2507.03 | 598 | 585 | 122.7 |
| A | 15 | 235 | 12041 | 93.36 | 598 | 585 | 122.7 |
| B | 5 | 255 | 1091701 | 9602.89 | 582 | 566 | 113.6 |
| B | 7 | 202 | 865444 | 7611.64 | 582 | 566 | 113.6 |
| B | 3 | 112 | 54190 | 471.94 | 582 | 566 | 113.6 |
| C | 15 | 214 | 242095 | 1754.62 | 585 | 588 | 137.6 |
| C | 14 | 254 | 182958 | 1324.97 | 585 | 588 | 137.6 |
| C | 3 | 233 | 58979 | 424.23 | 585 | 588 | 137.6 |
| D | 2 | 250 | 6873015 | 75477.9 | 367 | 356 | 91.1 |
| D | 12 | 191 | 145434 | 1593.3 | 367 | 356 | 91.1 |
| D | 9 | 19 | 62961 | 687.55 | 367 | 356 | 91.1 |
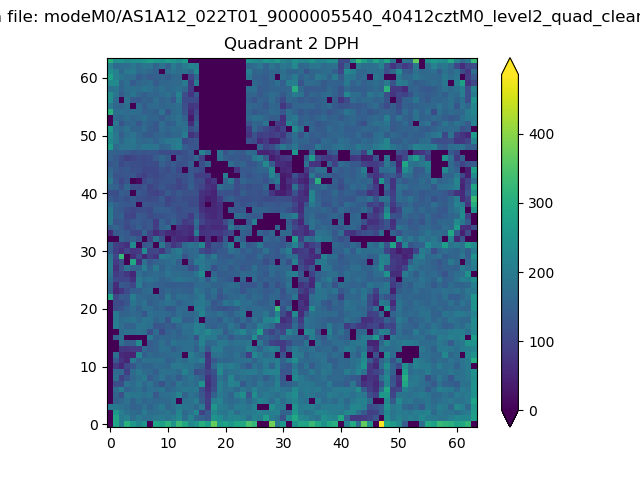
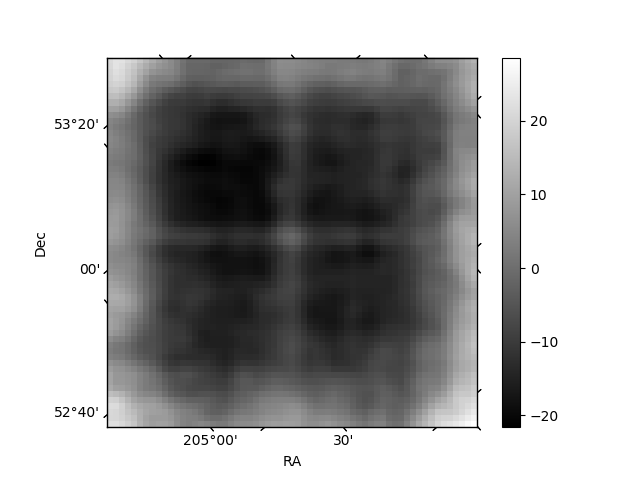
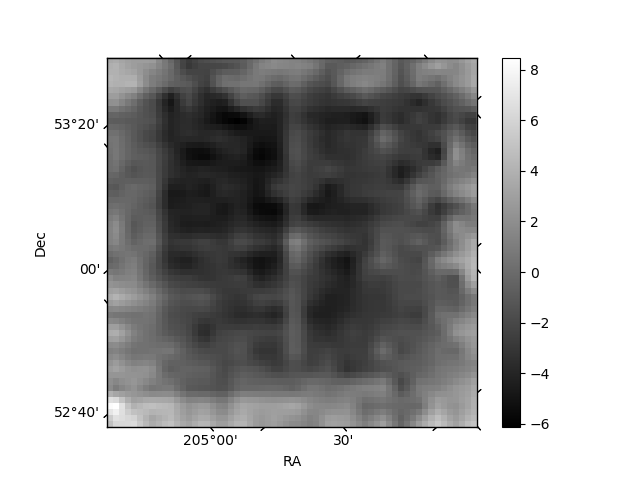
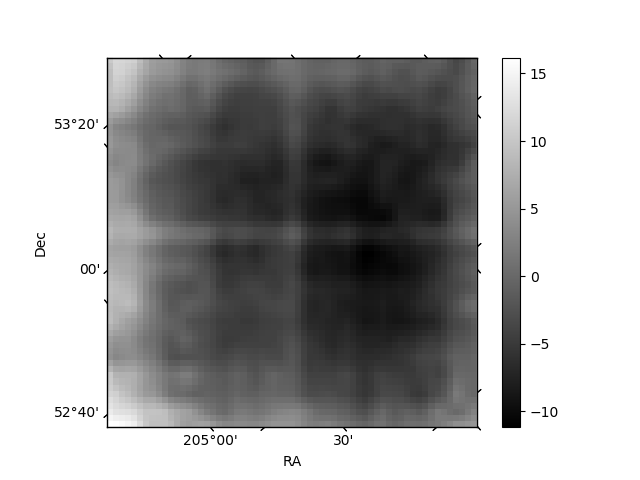
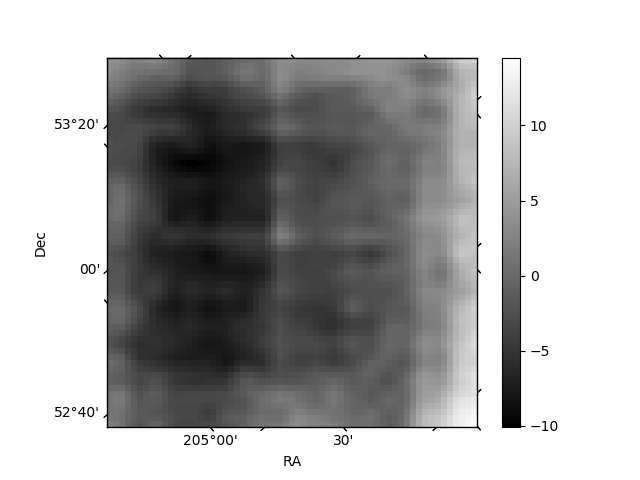
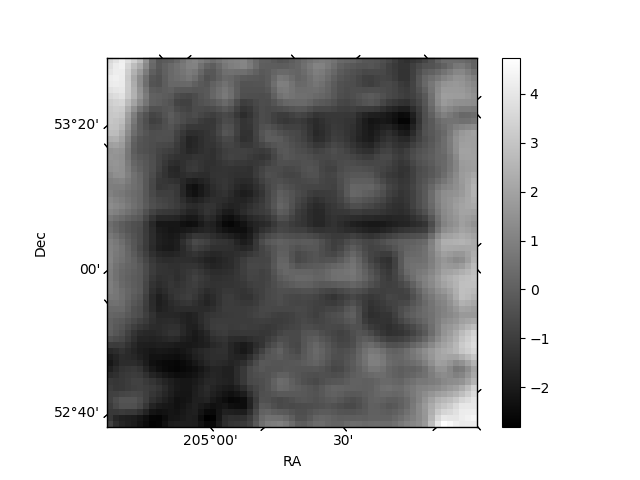
Histogram calculated using DETX and DETY for each event in the final _common_clean file
| Quadrant A | 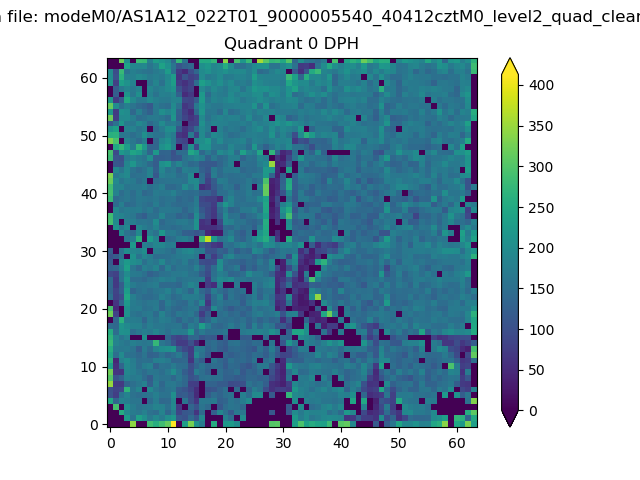 |
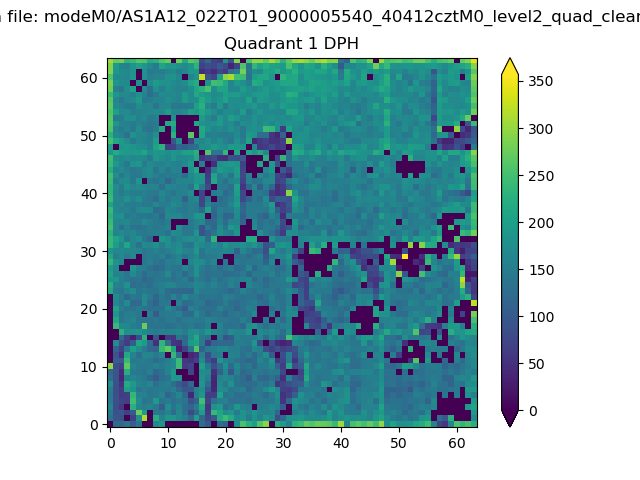 |
Quadrant B |
|---|---|---|---|
| Quadrant D | 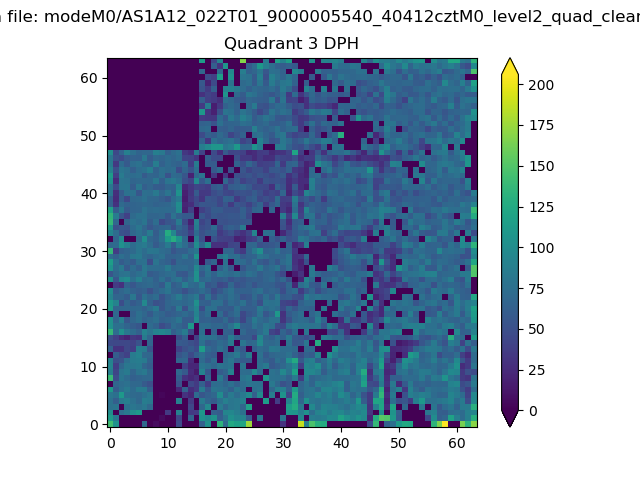 |
 |
Quadrant C |
| Plot type | Count rate plots | Images |
|---|---|---|
| Comparison with Poisson distribution Blue bars denote a histogram of data divided into 1 sec bins. Red curve is a Poisson curve with rate = median count rate of data. |
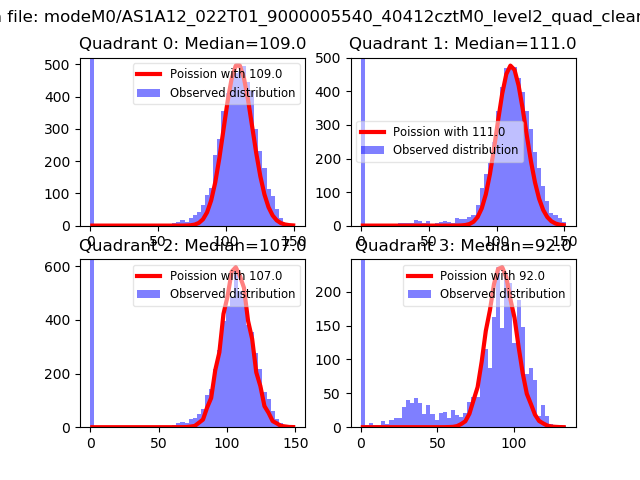 |
 |
| Quadrant-wise count rates Data is divided into 100 sec bins |
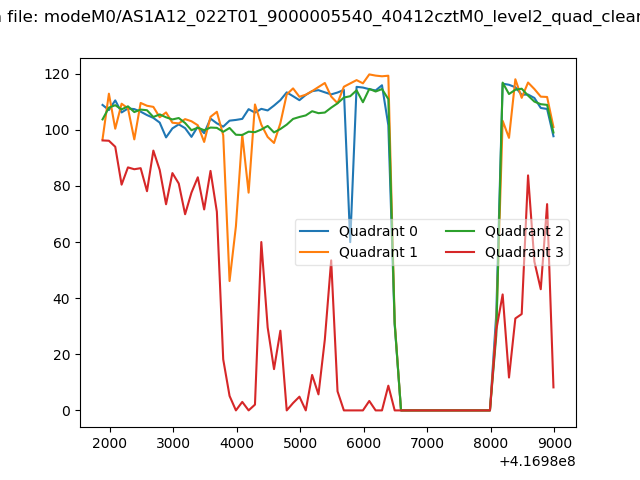 |
|
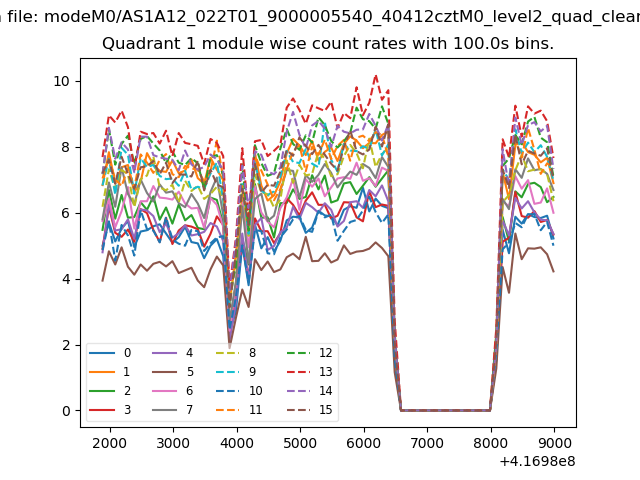
| Module-wise count rates for Quadrant A Data is divided into 100 sec bins |
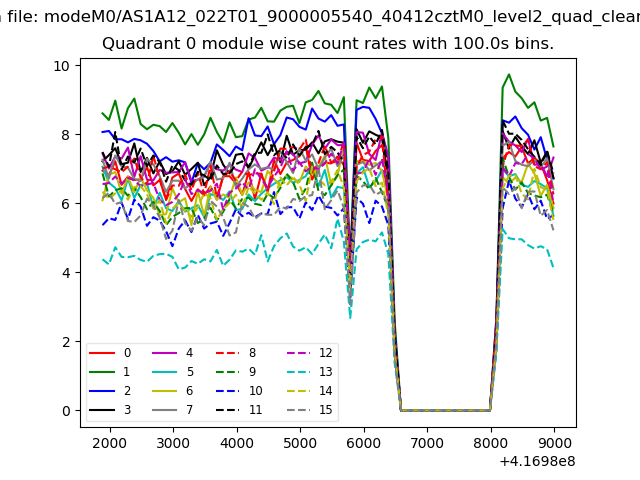 |
 |
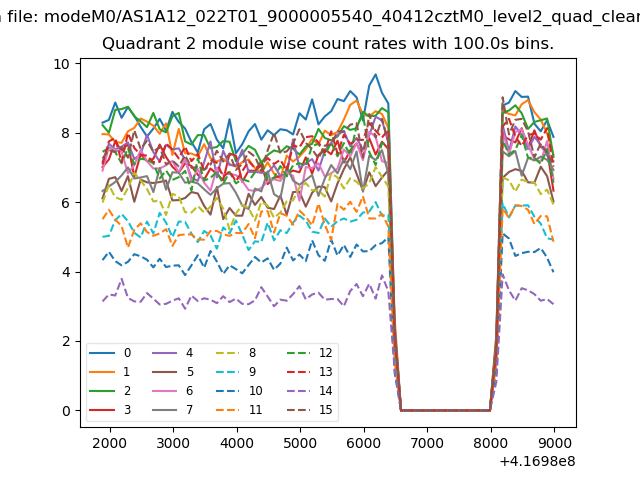
| Module-wise count rates for Quadrant B Data is divided into 100 sec bins |
 |
 |
| Module-wise count rates for Quadrant C Data is divided into 100 sec bins |
 |
 |
| Module-wise count rates for Quadrant D Data is divided into 100 sec bins |
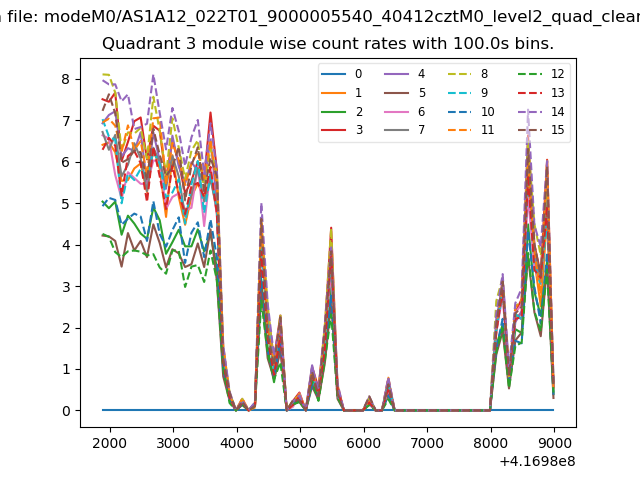 |
 |
| Parameter | Plot |
|---|---|
| CZT HV Monitor | 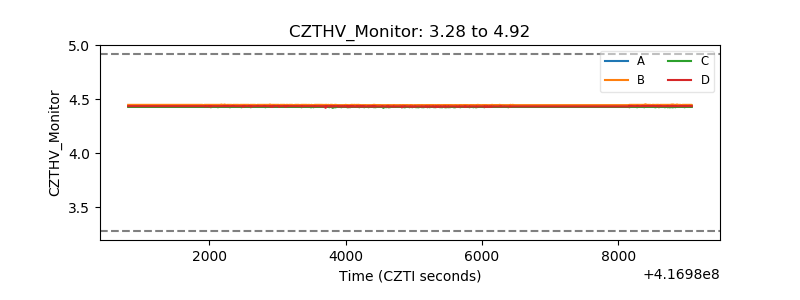 |
| D_VDD | 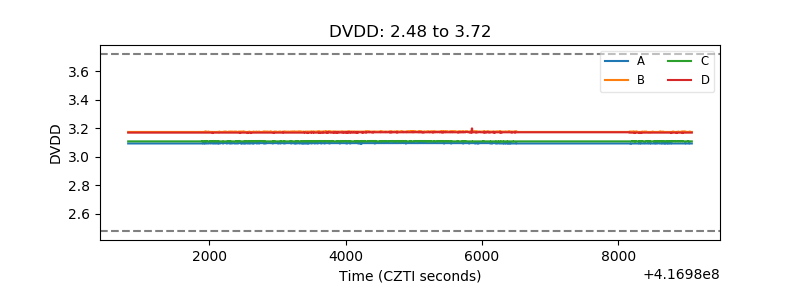 |
| Temperature 1 | 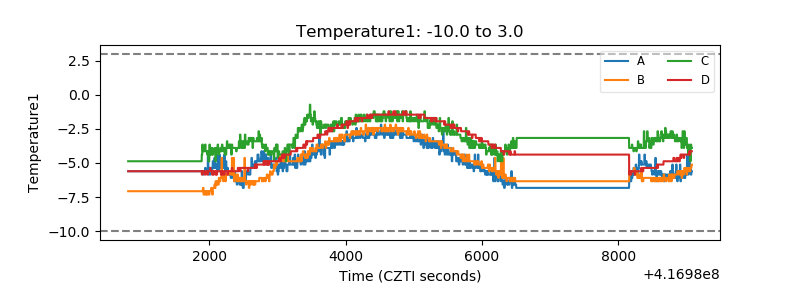 |
| Veto HV Monitor | 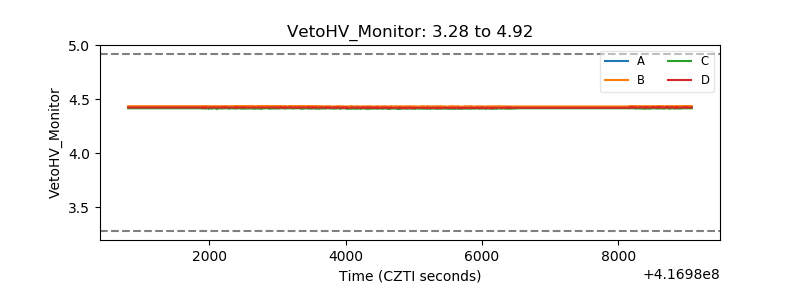 |
| Veto LLD | 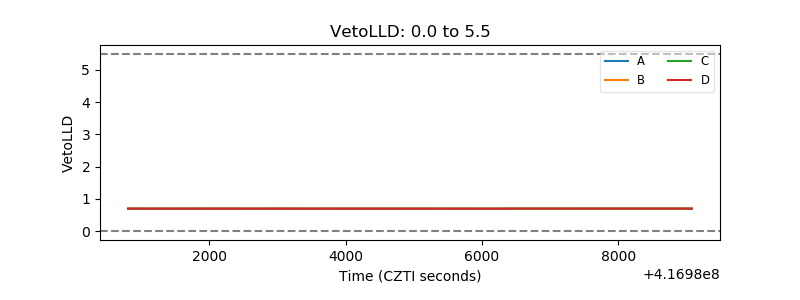 |
| Alpha Counter | 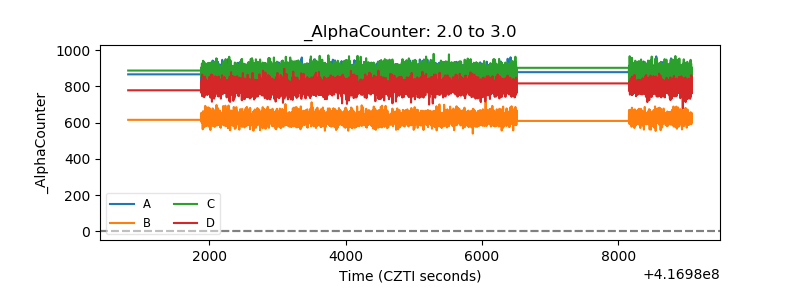 |
| _CPM_Rate | 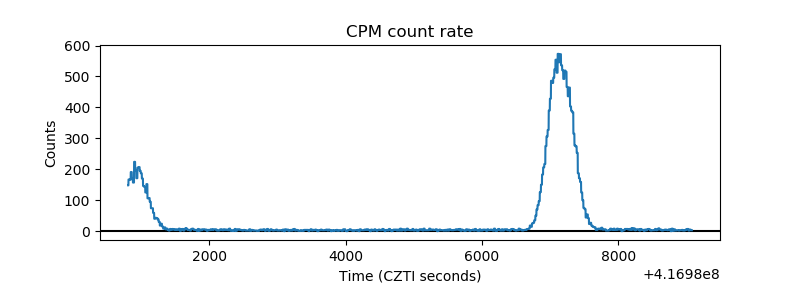 |
| CZT Counter | 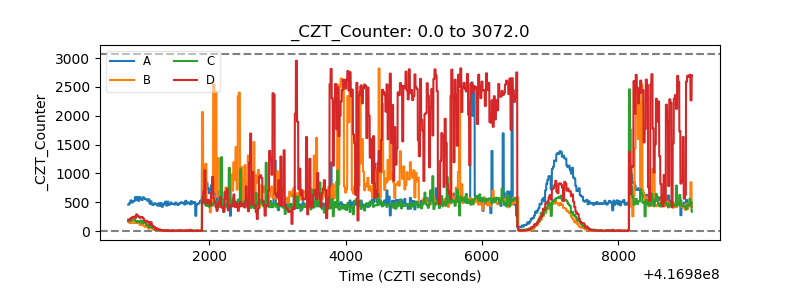 |
| +2.5 Volts monitor | 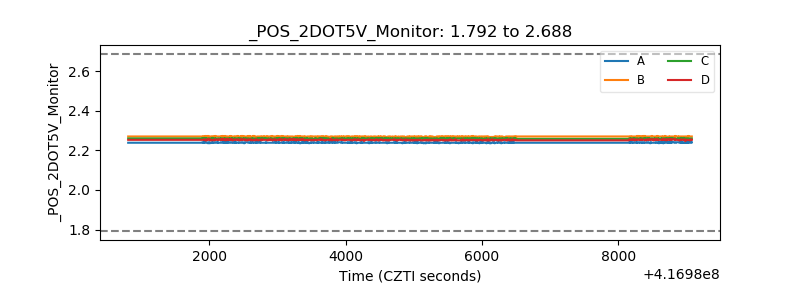 |
| +5 Volts monitor | 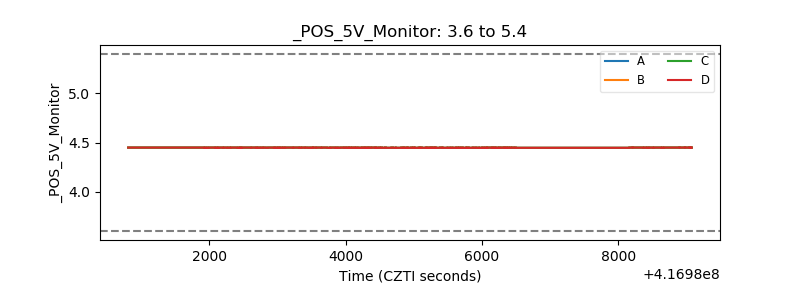 |
| _ROLL_ROT | 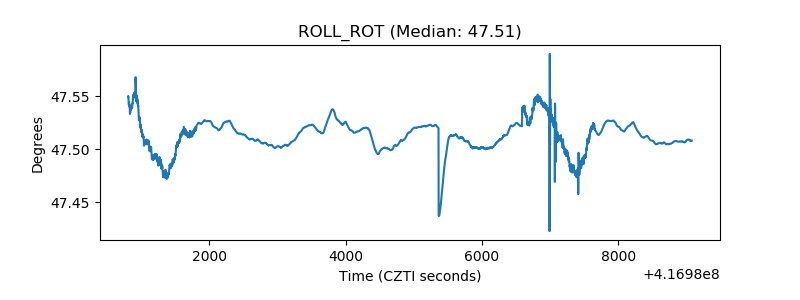 |
| _Roll_DEC | 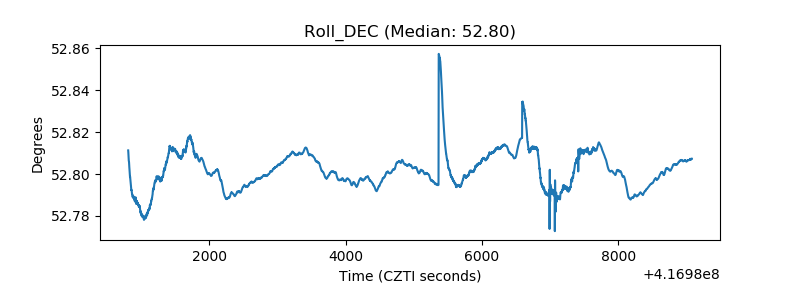 |
| _Roll_RA | 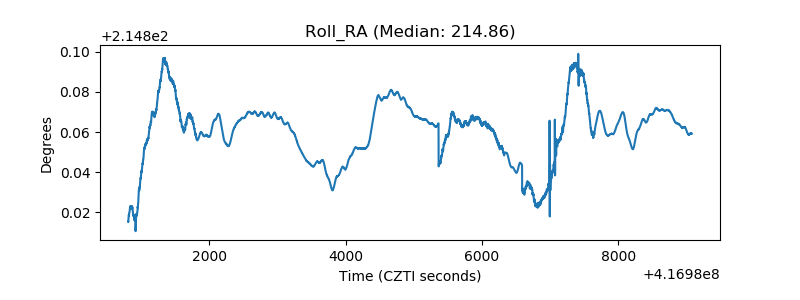 |
| Veto Counter | 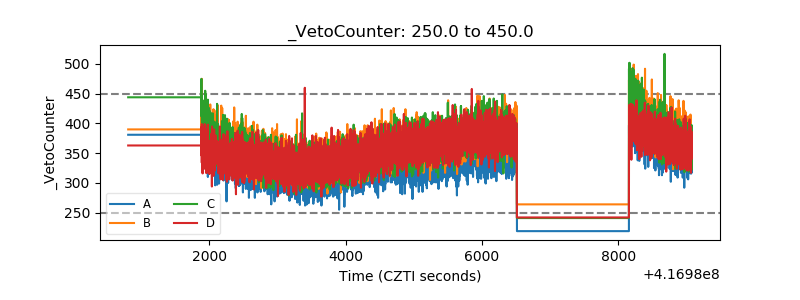 |