| Param | Original file | Final file |
|---|---|---|
| Filename | modeM0/AS1A12_022T01_9000005540_40415cztM0_level2.fits | modeM0/AS1A12_022T01_9000005540_40415cztM0_level2_quad_clean.evt |
| Size (bytes) | 421,571,520 | 83,514,240 |
| Size | 402.0 MB | 79.6 MB |
| Events in quadrant A | 2,922,663 | 645,513 |
| Events in quadrant B | 2,891,833 | 661,371 |
| Events in quadrant C | 2,659,160 | 618,678 |
| Events in quadrant D | 6,715,396 | 230,855 |
| Mode M0 | |||
|---|---|---|---|
| Quadrant | BADHDUFLAG | Total packets | Discarded packets |
| A | 0 | 11873 | 3 |
| B | 0 | 12272 | 2 |
| C | 0 | 11099 | 2 |
| D | 0 | 23699 | 2 |
| Mode M9 | |||
|---|---|---|---|
| Quadrant | BADHDUFLAG | Total packets | Discarded packets |
| A | 0 | 24 | 0 |
| B | 0 | 24 | 0 |
| C | 0 | 24 | 0 |
| D | 0 | 25 | 0 |
| Mode SS | |||
|---|---|---|---|
| Quadrant | BADHDUFLAG | Total packets | Discarded packets |
| A | 0 | 108 | 0 |
| B | 0 | 108 | 0 |
| C | 0 | 108 | 0 |
| D | 0 | 108 | 0 |
| Quadrant | Total seconds | Saturated seconds | Saturation percentage |
|---|---|---|---|
| A | 5319 | 18 | 0.338409% |
| B | 5319 | 9 | 0.169205% |
| C | 5319 | 13 | 0.244407% |
| D | 5319 | 3478 | 65.388231% |
Noise dominated data is calculated using 1-second bins in cleaned event files. If a bin has >2000 counts, and if more than 50% of those come from <1% of pixels, then it is considered to be noise-dominated and hence unusable.
| Quadrant | # 1 sec bins | Bins with >0 counts | Bins with >2000 counts | High rate bins dominated by noise | Noise dominated (total time) | Noise dominated (detector-on time) | Marked lightcurve |
|---|---|---|---|---|---|---|---|
| A | 7232 | 5320 | 7 | 7 | 0.10% | 0.13% | 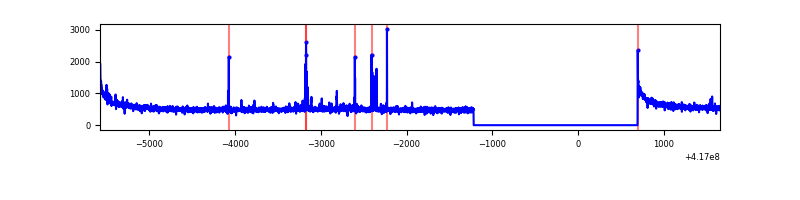 |
| B | 7232 | 5320 | 3 | 3 | 0.04% | 0.06% | 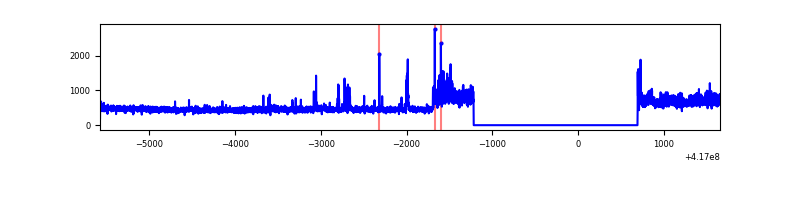 |
| C | 7232 | 5320 | 7 | 7 | 0.10% | 0.13% | 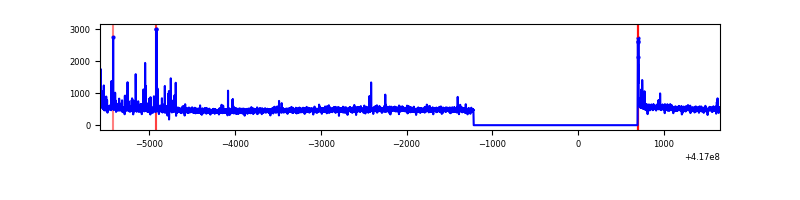 |
| D | 7232 | 5319 | 1224 | 1224 | 16.92% | 23.01% | 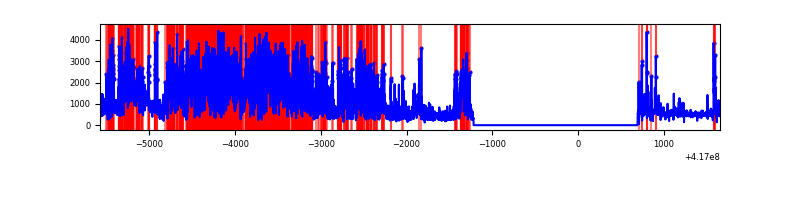 |
Top three noisy pixels from each quadrant. If the there are fewer than three noisy pixels in the level2.evt file, extra rows are filled as -1
| Pixel properties | Quadrant properties | ||||||
|---|---|---|---|---|---|---|---|
| Quadrant | DetID | PixID | Counts | Sigma | Mean | Median | Sigma |
| A | 10 | 83 | 464181 | 3717.92 | 615 | 604 | 124.7 |
| A | 13 | 248 | 67183 | 533.96 | 615 | 604 | 124.7 |
| A | 2 | 79 | 14646 | 112.61 | 615 | 604 | 124.7 |
| B | 7 | 202 | 377284 | 3221.65 | 607 | 592 | 116.9 |
| B | 5 | 255 | 44770 | 377.83 | 607 | 592 | 116.9 |
| B | 0 | 230 | 27598 | 230.97 | 607 | 592 | 116.9 |
| C | 15 | 214 | 233508 | 1705.79 | 591 | 596 | 136.5 |
| C | 14 | 254 | 74944 | 544.51 | 591 | 596 | 136.5 |
| C | 5 | 250 | 19734 | 140.16 | 591 | 596 | 136.5 |
| D | 2 | 250 | 4533698 | 49699.24 | 372 | 362 | 91.2 |
| D | 12 | 191 | 281878 | 3086.28 | 372 | 362 | 91.2 |
| D | 12 | 227 | 126651 | 1384.51 | 372 | 362 | 91.2 |
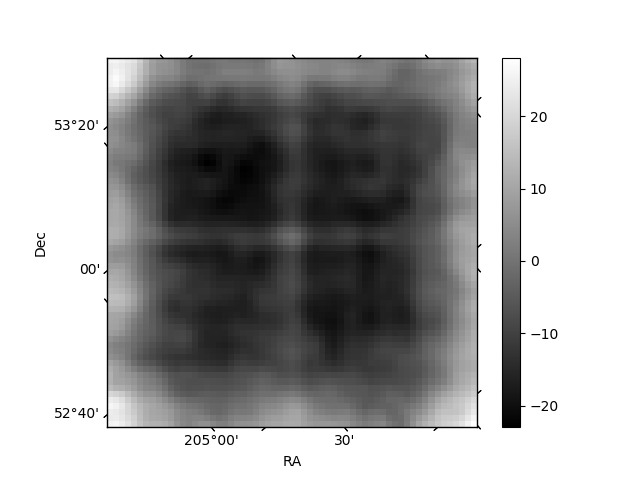
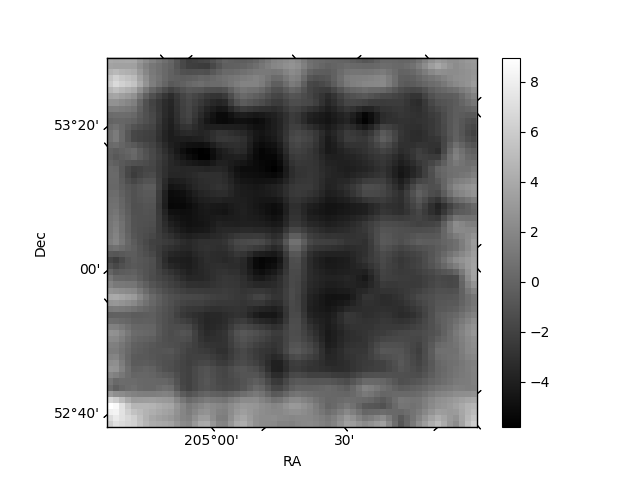
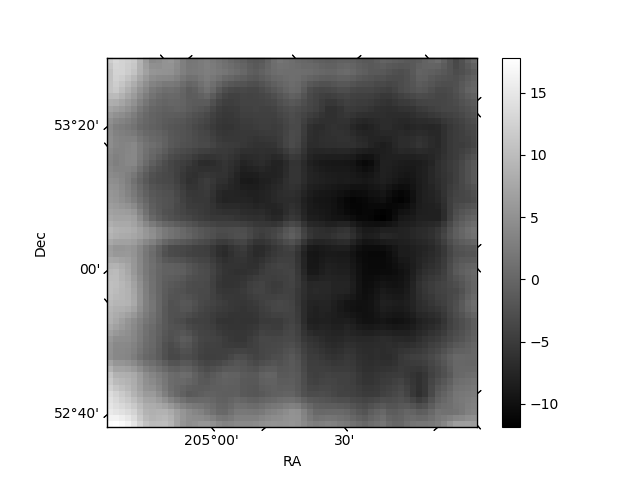
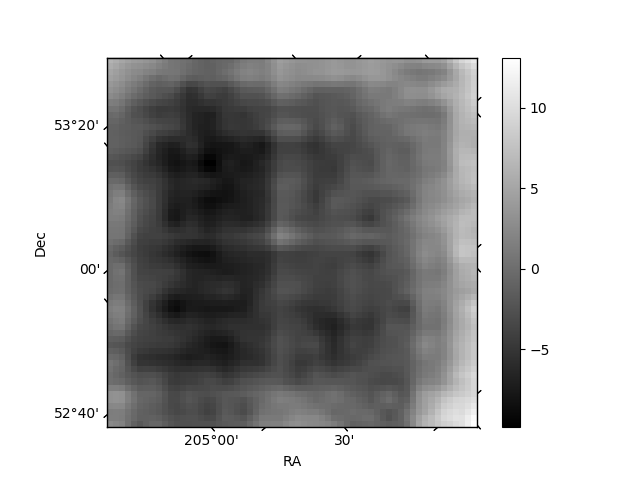
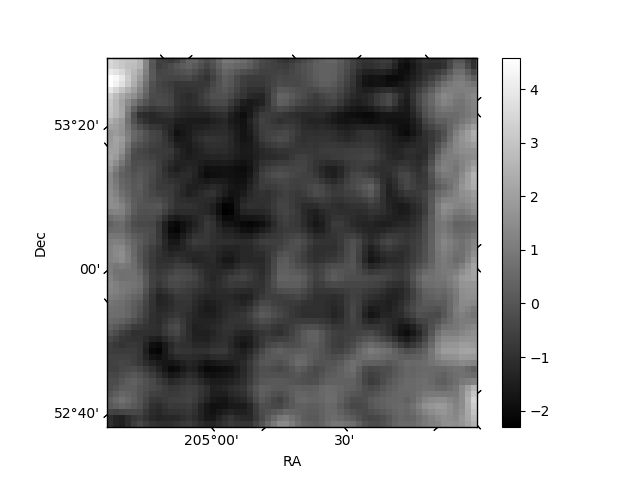
Histogram calculated using DETX and DETY for each event in the final _common_clean file
| Quadrant A | 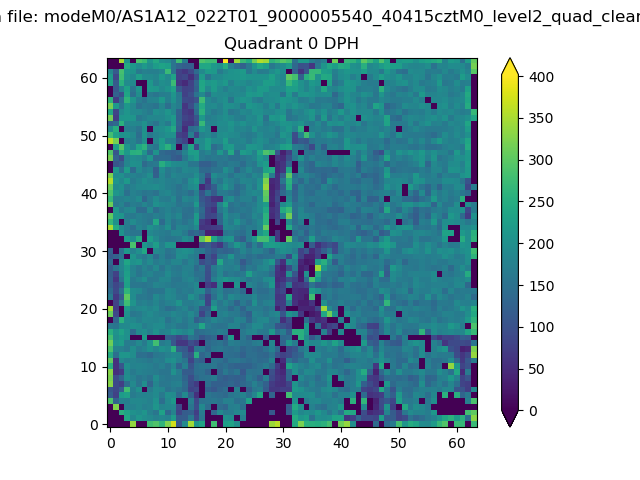 |
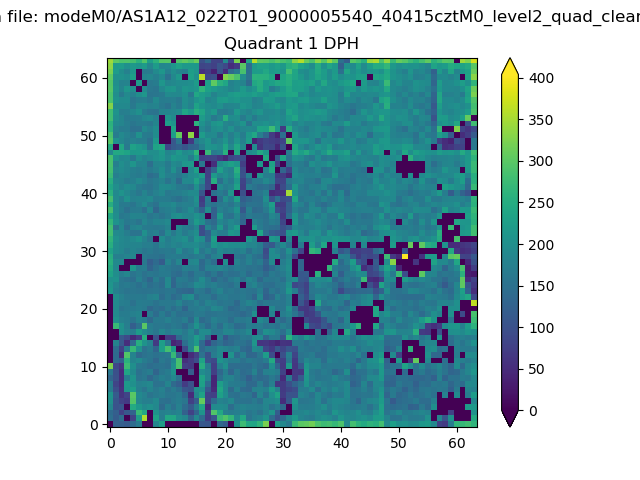 |
Quadrant B |
|---|---|---|---|
| Quadrant D |  |
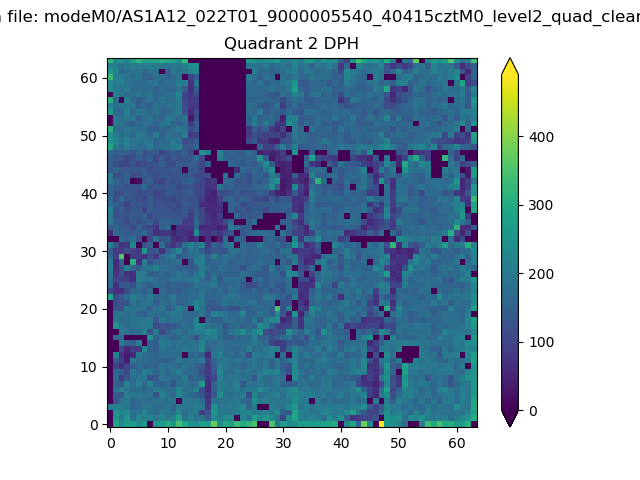 |
Quadrant C |
| Plot type | Count rate plots | Images |
|---|---|---|
| Comparison with Poisson distribution Blue bars denote a histogram of data divided into 1 sec bins. Red curve is a Poisson curve with rate = median count rate of data. |
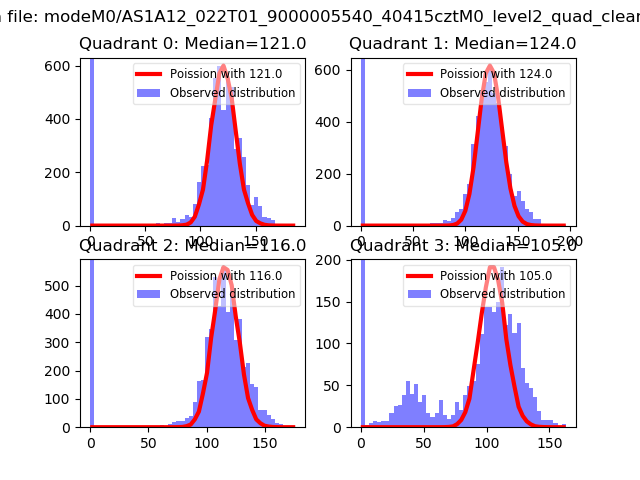 |
 |
| Quadrant-wise count rates Data is divided into 100 sec bins |
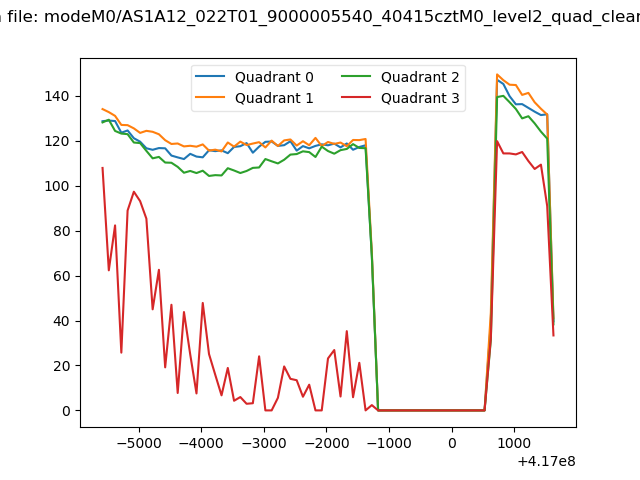 |
|
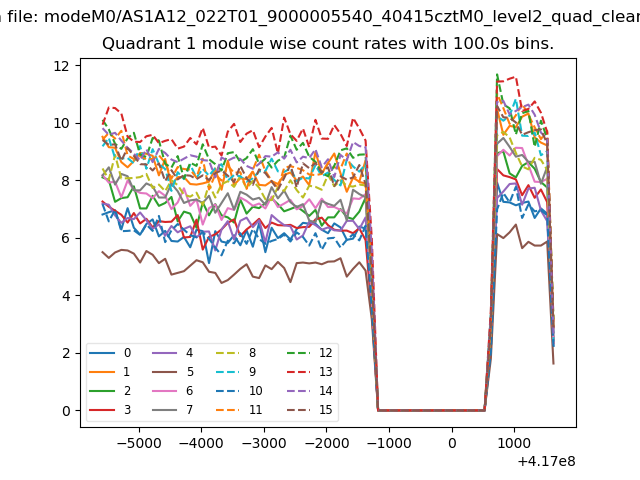
| Module-wise count rates for Quadrant A Data is divided into 100 sec bins |
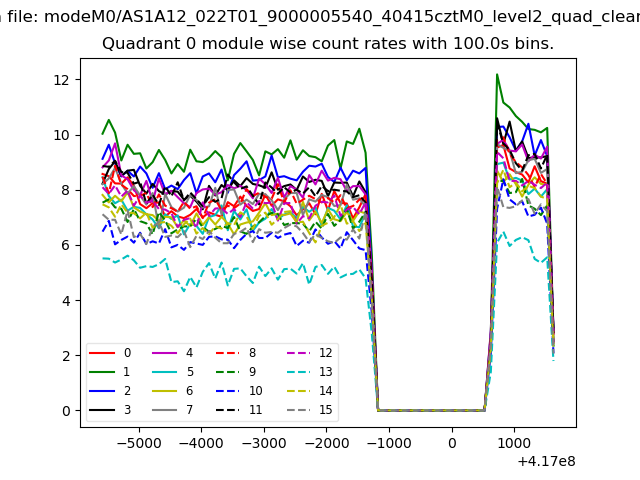 |
 |
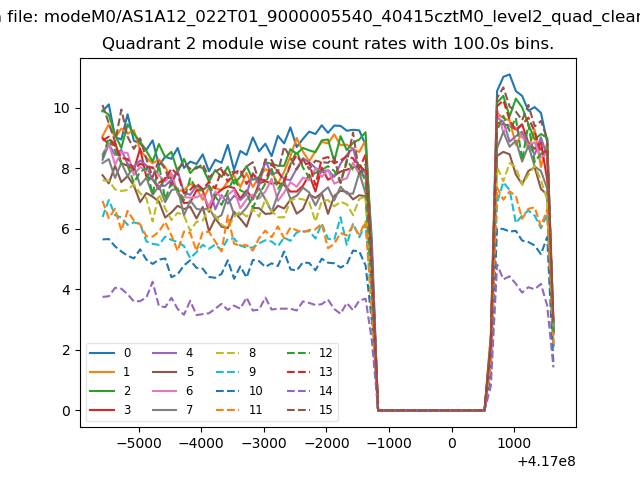
| Module-wise count rates for Quadrant B Data is divided into 100 sec bins |
 |
 |
| Module-wise count rates for Quadrant C Data is divided into 100 sec bins |
 |
 |
| Module-wise count rates for Quadrant D Data is divided into 100 sec bins |
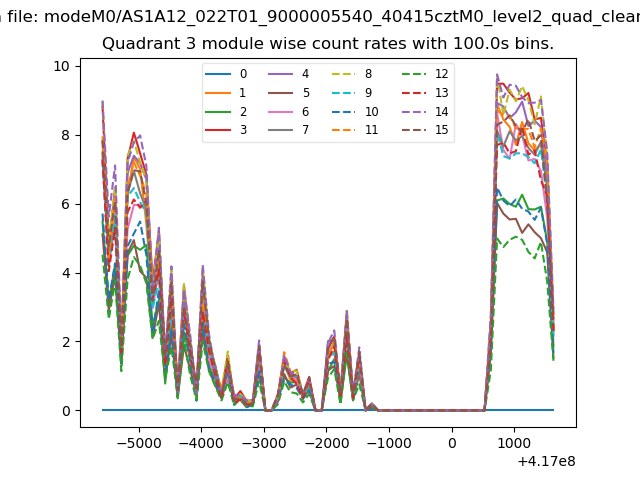 |
 |
| Parameter | Plot |
|---|---|
| CZT HV Monitor | 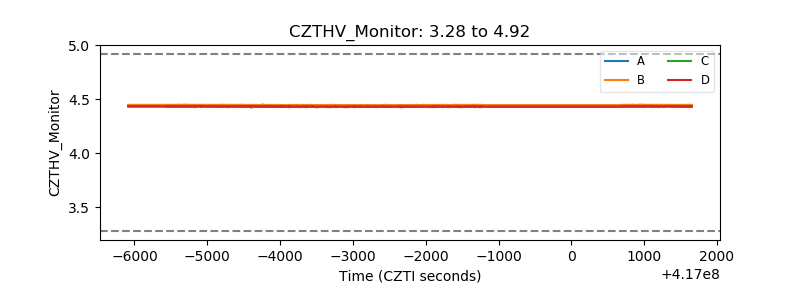 |
| D_VDD | 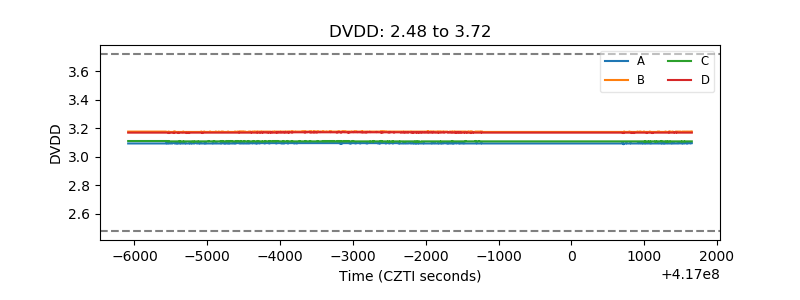 |
| Temperature 1 | 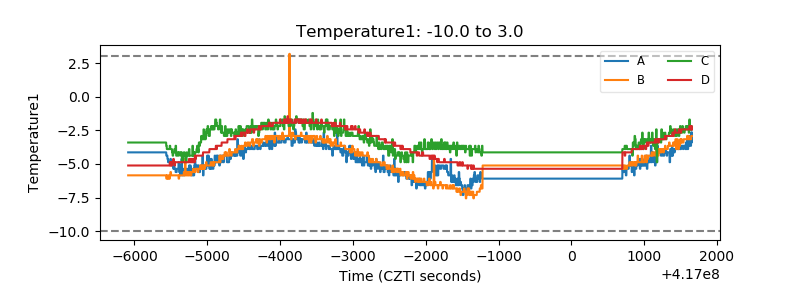 |
| Veto HV Monitor | 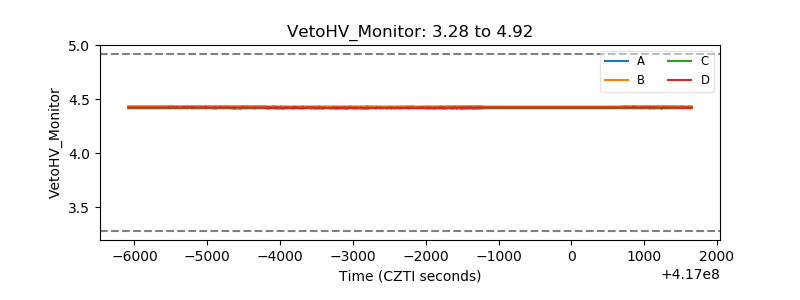 |
| Veto LLD | 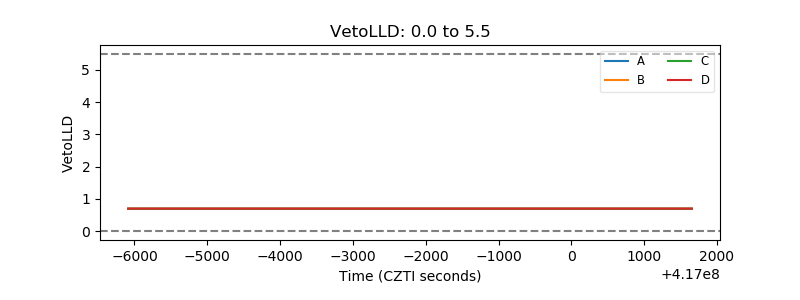 |
| Alpha Counter | 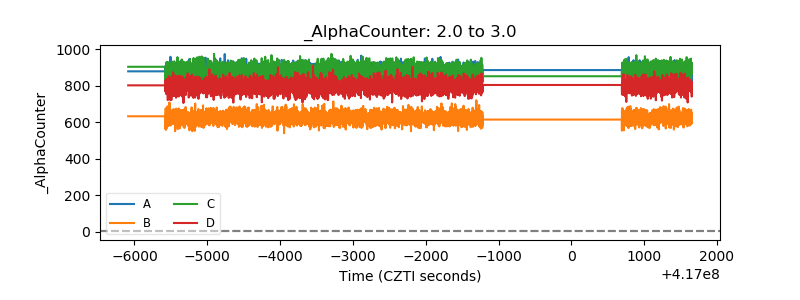 |
| _CPM_Rate | 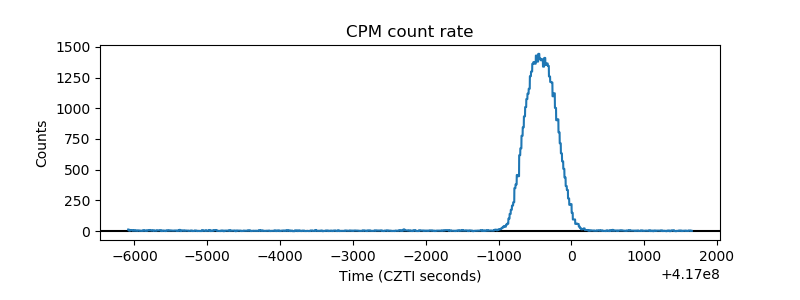 |
| CZT Counter | 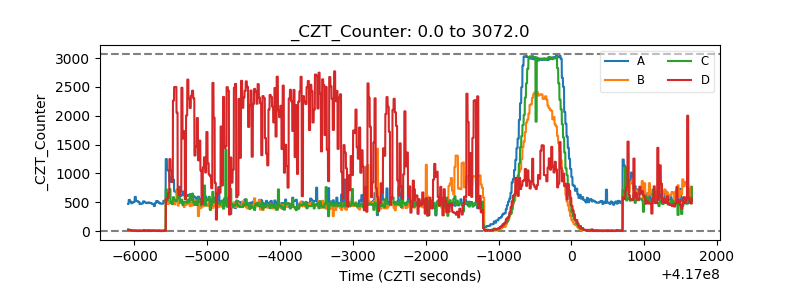 |
| +2.5 Volts monitor | 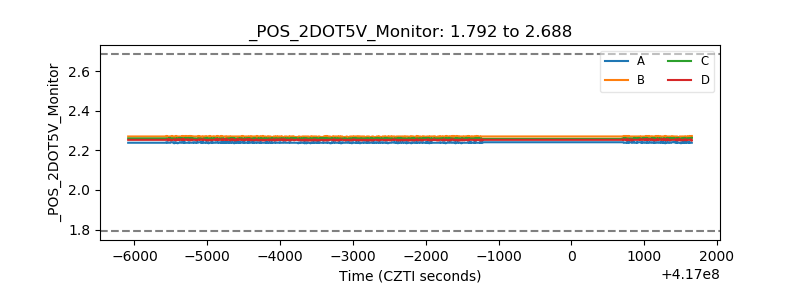 |
| +5 Volts monitor |  |
| _ROLL_ROT | 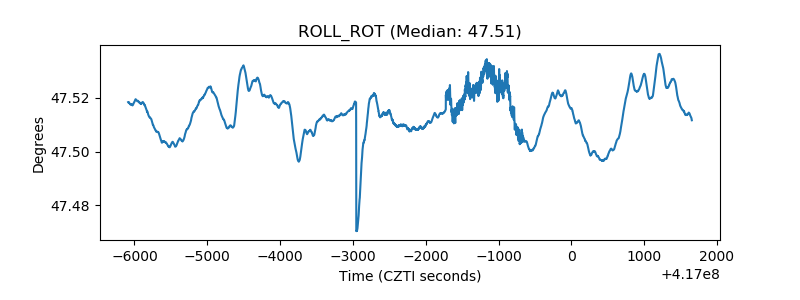 |
| _Roll_DEC | 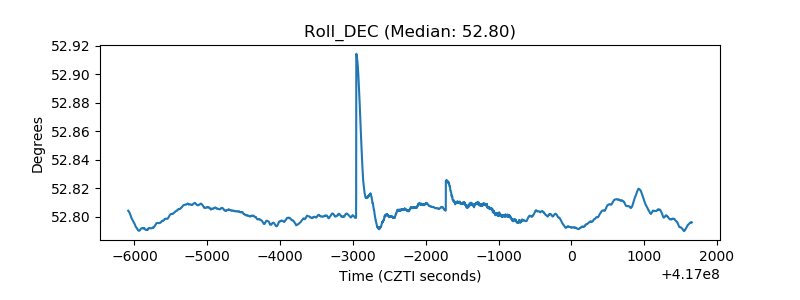 |
| _Roll_RA | 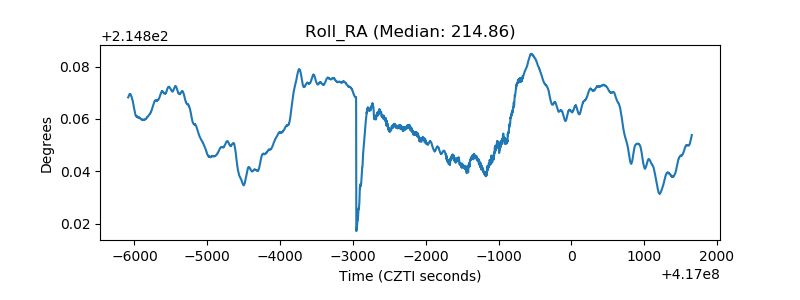 |
| Veto Counter | 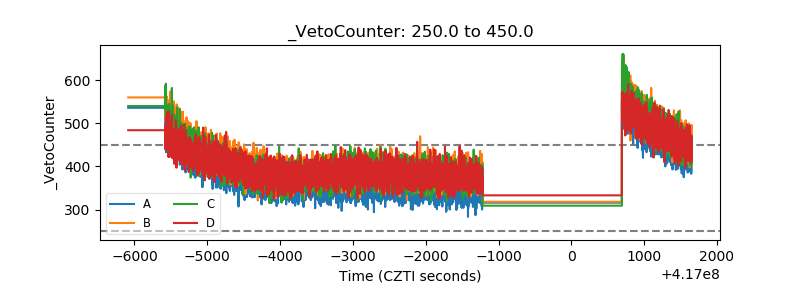 |