| Param | Original file | Final file |
|---|---|---|
| Filename | modeM0/AS1A12_022T01_9000005540_40416cztM0_level2.fits | modeM0/AS1A12_022T01_9000005540_40416cztM0_level2_quad_clean.evt |
| Size (bytes) | 423,999,360 | 90,365,760 |
| Size | 404.4 MB | 86.2 MB |
| Events in quadrant A | 2,911,963 | 663,159 |
| Events in quadrant B | 3,795,185 | 676,914 |
| Events in quadrant C | 2,646,103 | 630,113 |
| Events in quadrant D | 5,941,893 | 406,156 |
| Mode M0 | |||
|---|---|---|---|
| Quadrant | BADHDUFLAG | Total packets | Discarded packets |
| A | 0 | 11776 | 3 |
| B | 0 | 14771 | 2 |
| C | 0 | 10782 | 2 |
| D | 0 | 21026 | 2 |
| Mode M9 | |||
|---|---|---|---|
| Quadrant | BADHDUFLAG | Total packets | Discarded packets |
| A | 0 | 27 | 0 |
| B | 0 | 27 | 0 |
| C | 0 | 27 | 0 |
| D | 0 | 28 | 0 |
| Mode SS | |||
|---|---|---|---|
| Quadrant | BADHDUFLAG | Total packets | Discarded packets |
| A | 0 | 106 | 0 |
| B | 0 | 106 | 0 |
| C | 0 | 106 | 0 |
| D | 0 | 106 | 0 |
| Quadrant | Total seconds | Saturated seconds | Saturation percentage |
|---|---|---|---|
| A | 5134 | 20 | 0.389560% |
| B | 5134 | 49 | 0.954422% |
| C | 5134 | 17 | 0.331126% |
| D | 5134 | 1850 | 36.034281% |
Noise dominated data is calculated using 1-second bins in cleaned event files. If a bin has >2000 counts, and if more than 50% of those come from <1% of pixels, then it is considered to be noise-dominated and hence unusable.
| Quadrant | # 1 sec bins | Bins with >0 counts | Bins with >2000 counts | High rate bins dominated by noise | Noise dominated (total time) | Noise dominated (detector-on time) | Marked lightcurve |
|---|---|---|---|---|---|---|---|
| A | 7168 | 5135 | 10 | 10 | 0.14% | 0.19% | 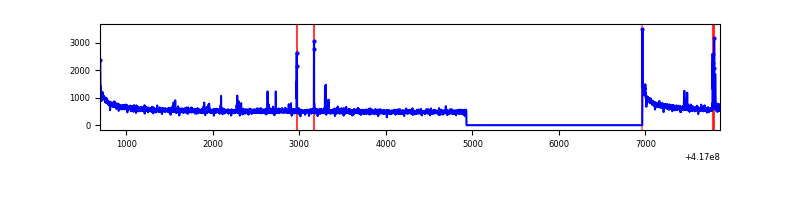 |
| B | 7168 | 5135 | 10 | 10 | 0.14% | 0.19% | 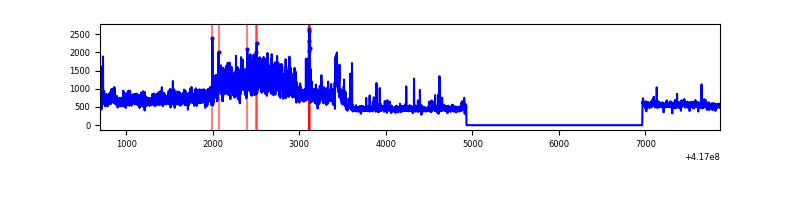 |
| C | 7168 | 5135 | 9 | 9 | 0.13% | 0.18% | 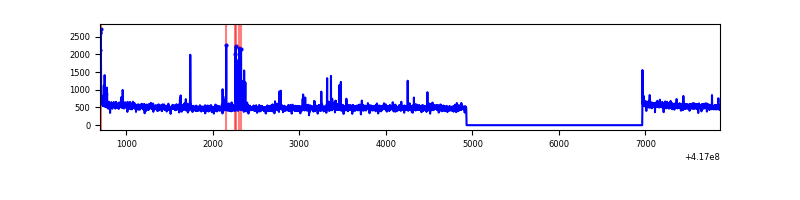 |
| D | 7168 | 5135 | 952 | 952 | 13.28% | 18.54% | 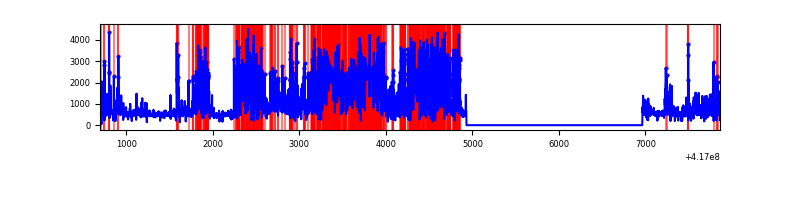 |
Top three noisy pixels from each quadrant. If the there are fewer than three noisy pixels in the level2.evt file, extra rows are filled as -1
| Pixel properties | Quadrant properties | ||||||
|---|---|---|---|---|---|---|---|
| Quadrant | DetID | PixID | Counts | Sigma | Mean | Median | Sigma |
| A | 10 | 83 | 455184 | 3661.77 | 617 | 607 | 124.1 |
| A | 13 | 248 | 60771 | 484.64 | 617 | 607 | 124.1 |
| A | 2 | 79 | 10281 | 77.93 | 617 | 607 | 124.1 |
| B | 7 | 202 | 1276561 | 11204.22 | 605 | 590 | 113.9 |
| B | 5 | 255 | 67175 | 584.68 | 605 | 590 | 113.9 |
| B | 4 | 170 | 27609 | 237.25 | 605 | 590 | 113.9 |
| C | 15 | 214 | 225142 | 1642.52 | 592 | 595 | 136.7 |
| C | 14 | 254 | 92596 | 672.97 | 592 | 595 | 136.7 |
| C | 3 | 233 | 11193 | 77.52 | 592 | 595 | 136.7 |
| D | 2 | 250 | 3462462 | 28684.07 | 490 | 477 | 120.7 |
| D | 12 | 227 | 148478 | 1226.25 | 490 | 477 | 120.7 |
| D | 12 | 191 | 146138 | 1206.87 | 490 | 477 | 120.7 |
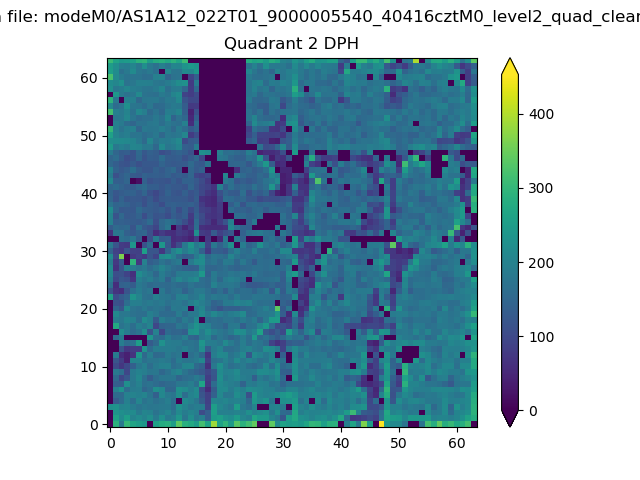
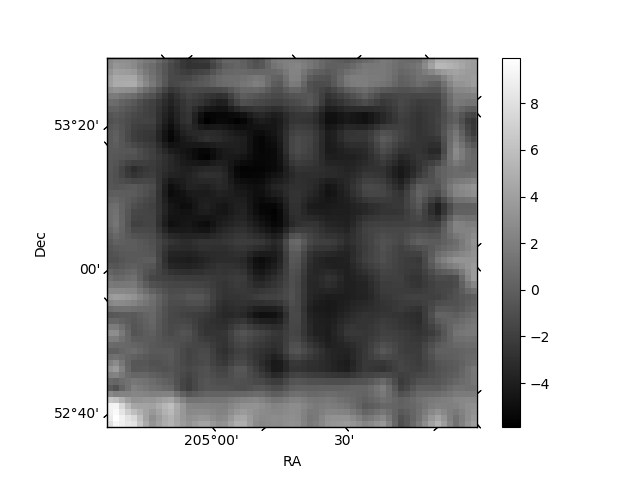
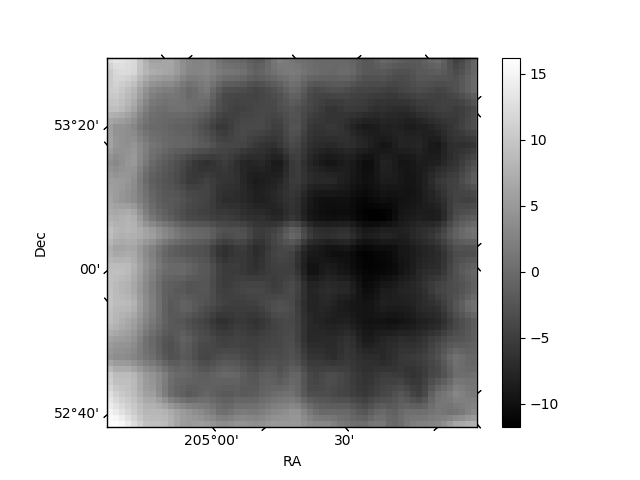
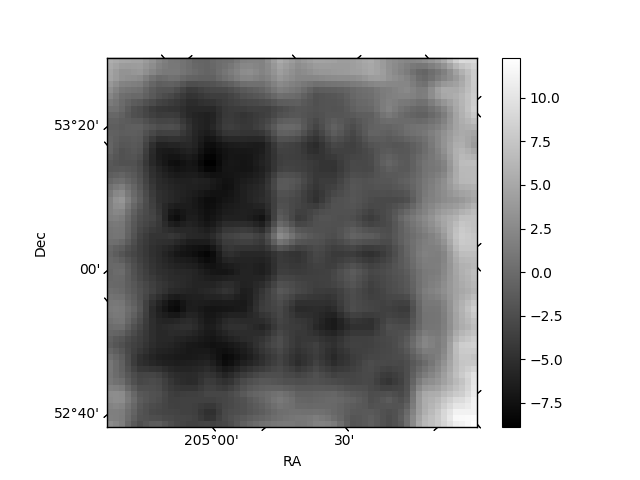
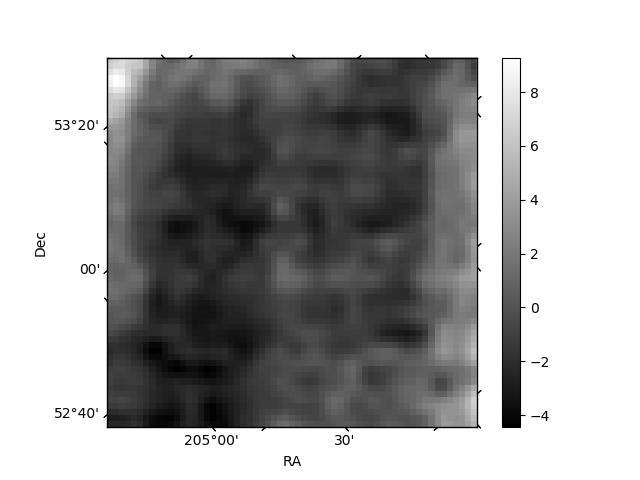
Histogram calculated using DETX and DETY for each event in the final _common_clean file
| Quadrant A |  |
 |
Quadrant B |
|---|---|---|---|
| Quadrant D | 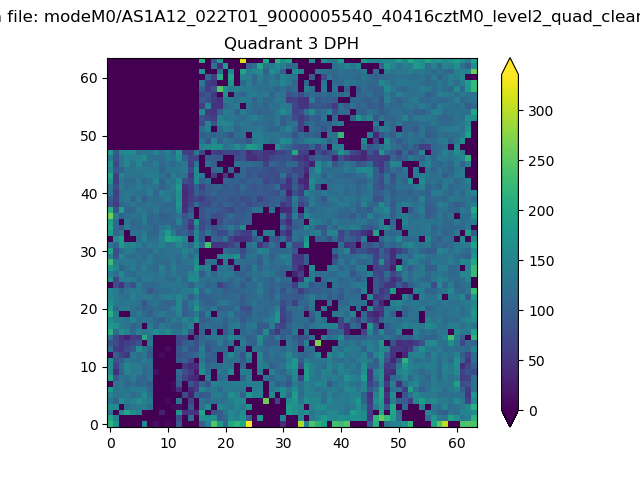 |
 |
Quadrant C |
| Plot type | Count rate plots | Images |
|---|---|---|
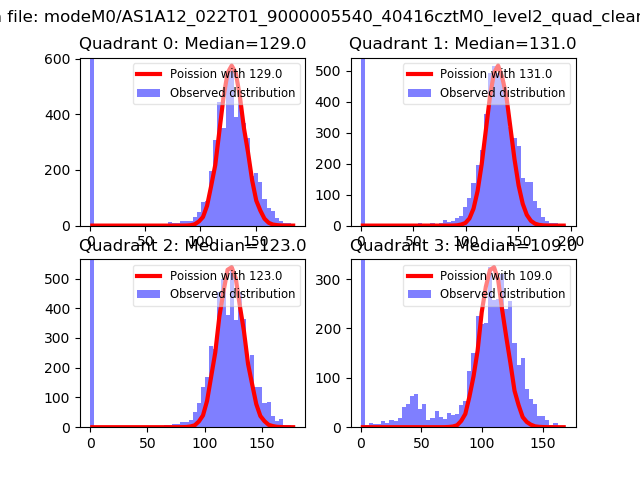
| Comparison with Poisson distribution Blue bars denote a histogram of data divided into 1 sec bins. Red curve is a Poisson curve with rate = median count rate of data. |
 |
 |
| Quadrant-wise count rates Data is divided into 100 sec bins |
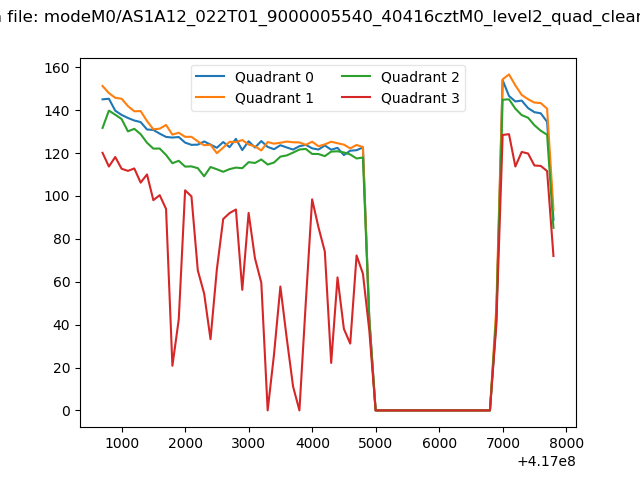 |
|
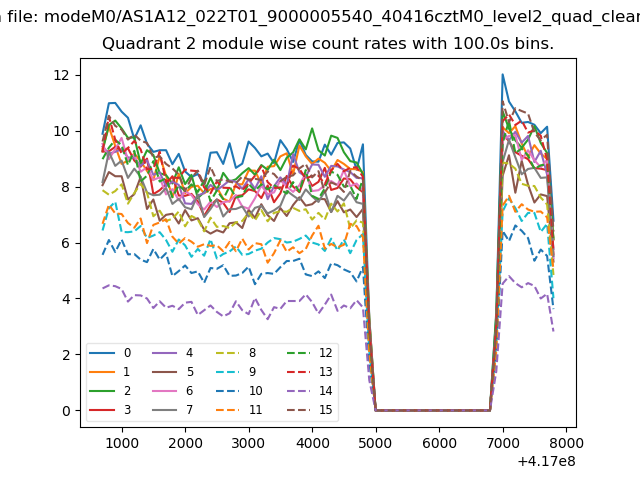
| Module-wise count rates for Quadrant A Data is divided into 100 sec bins |
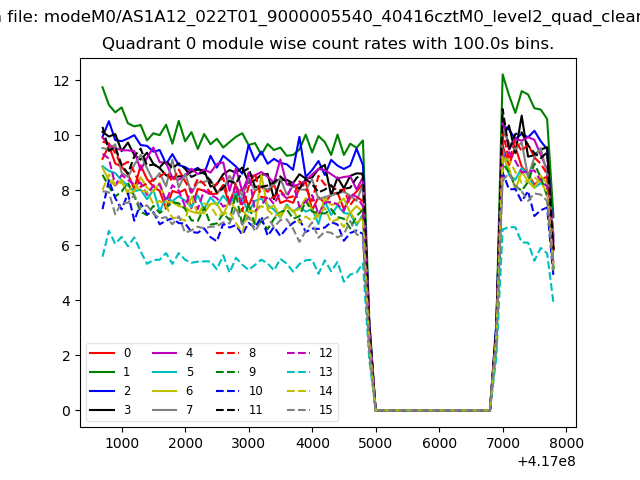 |
 |
| Module-wise count rates for Quadrant B Data is divided into 100 sec bins |
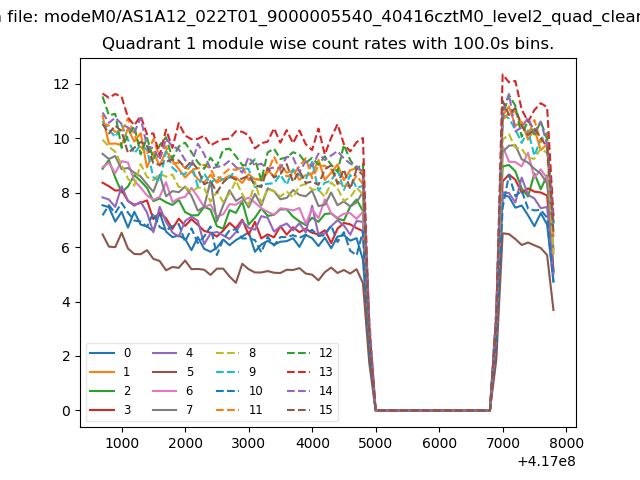 |
 |
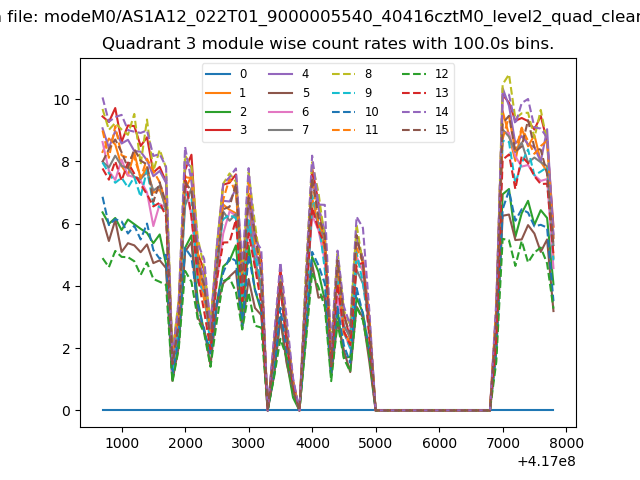
| Module-wise count rates for Quadrant C Data is divided into 100 sec bins |
 |
 |
| Module-wise count rates for Quadrant D Data is divided into 100 sec bins |
 |
 |
| Parameter | Plot |
|---|---|
| CZT HV Monitor | 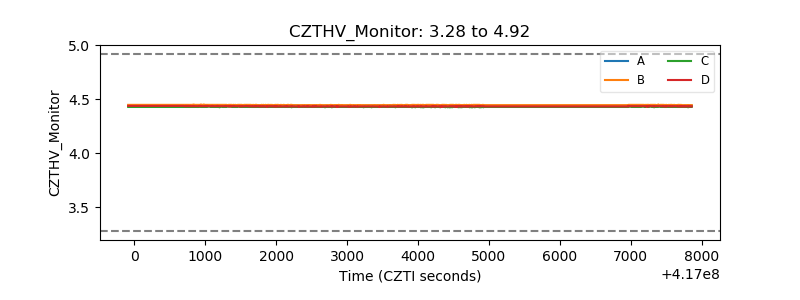 |
| D_VDD | 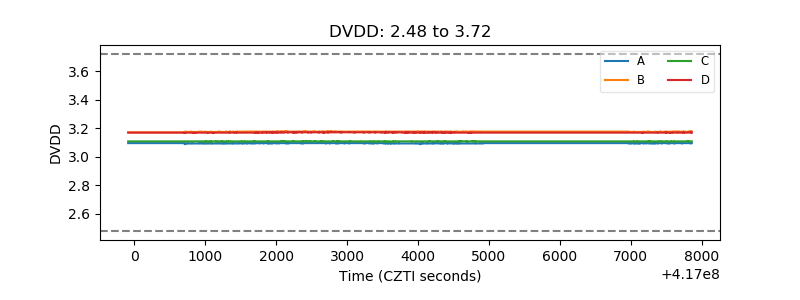 |
| Temperature 1 | 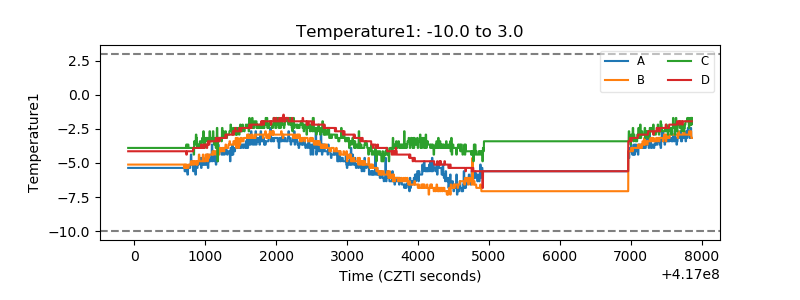 |
| Veto HV Monitor | 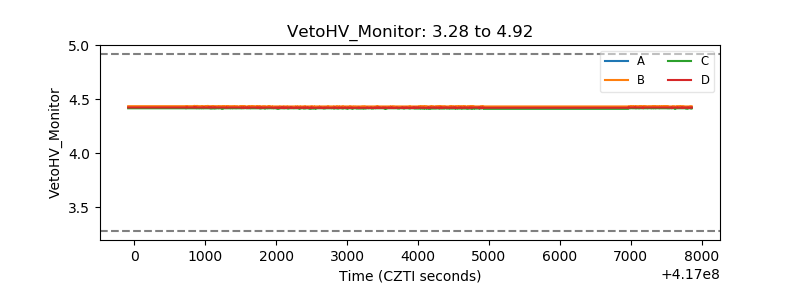 |
| Veto LLD | 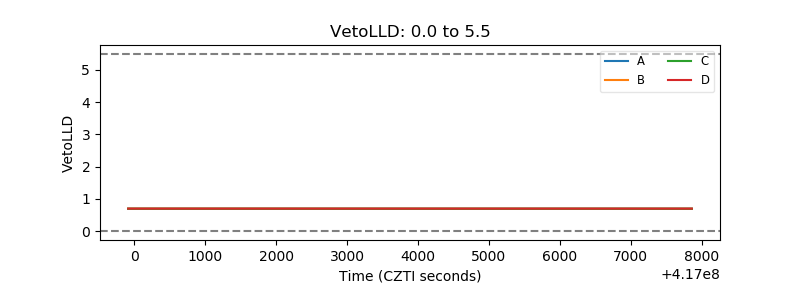 |
| Alpha Counter | 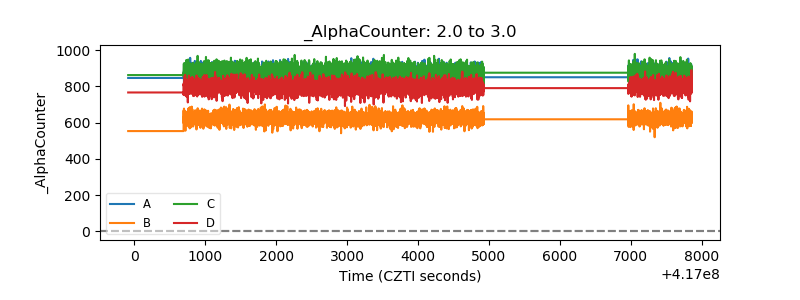 |
| _CPM_Rate | 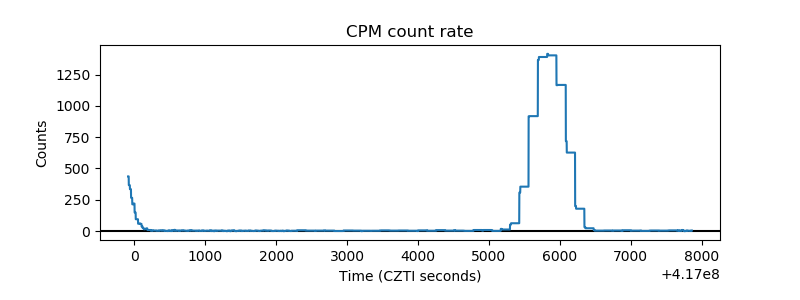 |
| CZT Counter | 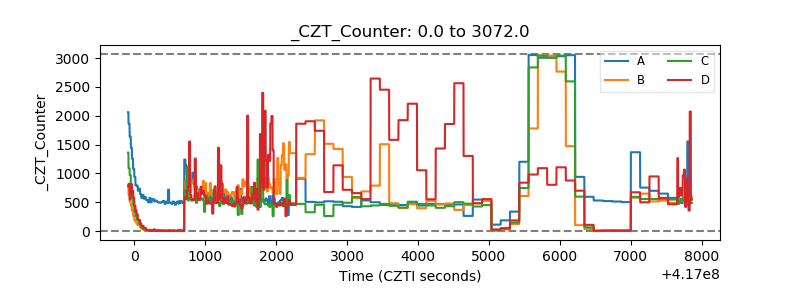 |
| +2.5 Volts monitor | 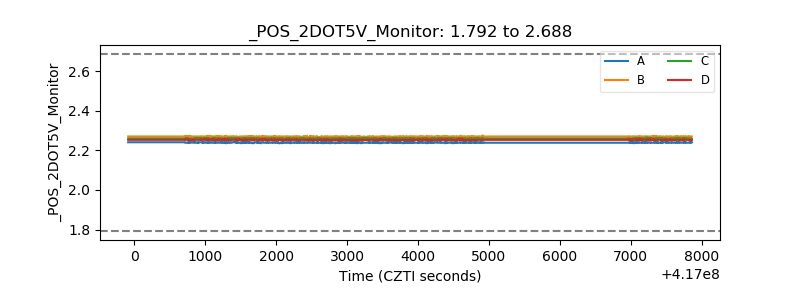 |
| +5 Volts monitor | 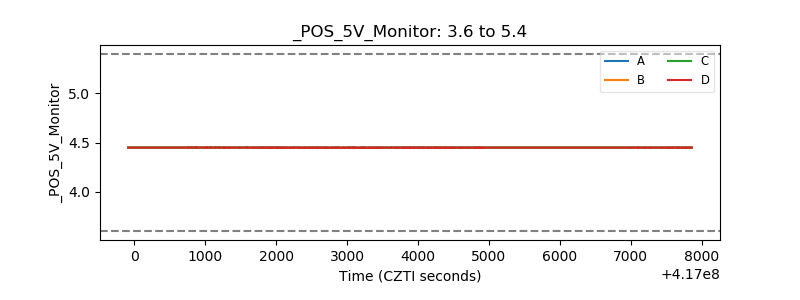 |
| _ROLL_ROT | 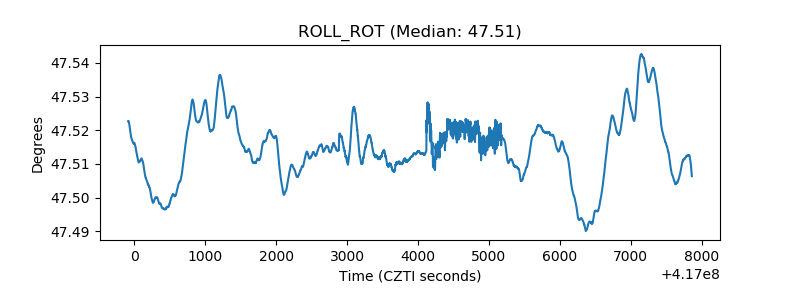 |
| _Roll_DEC | 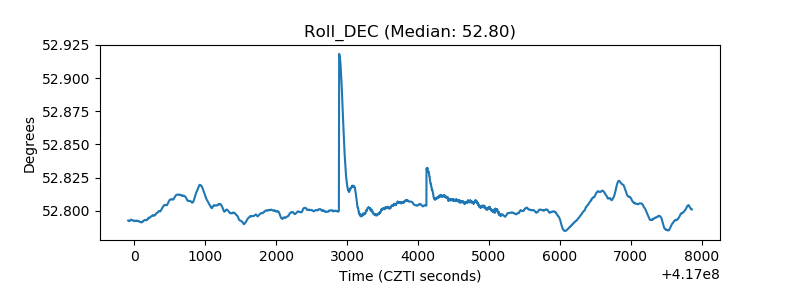 |
| _Roll_RA | 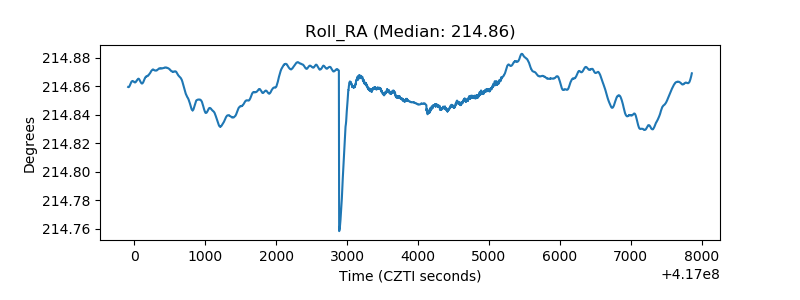 |
| Veto Counter | 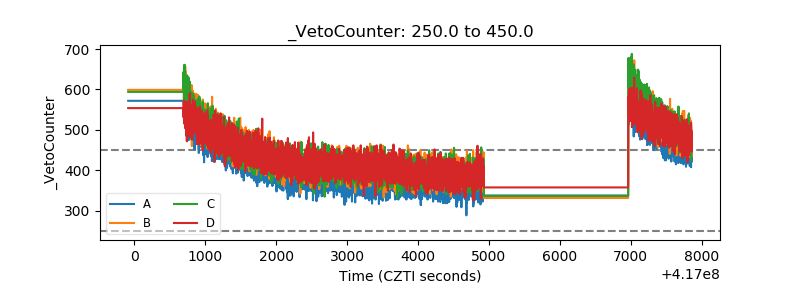 |