| Param | Original file | Final file |
|---|---|---|
| Filename | modeM0/AS1A12_022T01_9000005540_40417cztM0_level2.fits | modeM0/AS1A12_022T01_9000005540_40417cztM0_level2_quad_clean.evt |
| Size (bytes) | 351,757,440 | 96,678,720 |
| Size | 335.5 MB | 92.2 MB |
| Events in quadrant A | 3,025,430 | 682,963 |
| Events in quadrant B | 3,099,811 | 700,620 |
| Events in quadrant C | 2,647,088 | 654,892 |
| Events in quadrant D | 3,844,001 | 525,598 |
| Mode M0 | |||
|---|---|---|---|
| Quadrant | BADHDUFLAG | Total packets | Discarded packets |
| A | 0 | 12214 | 3 |
| B | 0 | 12358 | 2 |
| C | 0 | 10717 | 2 |
| D | 0 | 14830 | 2 |
| Mode M9 | |||
|---|---|---|---|
| Quadrant | BADHDUFLAG | Total packets | Discarded packets |
| A | 0 | 30 | 0 |
| B | 0 | 30 | 0 |
| C | 0 | 30 | 0 |
| D | 0 | 31 | 0 |
| Mode SS | |||
|---|---|---|---|
| Quadrant | BADHDUFLAG | Total packets | Discarded packets |
| A | 0 | 106 | 0 |
| B | 0 | 106 | 0 |
| C | 0 | 106 | 0 |
| D | 0 | 106 | 0 |
| Quadrant | Total seconds | Saturated seconds | Saturation percentage |
|---|---|---|---|
| A | 5190 | 25 | 0.481696% |
| B | 5190 | 21 | 0.404624% |
| C | 5190 | 11 | 0.211946% |
| D | 5190 | 854 | 16.454721% |
Noise dominated data is calculated using 1-second bins in cleaned event files. If a bin has >2000 counts, and if more than 50% of those come from <1% of pixels, then it is considered to be noise-dominated and hence unusable.
| Quadrant | # 1 sec bins | Bins with >0 counts | Bins with >2000 counts | High rate bins dominated by noise | Noise dominated (total time) | Noise dominated (detector-on time) | Marked lightcurve |
|---|---|---|---|---|---|---|---|
| A | 7284 | 5191 | 13 | 13 | 0.18% | 0.25% | 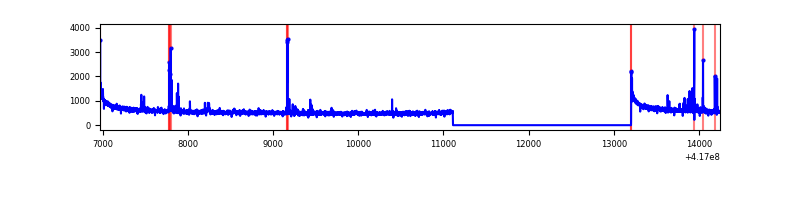 |
| B | 7284 | 5191 | 11 | 11 | 0.15% | 0.21% | 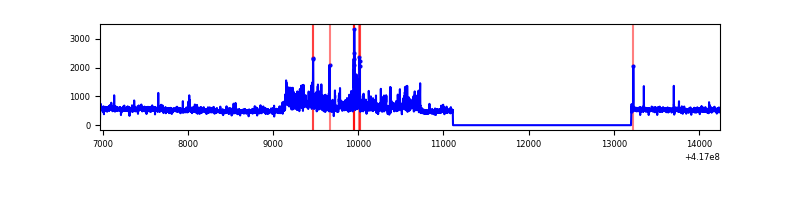 |
| C | 7284 | 5191 | 4 | 4 | 0.05% | 0.08% | 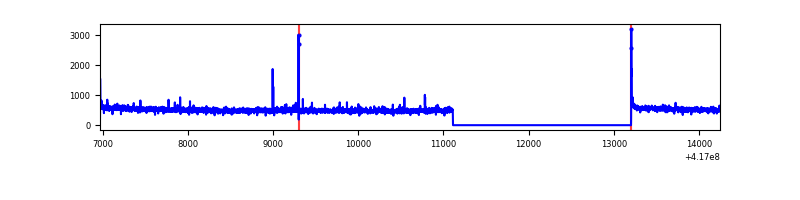 |
| D | 7283 | 5190 | 170 | 170 | 2.33% | 3.28% | 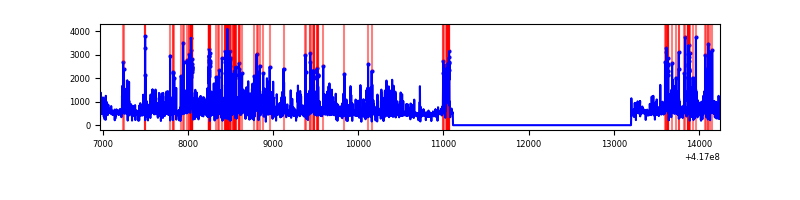 |
Top three noisy pixels from each quadrant. If the there are fewer than three noisy pixels in the level2.evt file, extra rows are filled as -1
| Pixel properties | Quadrant properties | ||||||
|---|---|---|---|---|---|---|---|
| Quadrant | DetID | PixID | Counts | Sigma | Mean | Median | Sigma |
| A | 10 | 83 | 474157 | 3748.39 | 628 | 617 | 126.3 |
| A | 13 | 248 | 104644 | 823.44 | 628 | 617 | 126.3 |
| A | 2 | 79 | 13351 | 100.8 | 628 | 617 | 126.3 |
| B | 7 | 202 | 486236 | 4157.58 | 621 | 606 | 116.8 |
| B | 4 | 170 | 76570 | 650.34 | 621 | 606 | 116.8 |
| B | 5 | 255 | 60730 | 514.73 | 621 | 606 | 116.8 |
| C | 15 | 214 | 226242 | 1622.08 | 609 | 614 | 139.1 |
| C | 14 | 254 | 29207 | 205.56 | 609 | 614 | 139.1 |
| C | 0 | 10 | 17239 | 119.52 | 609 | 614 | 139.1 |
| D | 2 | 250 | 460204 | 3319.14 | 568 | 552 | 138.5 |
| D | 13 | 171 | 343139 | 2473.81 | 568 | 552 | 138.5 |
| D | 12 | 227 | 339461 | 2447.25 | 568 | 552 | 138.5 |
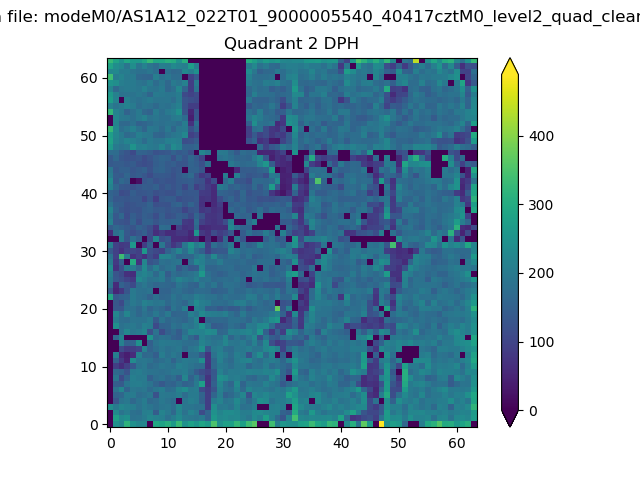
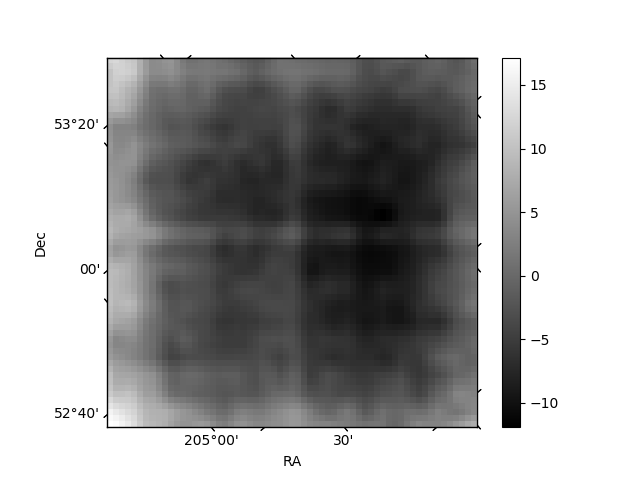
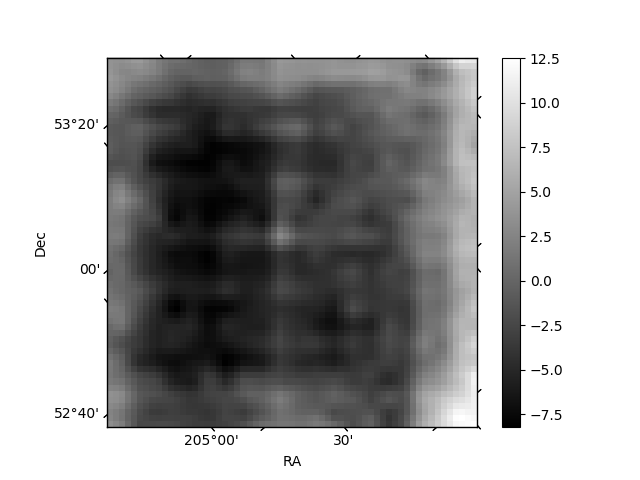
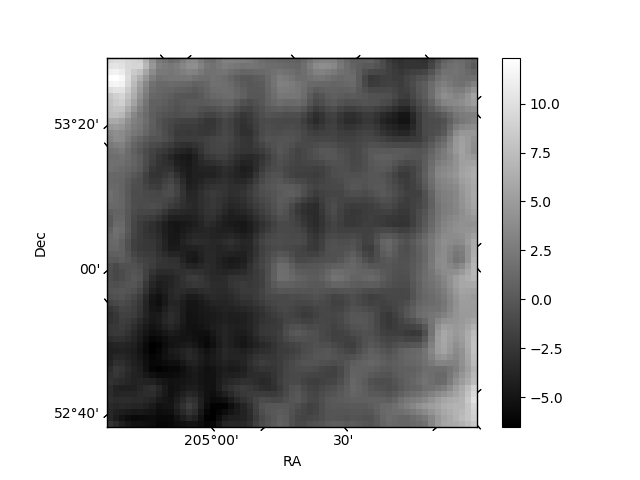
Histogram calculated using DETX and DETY for each event in the final _common_clean file
| Quadrant A | 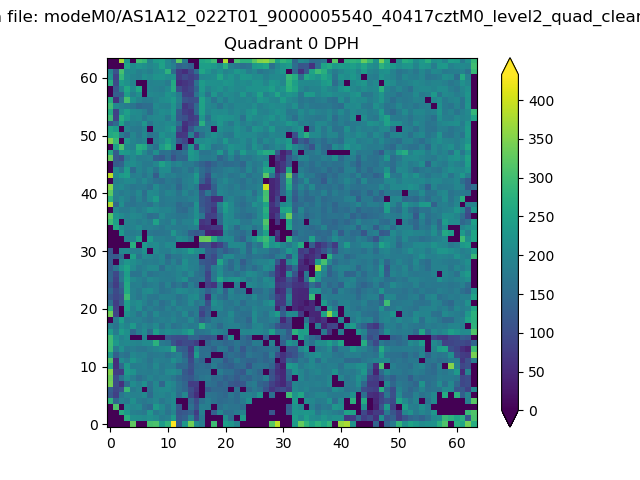 |
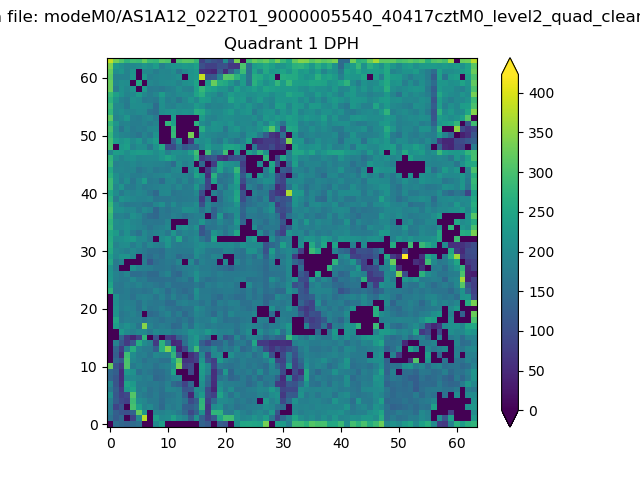 |
Quadrant B |
|---|---|---|---|
| Quadrant D | 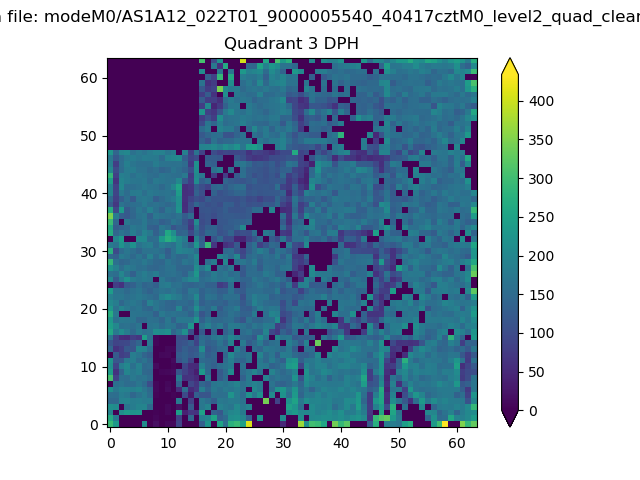 |
 |
Quadrant C |
| Plot type | Count rate plots | Images |
|---|---|---|
| Comparison with Poisson distribution Blue bars denote a histogram of data divided into 1 sec bins. Red curve is a Poisson curve with rate = median count rate of data. |
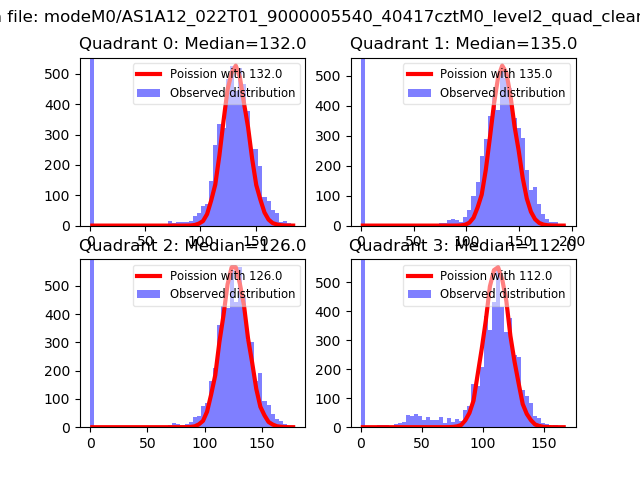 |
 |
| Quadrant-wise count rates Data is divided into 100 sec bins |
 |
|
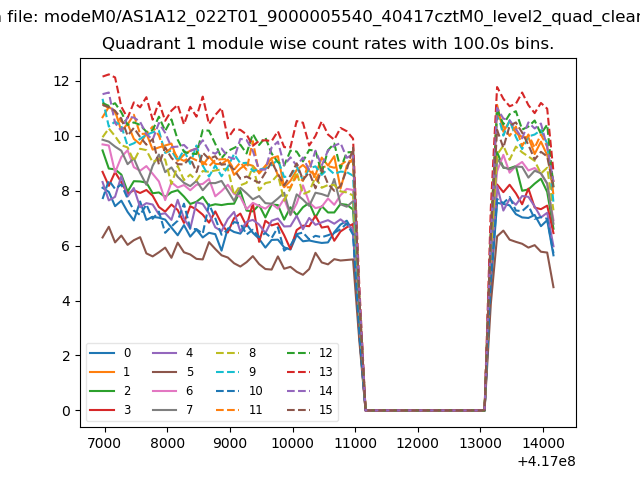
| Module-wise count rates for Quadrant A Data is divided into 100 sec bins |
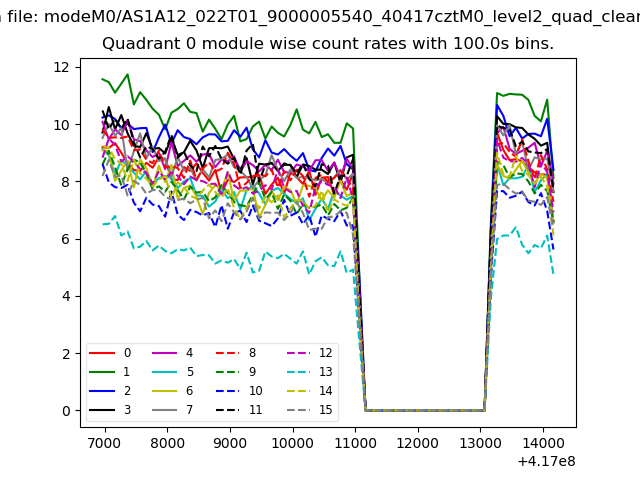 |
 |
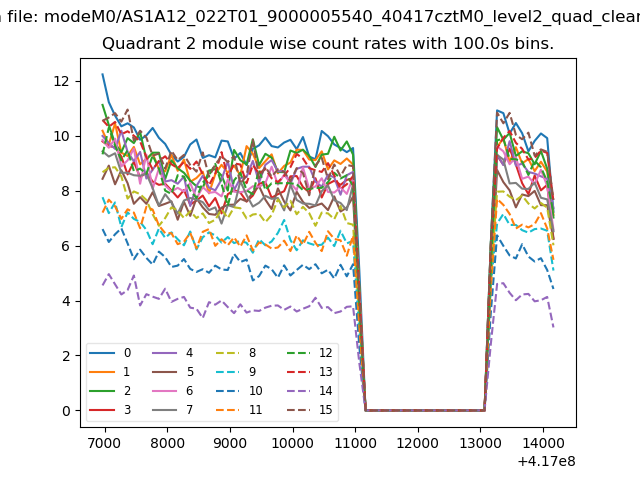
| Module-wise count rates for Quadrant B Data is divided into 100 sec bins |
 |
 |
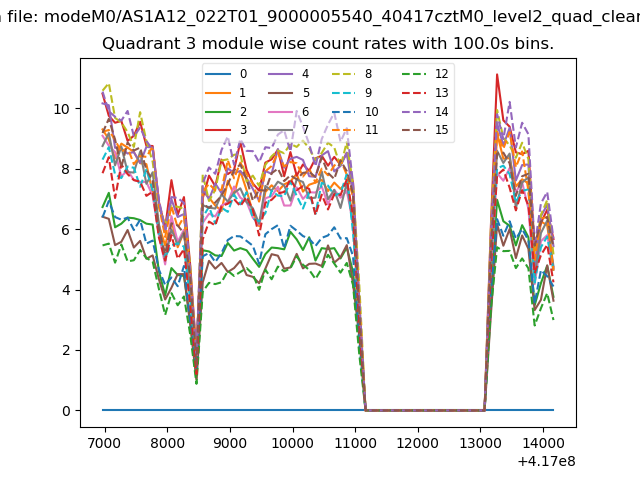
| Module-wise count rates for Quadrant C Data is divided into 100 sec bins |
 |
 |
| Module-wise count rates for Quadrant D Data is divided into 100 sec bins |
 |
 |
| Parameter | Plot |
|---|---|
| CZT HV Monitor | 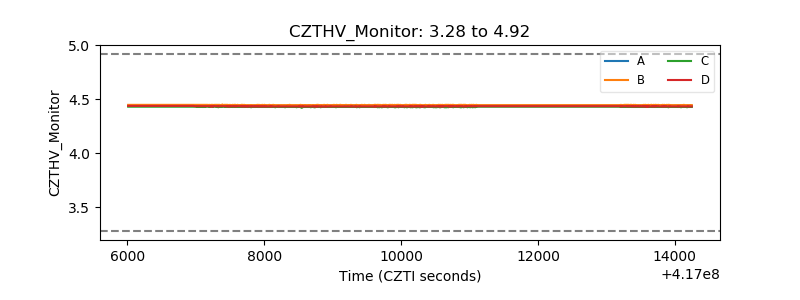 |
| D_VDD | 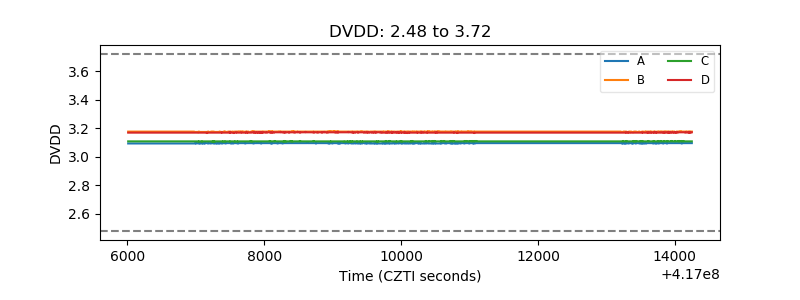 |
| Temperature 1 | 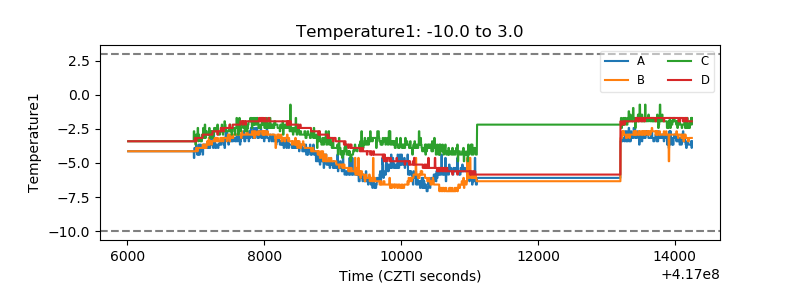 |
| Veto HV Monitor | 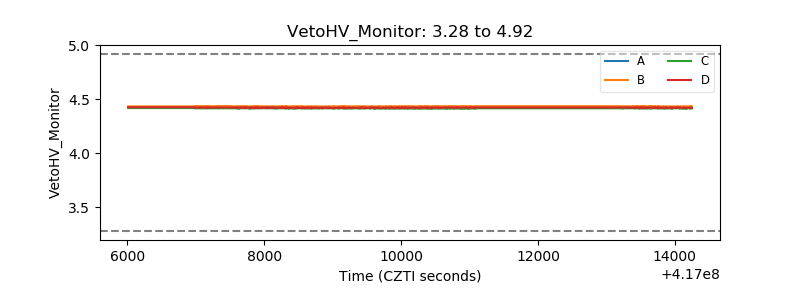 |
| Veto LLD | 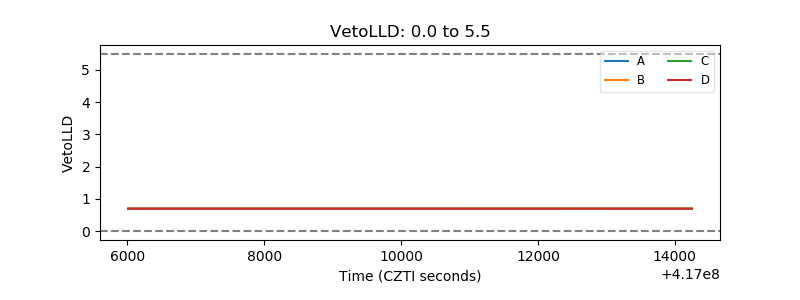 |
| Alpha Counter | 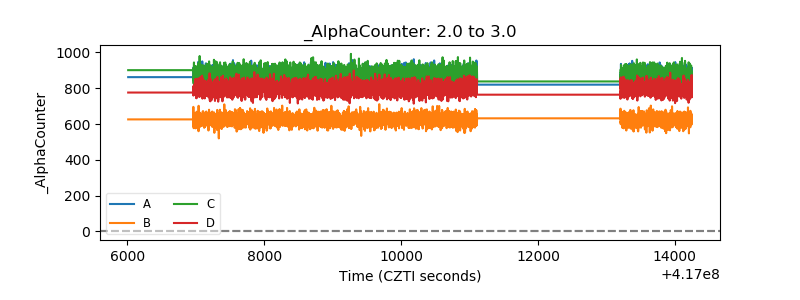 |
| _CPM_Rate | 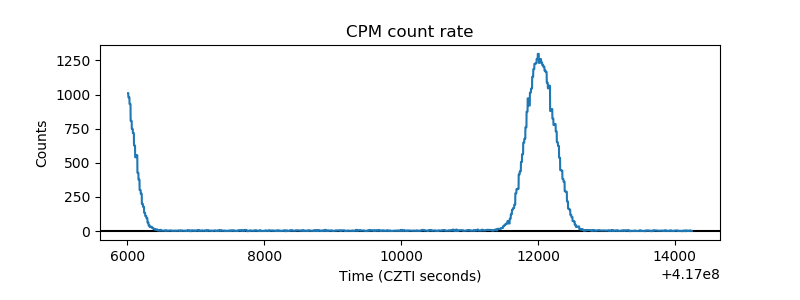 |
| CZT Counter |  |
| +2.5 Volts monitor | 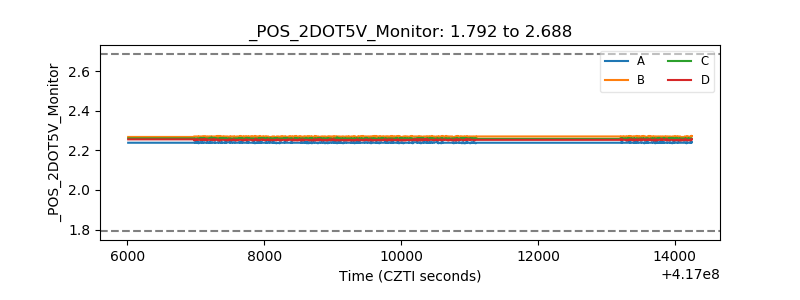 |
| +5 Volts monitor | 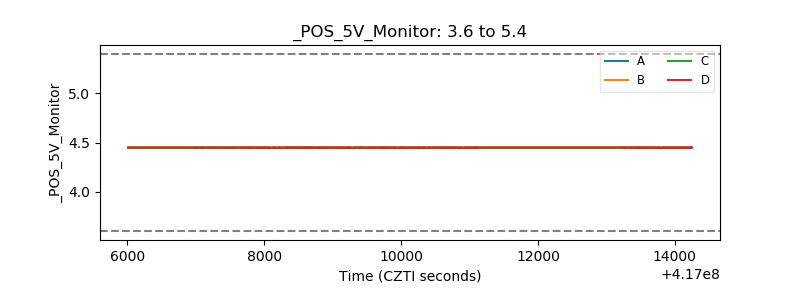 |
| _ROLL_ROT | 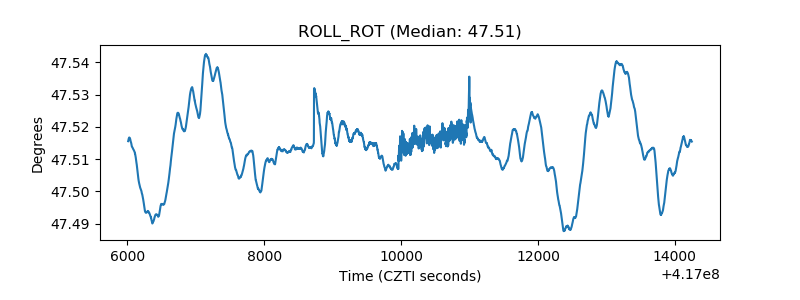 |
| _Roll_DEC | 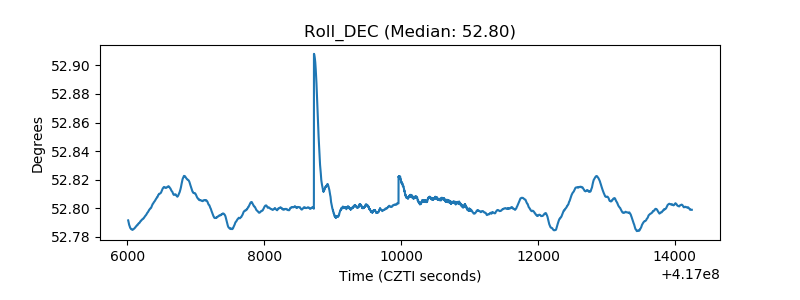 |
| _Roll_RA | 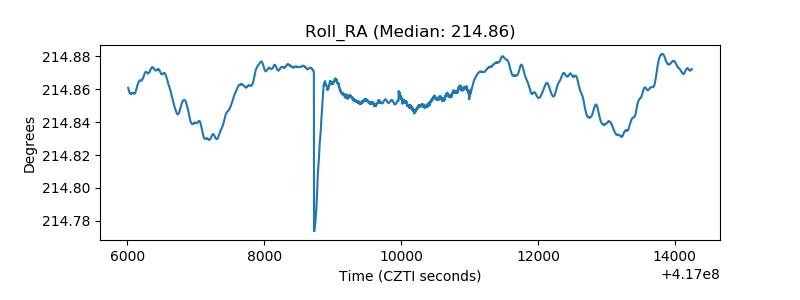 |
| Veto Counter | 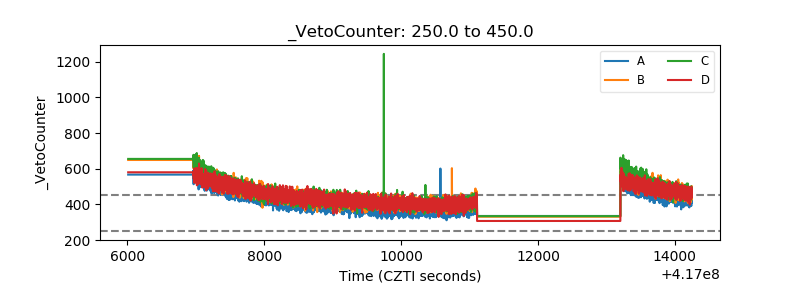 |