| Param | Original file | Final file |
|---|---|---|
| Filename | modeM0/AS1A12_022T01_9000005540_40418cztM0_level2.fits | modeM0/AS1A12_022T01_9000005540_40418cztM0_level2_quad_clean.evt |
| Size (bytes) | 340,240,320 | 90,696,960 |
| Size | 324.5 MB | 86.5 MB |
| Events in quadrant A | 2,893,350 | 645,980 |
| Events in quadrant B | 2,445,309 | 661,102 |
| Events in quadrant C | 2,634,634 | 619,884 |
| Events in quadrant D | 4,227,173 | 465,294 |
| Mode M0 | |||
|---|---|---|---|
| Quadrant | BADHDUFLAG | Total packets | Discarded packets |
| A | 0 | 11748 | 3 |
| B | 0 | 10346 | 2 |
| C | 0 | 10716 | 2 |
| D | 0 | 15944 | 2 |
| Mode M9 | |||
|---|---|---|---|
| Quadrant | BADHDUFLAG | Total packets | Discarded packets |
| A | 0 | 26 | 0 |
| B | 0 | 26 | 0 |
| C | 0 | 26 | 0 |
| D | 0 | 27 | 0 |
| Mode SS | |||
|---|---|---|---|
| Quadrant | BADHDUFLAG | Total packets | Discarded packets |
| A | 0 | 104 | 0 |
| B | 0 | 104 | 0 |
| C | 0 | 104 | 0 |
| D | 0 | 104 | 0 |
| Quadrant | Total seconds | Saturated seconds | Saturation percentage |
|---|---|---|---|
| A | 5050 | 27 | 0.534653% |
| B | 5050 | 7 | 0.138614% |
| C | 5050 | 23 | 0.455446% |
| D | 5050 | 1158 | 22.930693% |
Noise dominated data is calculated using 1-second bins in cleaned event files. If a bin has >2000 counts, and if more than 50% of those come from <1% of pixels, then it is considered to be noise-dominated and hence unusable.
| Quadrant | # 1 sec bins | Bins with >0 counts | Bins with >2000 counts | High rate bins dominated by noise | Noise dominated (total time) | Noise dominated (detector-on time) | Marked lightcurve |
|---|---|---|---|---|---|---|---|
| A | 7171 | 5051 | 18 | 18 | 0.25% | 0.36% | 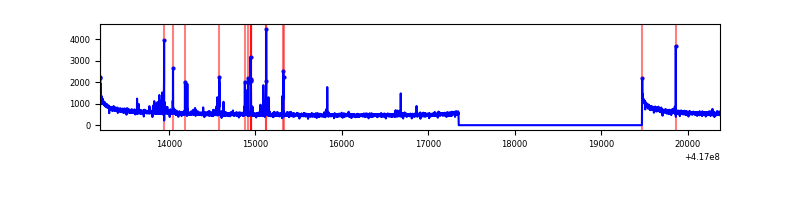 |
| B | 7171 | 5051 | 2 | 2 | 0.03% | 0.04% | 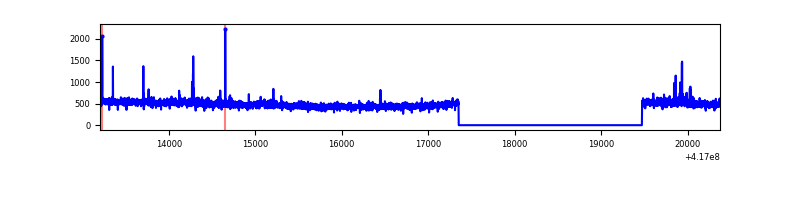 |
| C | 7171 | 5051 | 20 | 20 | 0.28% | 0.40% | 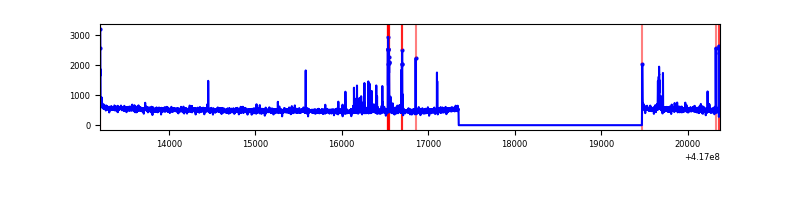 |
| D | 7171 | 5051 | 296 | 296 | 4.13% | 5.86% | 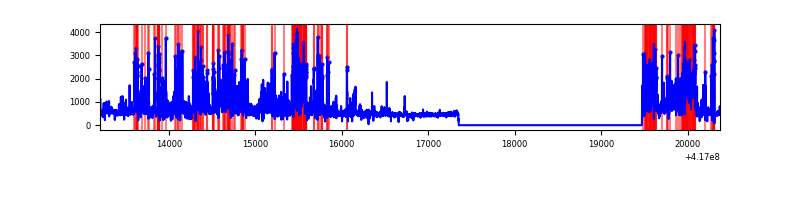 |
Top three noisy pixels from each quadrant. If the there are fewer than three noisy pixels in the level2.evt file, extra rows are filled as -1
| Pixel properties | Quadrant properties | ||||||
|---|---|---|---|---|---|---|---|
| Quadrant | DetID | PixID | Counts | Sigma | Mean | Median | Sigma |
| A | 10 | 83 | 465350 | 3850.93 | 594 | 583 | 120.7 |
| A | 13 | 248 | 131655 | 1086.03 | 594 | 583 | 120.7 |
| A | 3 | 137 | 6062 | 45.4 | 594 | 583 | 120.7 |
| B | 5 | 255 | 40114 | 349.24 | 591 | 575 | 113.2 |
| B | 3 | 112 | 36635 | 318.52 | 591 | 575 | 113.2 |
| B | 7 | 202 | 26041 | 224.94 | 591 | 575 | 113.2 |
| C | 15 | 214 | 220406 | 1643.09 | 580 | 584 | 133.8 |
| C | 14 | 254 | 133040 | 990.06 | 580 | 584 | 133.8 |
| C | 0 | 10 | 21149 | 153.72 | 580 | 584 | 133.8 |
| D | 12 | 227 | 1436300 | 11091.51 | 528 | 514 | 129.4 |
| D | 13 | 171 | 220938 | 1702.78 | 528 | 514 | 129.4 |
| D | 12 | 191 | 187160 | 1441.85 | 528 | 514 | 129.4 |
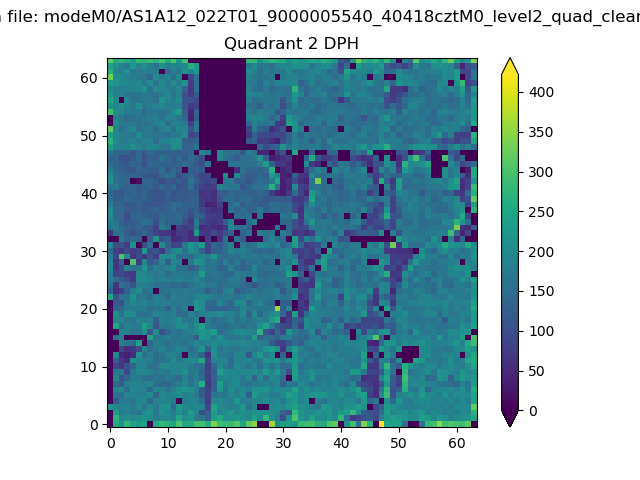
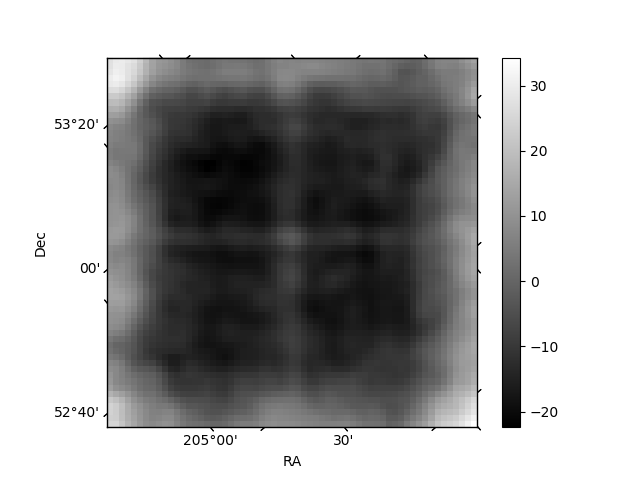
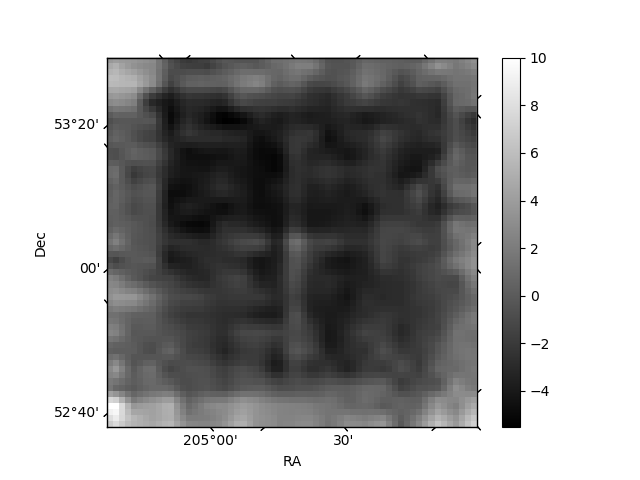
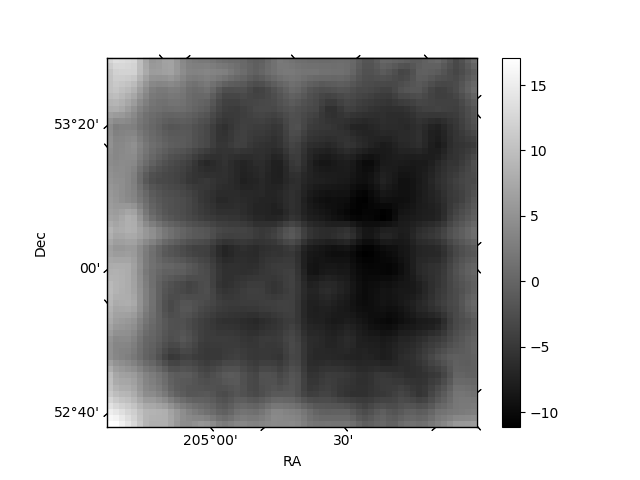
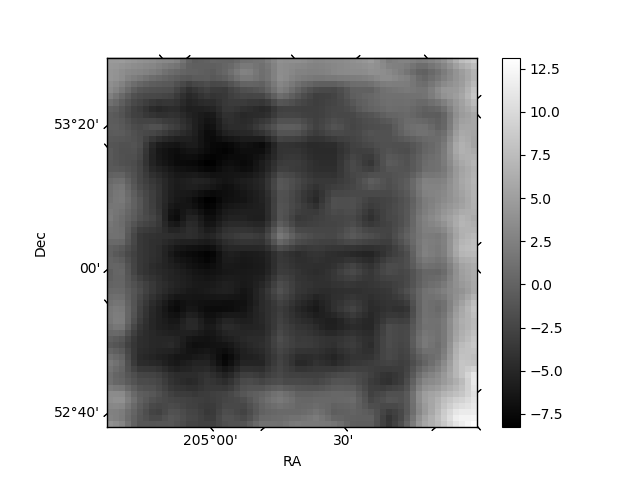
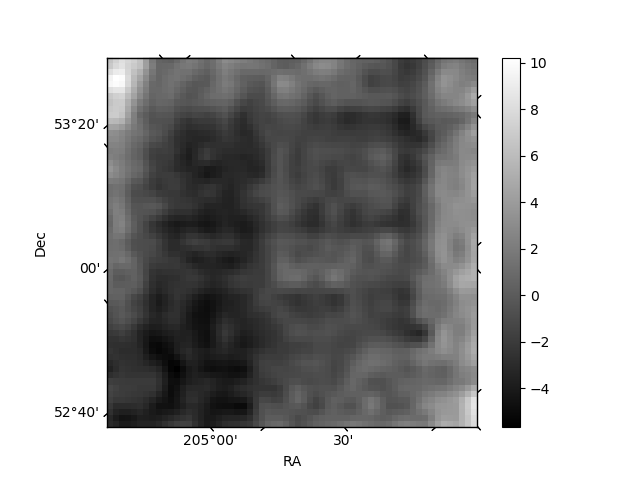
Histogram calculated using DETX and DETY for each event in the final _common_clean file
| Quadrant A |  |
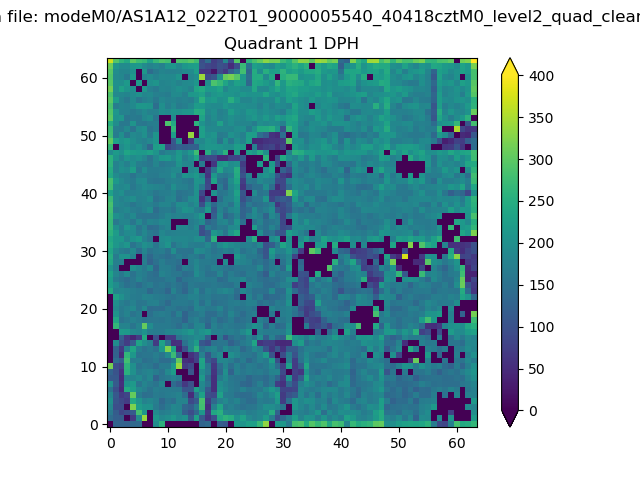 |
Quadrant B |
|---|---|---|---|
| Quadrant D | 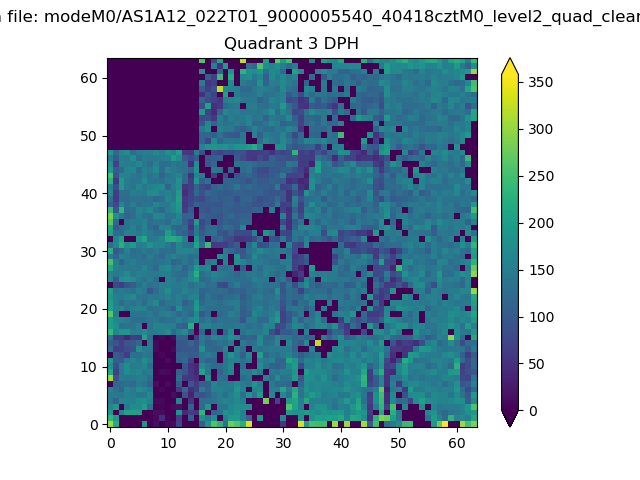 |
 |
Quadrant C |
| Plot type | Count rate plots | Images |
|---|---|---|
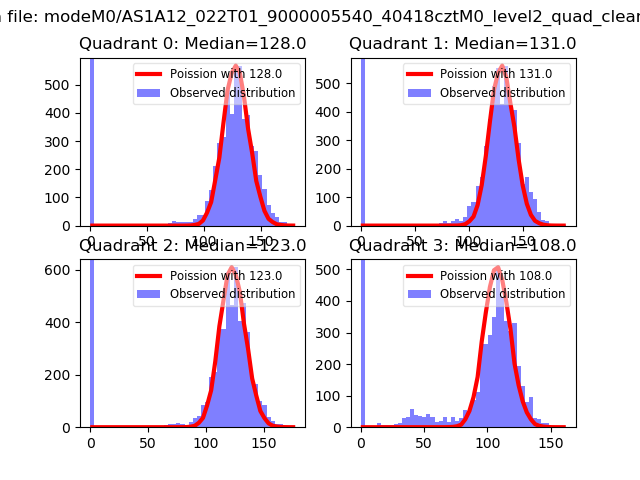
| Comparison with Poisson distribution Blue bars denote a histogram of data divided into 1 sec bins. Red curve is a Poisson curve with rate = median count rate of data. |
 |
 |
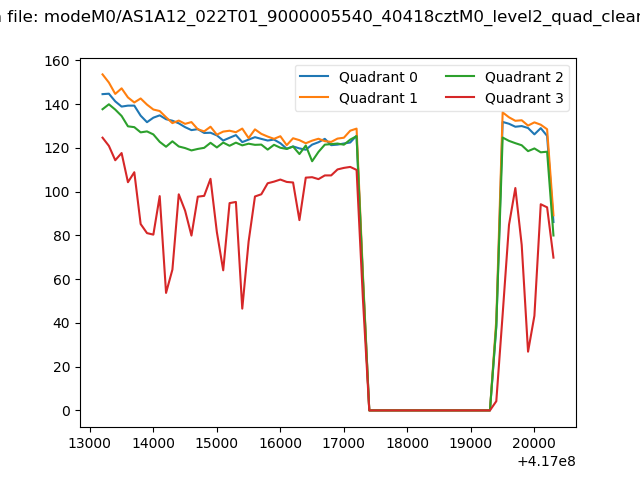
| Quadrant-wise count rates Data is divided into 100 sec bins |
 |
|
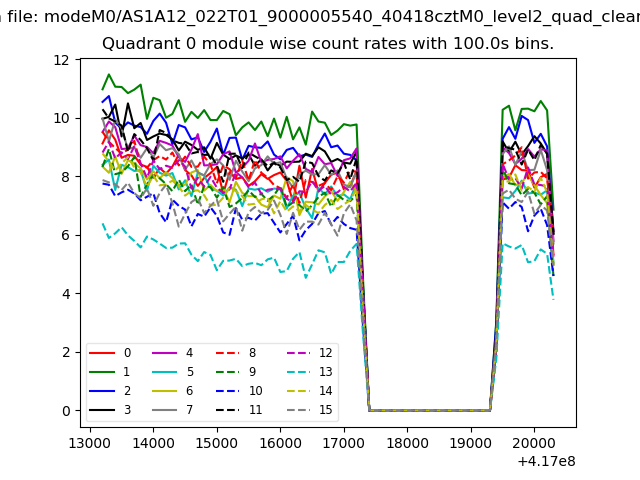
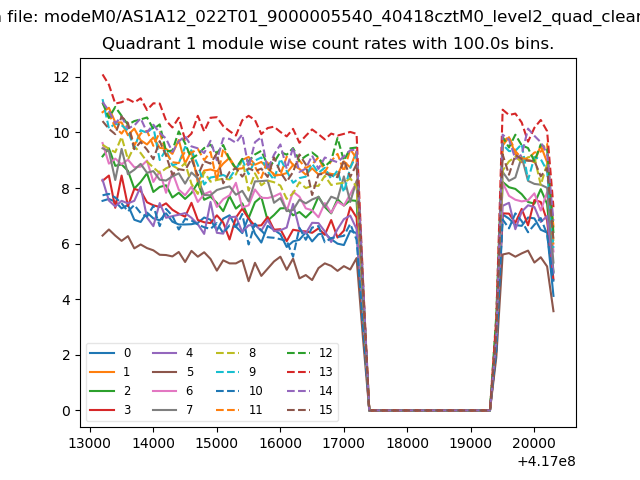
| Module-wise count rates for Quadrant A Data is divided into 100 sec bins |
 |
 |
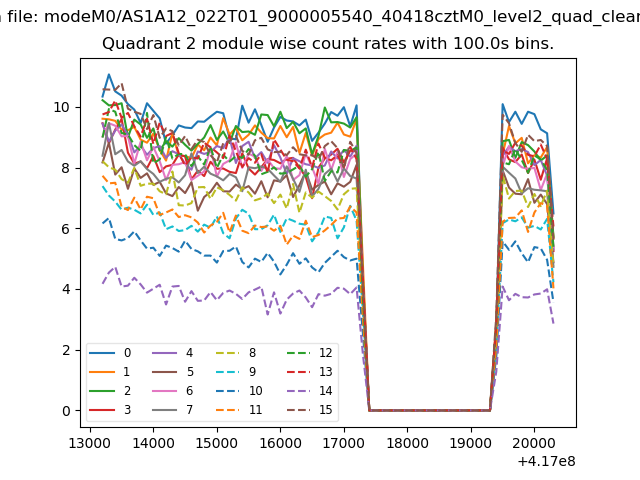
| Module-wise count rates for Quadrant B Data is divided into 100 sec bins |
 |
 |
| Module-wise count rates for Quadrant C Data is divided into 100 sec bins |
 |
 |
| Module-wise count rates for Quadrant D Data is divided into 100 sec bins |
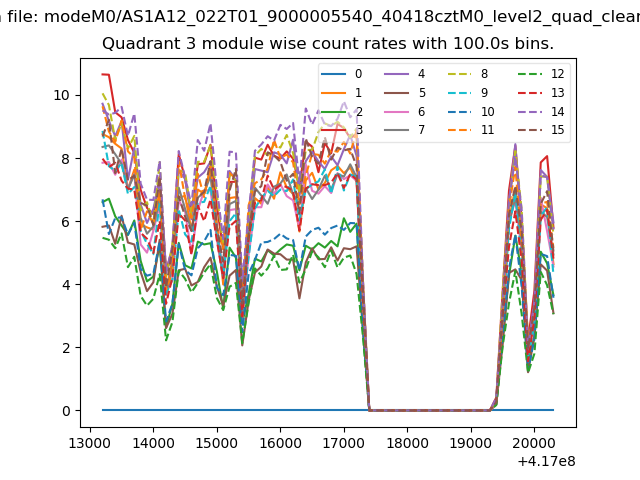 |
 |
| Parameter | Plot |
|---|---|
| CZT HV Monitor |  |
| D_VDD | 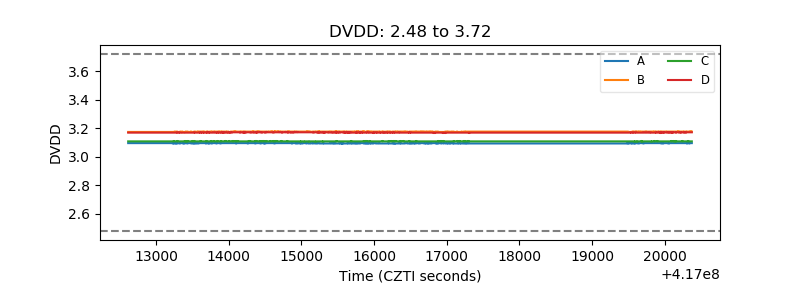 |
| Temperature 1 | 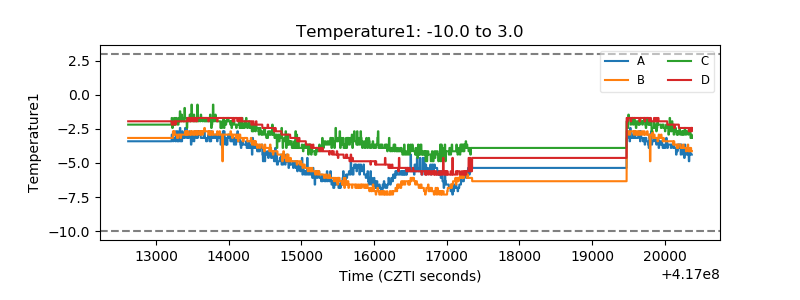 |
| Veto HV Monitor | 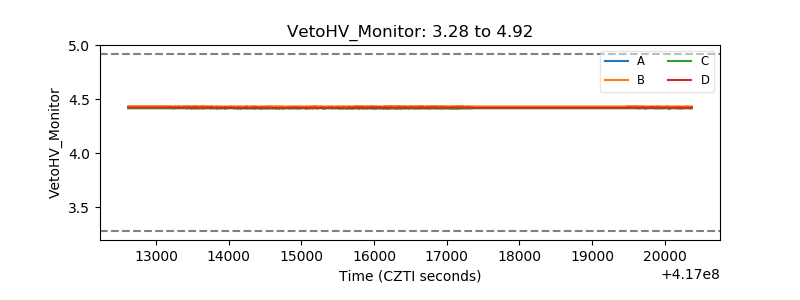 |
| Veto LLD | 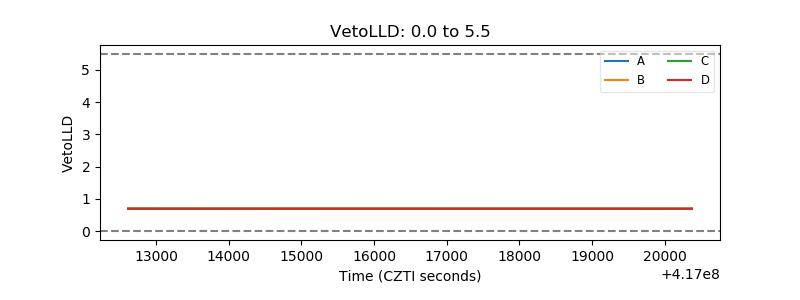 |
| Alpha Counter | 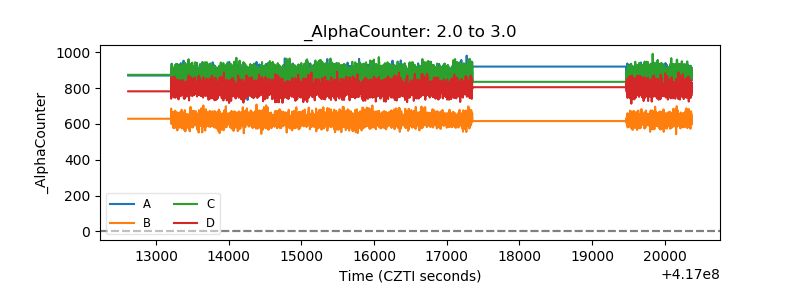 |
| _CPM_Rate | 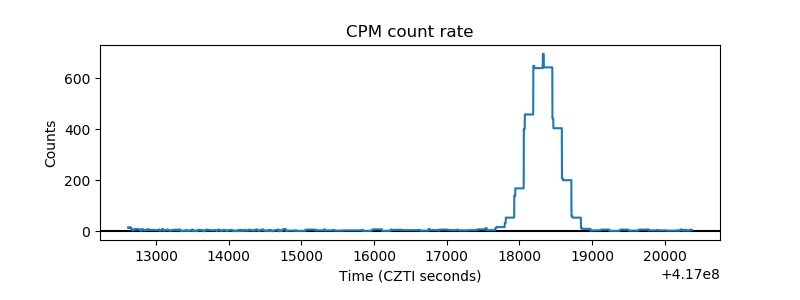 |
| CZT Counter | 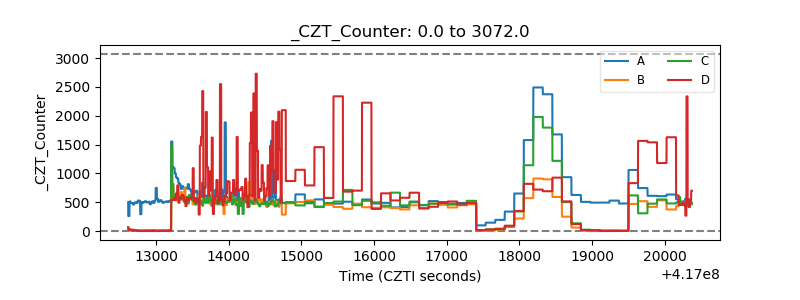 |
| +2.5 Volts monitor |  |
| +5 Volts monitor | 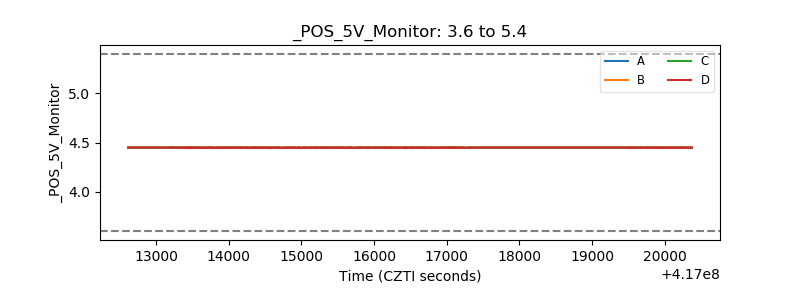 |
| _ROLL_ROT | 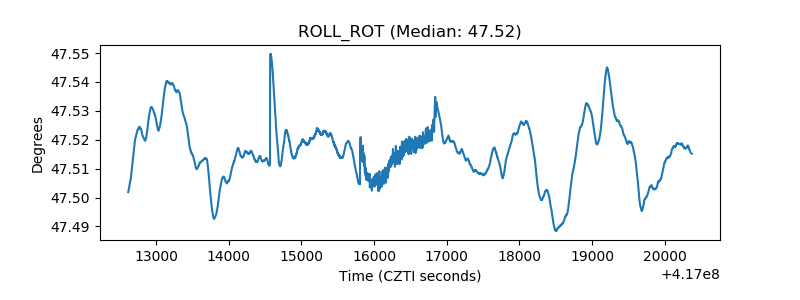 |
| _Roll_DEC | 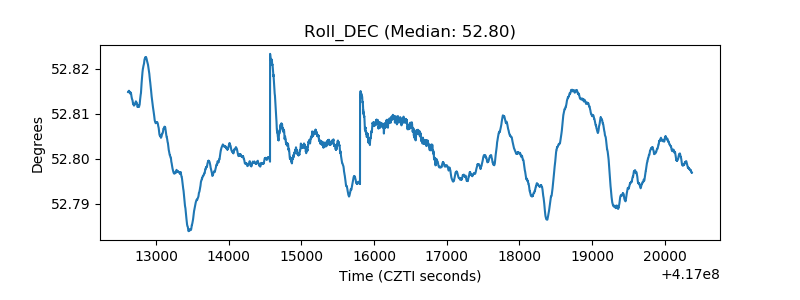 |
| _Roll_RA | 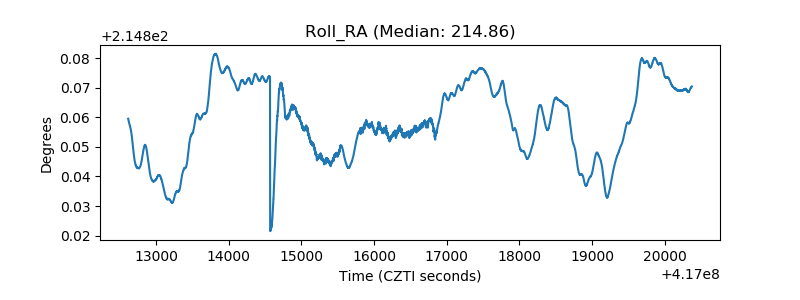 |
| Veto Counter | 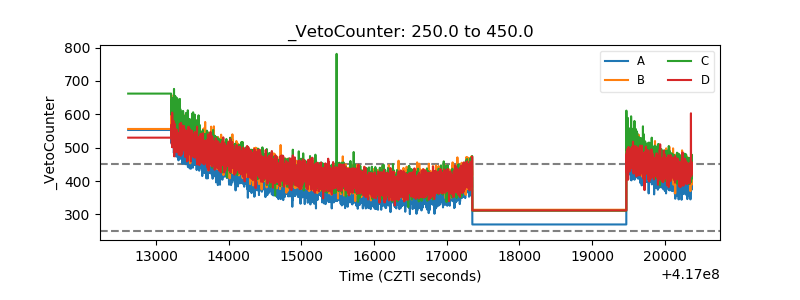 |