| Param | Original file | Final file |
|---|---|---|
| Filename | modeM0/AS1A12_022T01_9000005540_40419cztM0_level2.fits | modeM0/AS1A12_022T01_9000005540_40419cztM0_level2_quad_clean.evt |
| Size (bytes) | 322,361,280 | 85,354,560 |
| Size | 307.4 MB | 81.4 MB |
| Events in quadrant A | 2,634,272 | 597,113 |
| Events in quadrant B | 2,825,572 | 608,780 |
| Events in quadrant C | 2,562,188 | 579,673 |
| Events in quadrant D | 3,521,872 | 449,705 |
| Mode M0 | |||
|---|---|---|---|
| Quadrant | BADHDUFLAG | Total packets | Discarded packets |
| A | 0 | 10953 | 3 |
| B | 0 | 11769 | 2 |
| C | 0 | 10611 | 2 |
| D | 0 | 13871 | 2 |
| Mode M9 | |||
|---|---|---|---|
| Quadrant | BADHDUFLAG | Total packets | Discarded packets |
| A | 0 | 35 | 0 |
| B | 0 | 35 | 0 |
| C | 0 | 35 | 0 |
| D | 0 | 36 | 0 |
| Mode SS | |||
|---|---|---|---|
| Quadrant | BADHDUFLAG | Total packets | Discarded packets |
| A | 0 | 102 | 0 |
| B | 0 | 102 | 0 |
| C | 0 | 102 | 0 |
| D | 0 | 102 | 0 |
| Quadrant | Total seconds | Saturated seconds | Saturation percentage |
|---|---|---|---|
| A | 4981 | 16 | 0.321221% |
| B | 4981 | 45 | 0.903433% |
| C | 4981 | 13 | 0.260992% |
| D | 4981 | 951 | 19.092552% |
Noise dominated data is calculated using 1-second bins in cleaned event files. If a bin has >2000 counts, and if more than 50% of those come from <1% of pixels, then it is considered to be noise-dominated and hence unusable.
| Quadrant | # 1 sec bins | Bins with >0 counts | Bins with >2000 counts | High rate bins dominated by noise | Noise dominated (total time) | Noise dominated (detector-on time) | Marked lightcurve |
|---|---|---|---|---|---|---|---|
| A | 7043 | 4982 | 4 | 4 | 0.06% | 0.08% | 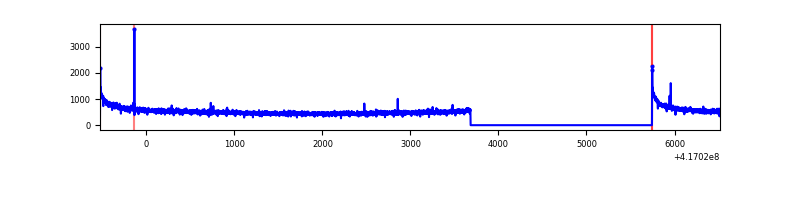 |
| B | 7043 | 4982 | 29 | 29 | 0.41% | 0.58% | 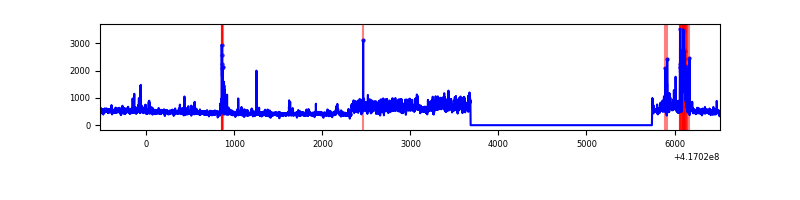 |
| C | 7043 | 4982 | 11 | 11 | 0.16% | 0.22% | 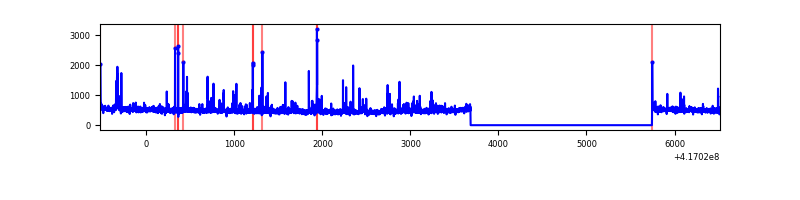 |
| D | 7043 | 4982 | 189 | 189 | 2.68% | 3.79% | 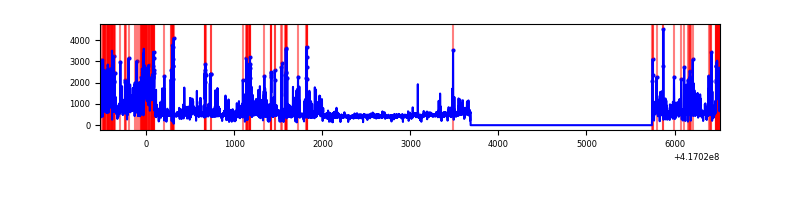 |
Top three noisy pixels from each quadrant. If the there are fewer than three noisy pixels in the level2.evt file, extra rows are filled as -1
| Pixel properties | Quadrant properties | ||||||
|---|---|---|---|---|---|---|---|
| Quadrant | DetID | PixID | Counts | Sigma | Mean | Median | Sigma |
| A | 10 | 83 | 458871 | 4013.57 | 559 | 549 | 114.2 |
| A | 13 | 248 | 12254 | 102.5 | 559 | 549 | 114.2 |
| A | 3 | 137 | 5803 | 46.01 | 559 | 549 | 114.2 |
| B | 7 | 202 | 357102 | 3348.05 | 555 | 540 | 106.5 |
| B | 5 | 255 | 233446 | 2186.94 | 555 | 540 | 106.5 |
| B | 3 | 112 | 29582 | 272.7 | 555 | 540 | 106.5 |
| C | 15 | 214 | 217268 | 1683.73 | 551 | 555 | 128.7 |
| C | 14 | 254 | 180636 | 1399.12 | 551 | 555 | 128.7 |
| C | 0 | 10 | 13655 | 101.78 | 551 | 555 | 128.7 |
| D | 12 | 227 | 797655 | 6337.63 | 504 | 490 | 125.8 |
| D | 13 | 171 | 301235 | 2390.99 | 504 | 490 | 125.8 |
| D | 12 | 191 | 195631 | 1551.41 | 504 | 490 | 125.8 |
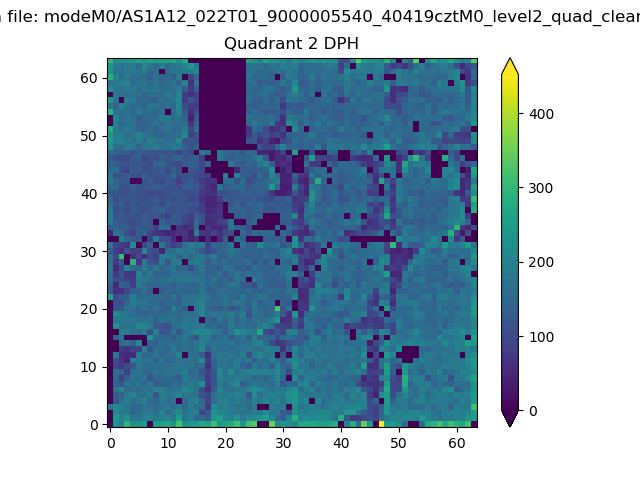
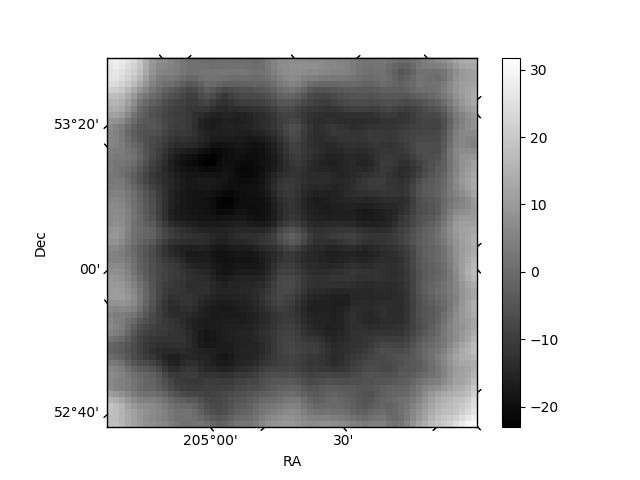
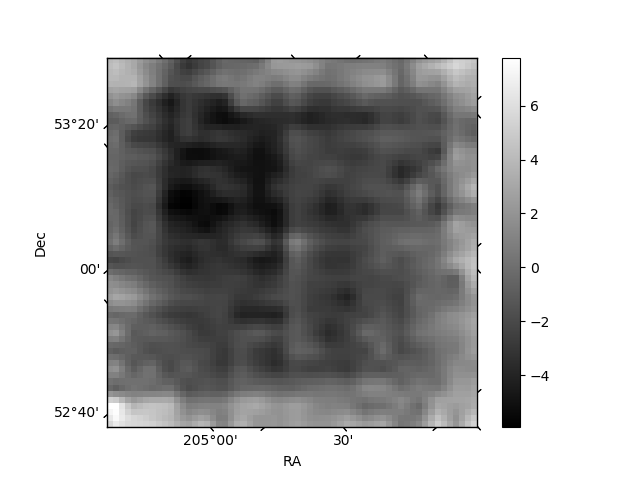
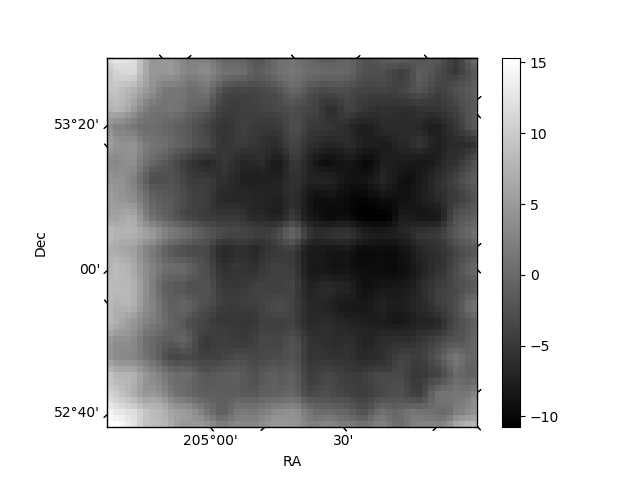
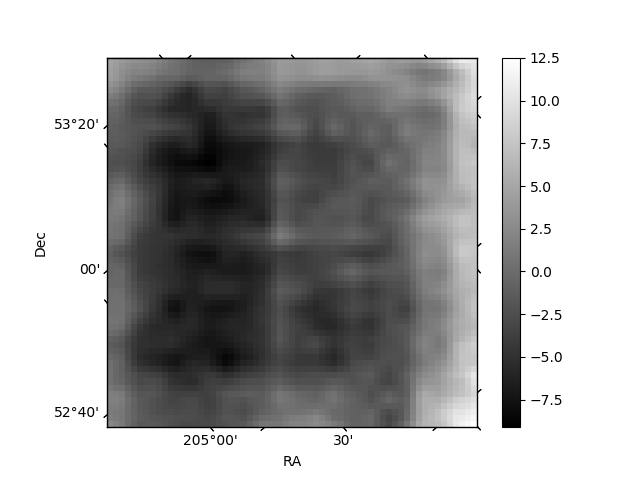
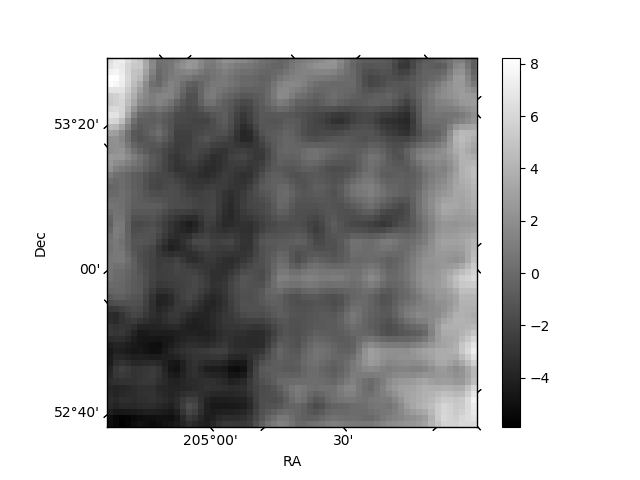
Histogram calculated using DETX and DETY for each event in the final _common_clean file
| Quadrant A |  |
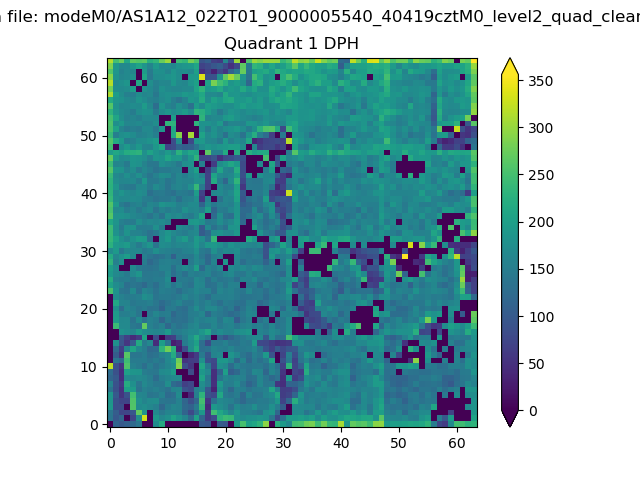 |
Quadrant B |
|---|---|---|---|
| Quadrant D | 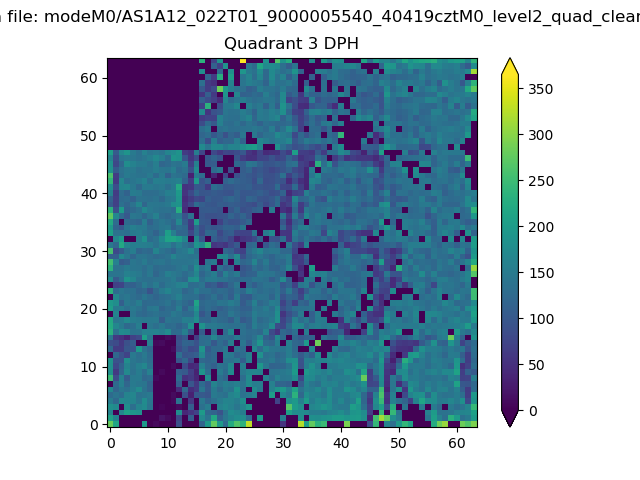 |
 |
Quadrant C |
| Plot type | Count rate plots | Images |
|---|---|---|
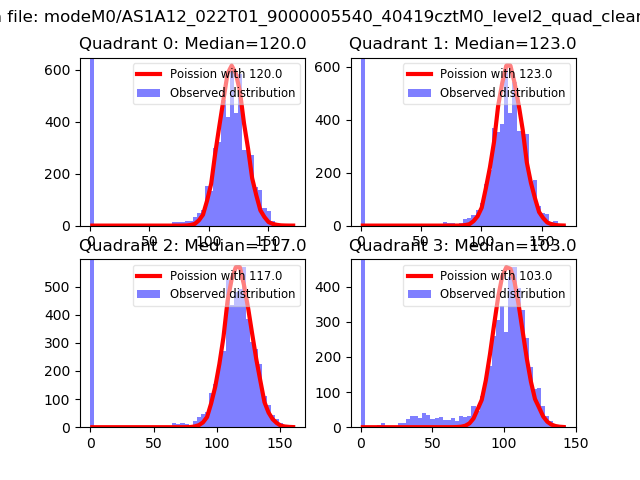
| Comparison with Poisson distribution Blue bars denote a histogram of data divided into 1 sec bins. Red curve is a Poisson curve with rate = median count rate of data. |
 |
 |
| Quadrant-wise count rates Data is divided into 100 sec bins |
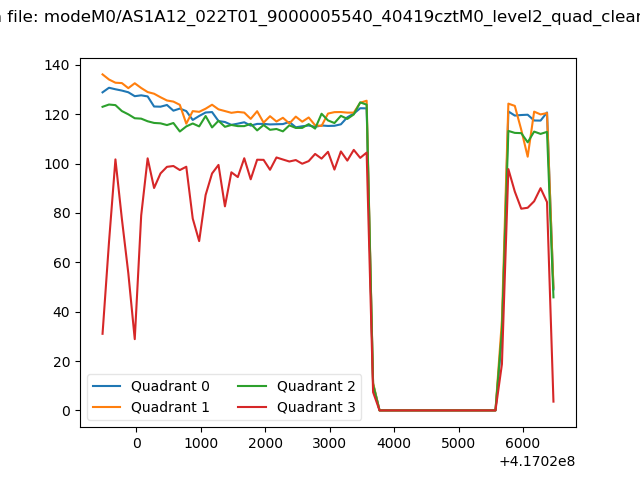 |
|
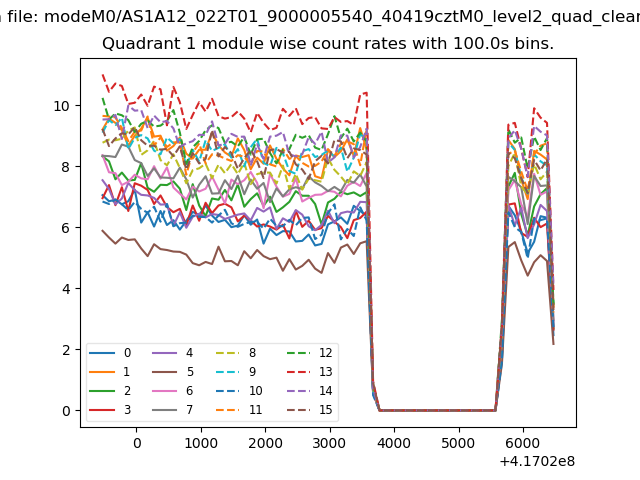
| Module-wise count rates for Quadrant A Data is divided into 100 sec bins |
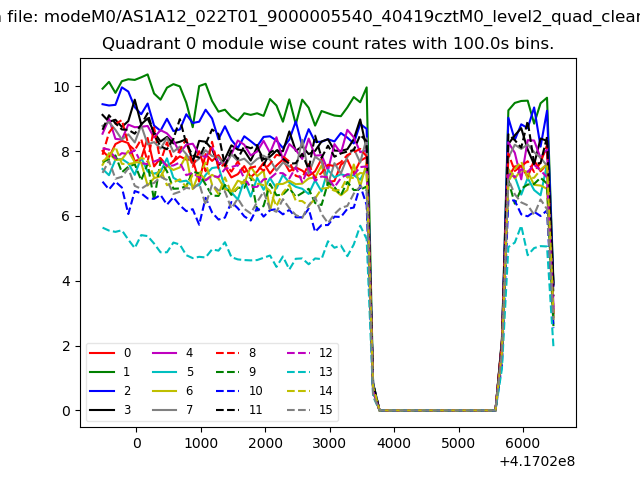 |
 |
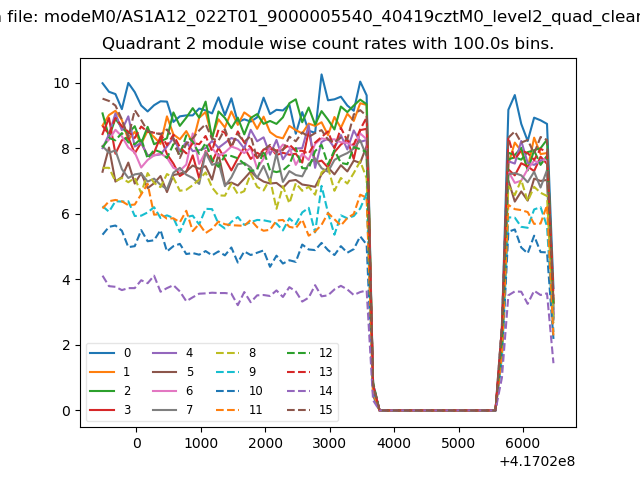
| Module-wise count rates for Quadrant B Data is divided into 100 sec bins |
 |
 |
| Module-wise count rates for Quadrant C Data is divided into 100 sec bins |
 |
 |
| Module-wise count rates for Quadrant D Data is divided into 100 sec bins |
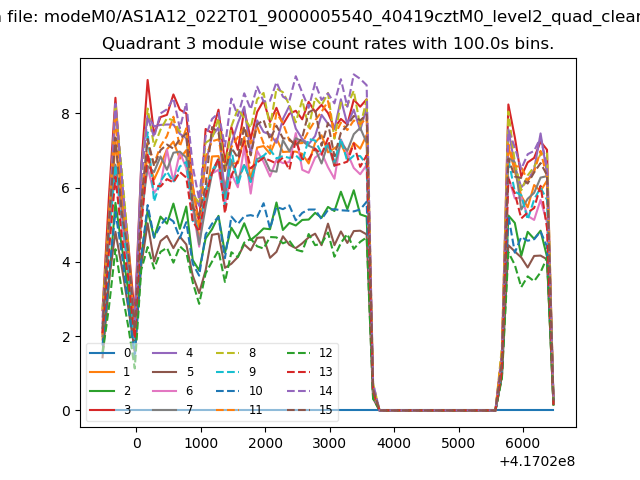 |
 |
| Parameter | Plot |
|---|---|
| CZT HV Monitor | 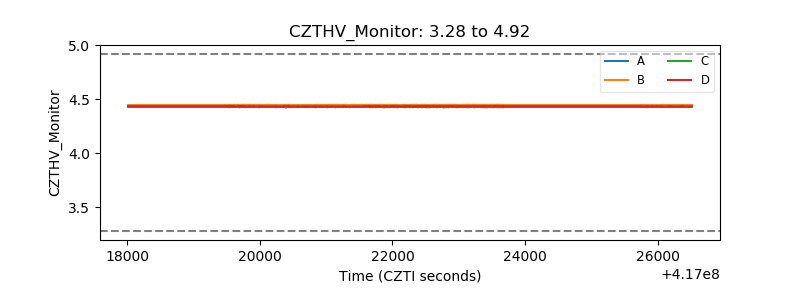 |
| D_VDD | 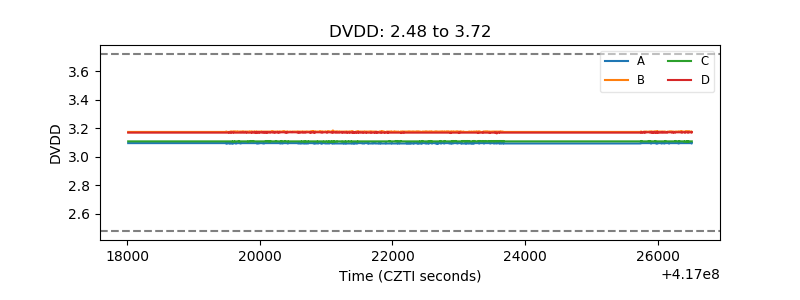 |
| Temperature 1 | 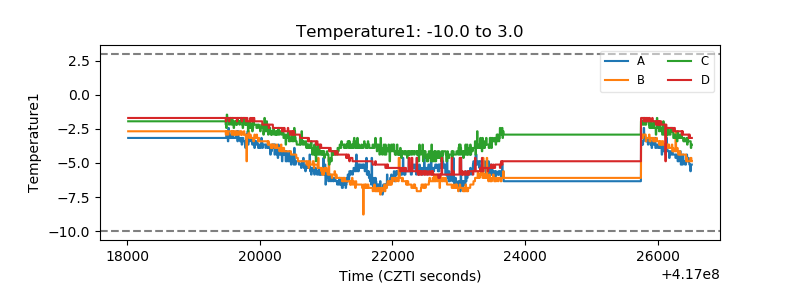 |
| Veto HV Monitor |  |
| Veto LLD | 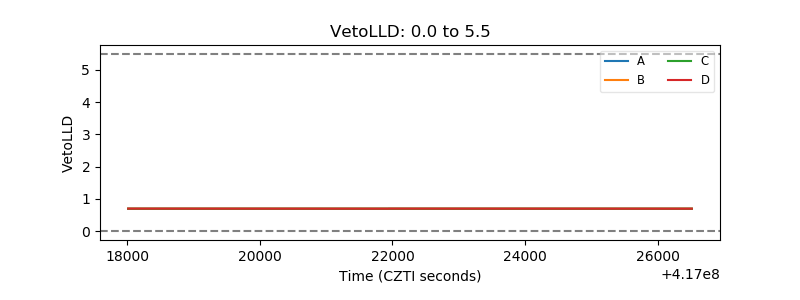 |
| Alpha Counter | 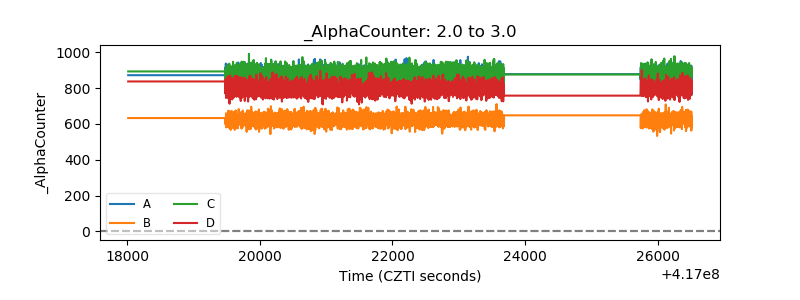 |
| _CPM_Rate | 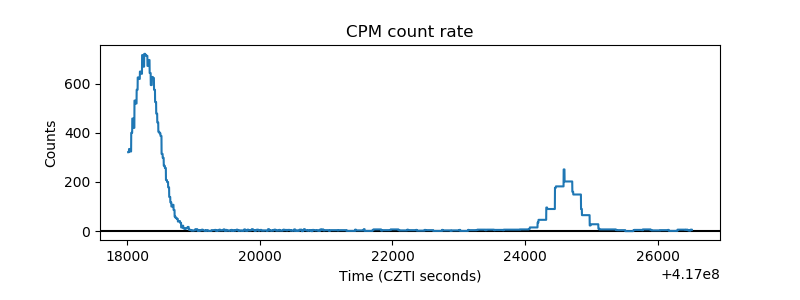 |
| CZT Counter | 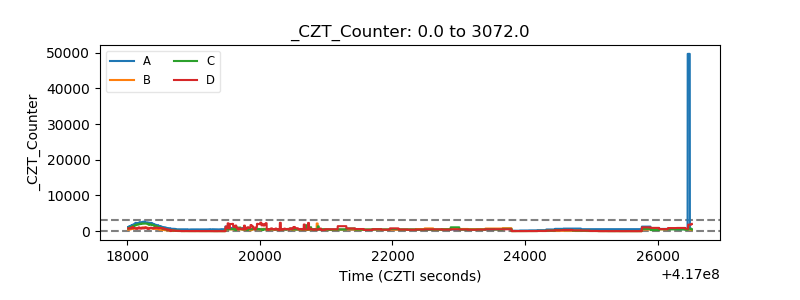 |
| +2.5 Volts monitor | 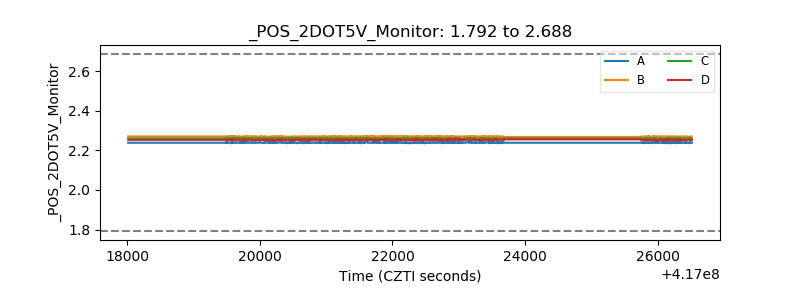 |
| +5 Volts monitor | 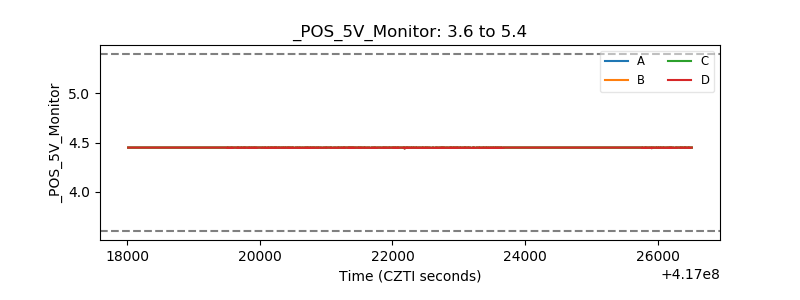 |
| _ROLL_ROT | 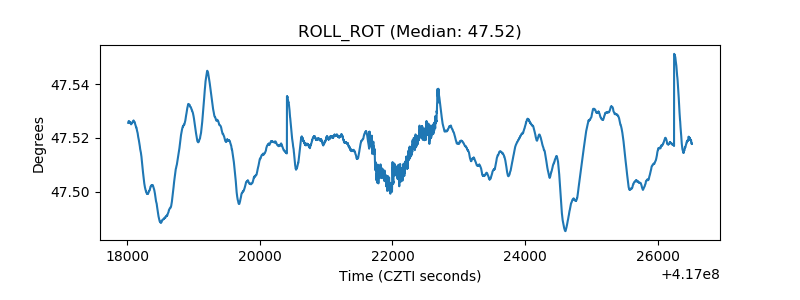 |
| _Roll_DEC | 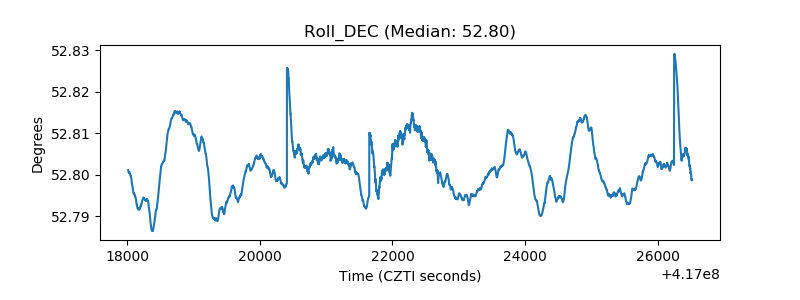 |
| _Roll_RA | 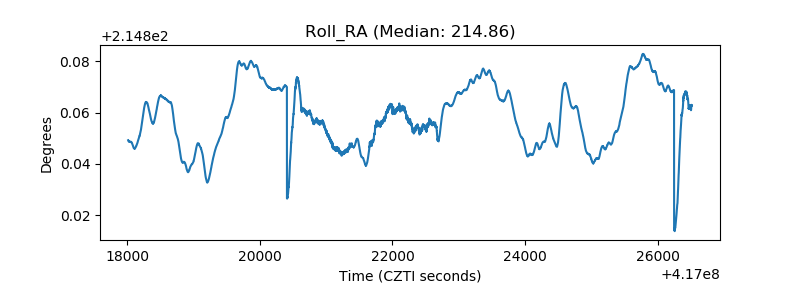 |
| Veto Counter | 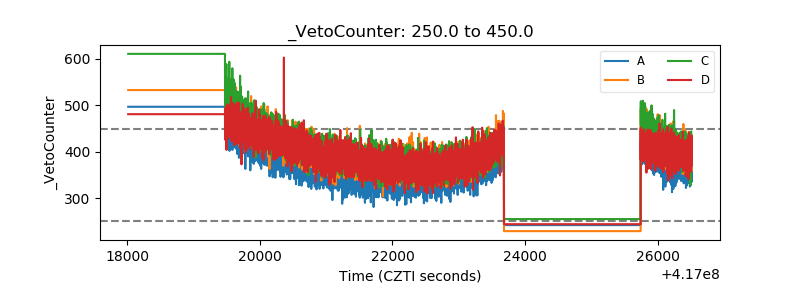 |