| Param | Original file | Final file |
|---|---|---|
| Filename | modeM0/AS1A12_022T01_9000005540_40420cztM0_level2.fits | modeM0/AS1A12_022T01_9000005540_40420cztM0_level2_quad_clean.evt |
| Size (bytes) | 316,350,720 | 89,904,960 |
| Size | 301.7 MB | 85.7 MB |
| Events in quadrant A | 2,819,601 | 611,250 |
| Events in quadrant B | 2,833,460 | 623,639 |
| Events in quadrant C | 2,641,598 | 600,133 |
| Events in quadrant D | 2,995,472 | 510,870 |
| Mode M0 | |||
|---|---|---|---|
| Quadrant | BADHDUFLAG | Total packets | Discarded packets |
| A | 0 | 11830 | 3 |
| B | 0 | 11948 | 2 |
| C | 0 | 11255 | 2 |
| D | 0 | 12749 | 2 |
| Mode M9 | |||
|---|---|---|---|
| Quadrant | BADHDUFLAG | Total packets | Discarded packets |
| A | 0 | 40 | 0 |
| B | 0 | 40 | 0 |
| C | 0 | 40 | 0 |
| D | 0 | 40 | 0 |
| Mode SS | |||
|---|---|---|---|
| Quadrant | BADHDUFLAG | Total packets | Discarded packets |
| A | 0 | 110 | 0 |
| B | 0 | 110 | 0 |
| C | 0 | 110 | 0 |
| D | 0 | 110 | 0 |
| Quadrant | Total seconds | Saturated seconds | Saturation percentage |
|---|---|---|---|
| A | 5385 | 19 | 0.352832% |
| B | 5385 | 48 | 0.891365% |
| C | 5385 | 26 | 0.482823% |
| D | 5385 | 521 | 9.675023% |
Noise dominated data is calculated using 1-second bins in cleaned event files. If a bin has >2000 counts, and if more than 50% of those come from <1% of pixels, then it is considered to be noise-dominated and hence unusable.
| Quadrant | # 1 sec bins | Bins with >0 counts | Bins with >2000 counts | High rate bins dominated by noise | Noise dominated (total time) | Noise dominated (detector-on time) | Marked lightcurve |
|---|---|---|---|---|---|---|---|
| A | 9299 | 5387 | 9 | 9 | 0.10% | 0.17% | 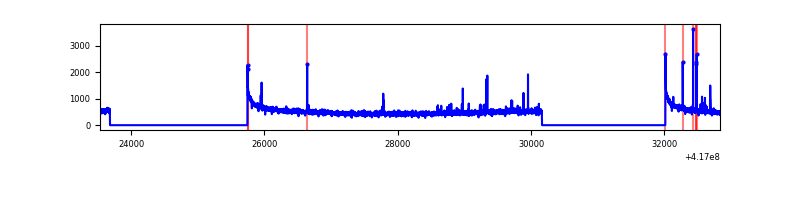 |
| B | 9299 | 5387 | 30 | 30 | 0.32% | 0.56% | 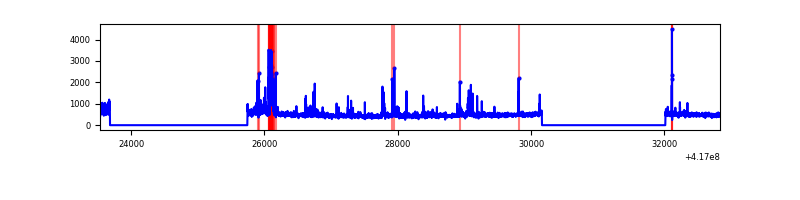 |
| C | 9299 | 5387 | 18 | 18 | 0.19% | 0.33% | 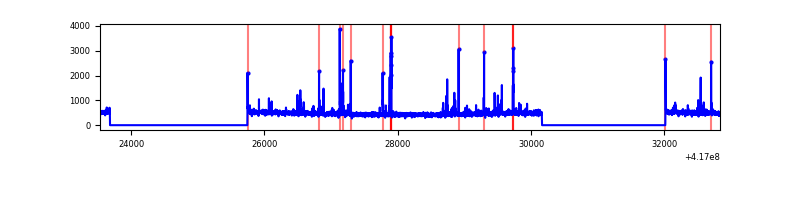 |
| D | 9299 | 5387 | 80 | 80 | 0.86% | 1.49% | 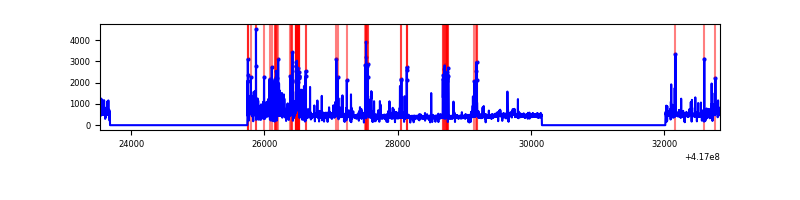 |
Top three noisy pixels from each quadrant. If the there are fewer than three noisy pixels in the level2.evt file, extra rows are filled as -1
| Pixel properties | Quadrant properties | ||||||
|---|---|---|---|---|---|---|---|
| Quadrant | DetID | PixID | Counts | Sigma | Mean | Median | Sigma |
| A | 10 | 83 | 481947 | 4031.62 | 584 | 574 | 119.4 |
| A | 13 | 248 | 41783 | 345.14 | 584 | 574 | 119.4 |
| A | 2 | 79 | 34079 | 280.61 | 584 | 574 | 119.4 |
| B | 5 | 255 | 221068 | 1970.71 | 581 | 566 | 111.9 |
| B | 4 | 170 | 139079 | 1237.94 | 581 | 566 | 111.9 |
| B | 7 | 202 | 135094 | 1202.33 | 581 | 566 | 111.9 |
| C | 15 | 214 | 230298 | 1712.58 | 576 | 579 | 134.1 |
| C | 14 | 254 | 146550 | 1088.23 | 576 | 579 | 134.1 |
| C | 0 | 10 | 11626 | 82.36 | 576 | 579 | 134.1 |
| D | 12 | 227 | 305541 | 2269.02 | 545 | 529 | 134.4 |
| D | 13 | 171 | 224829 | 1668.6 | 545 | 529 | 134.4 |
| D | 12 | 191 | 162919 | 1208.04 | 545 | 529 | 134.4 |
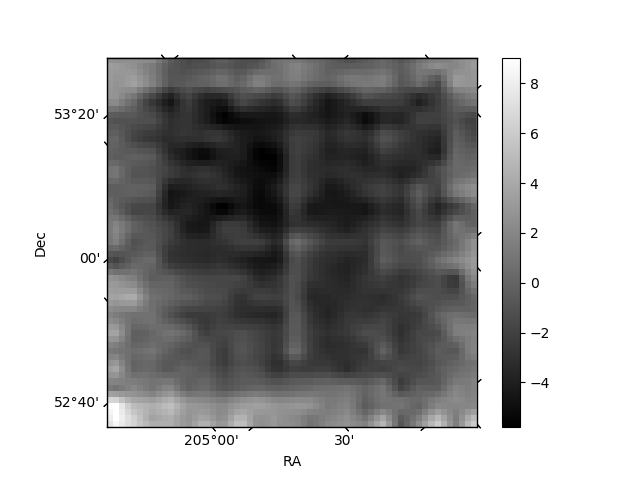
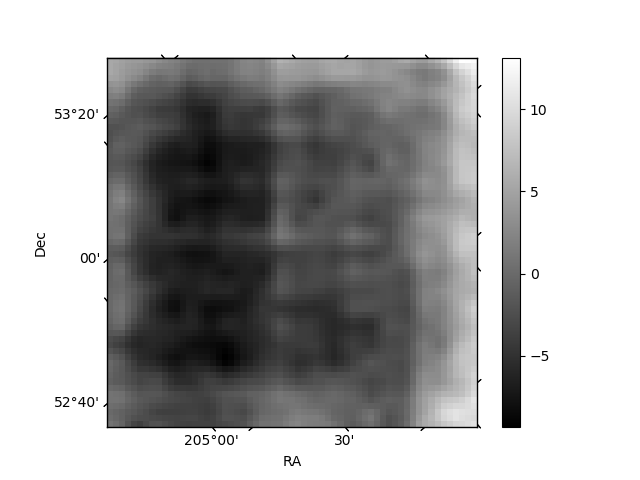
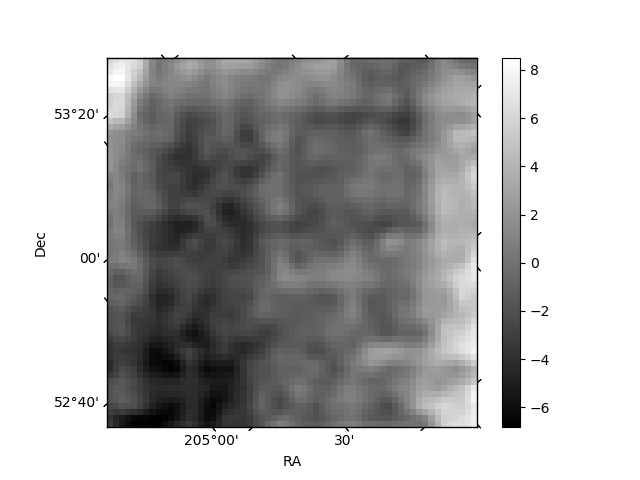
Histogram calculated using DETX and DETY for each event in the final _common_clean file
| Quadrant A | 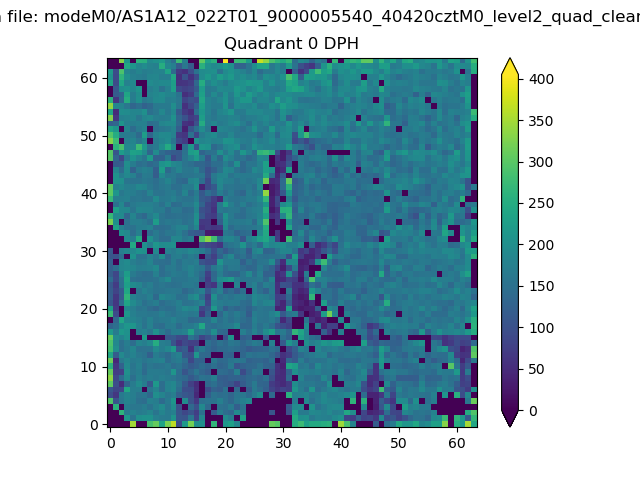 |
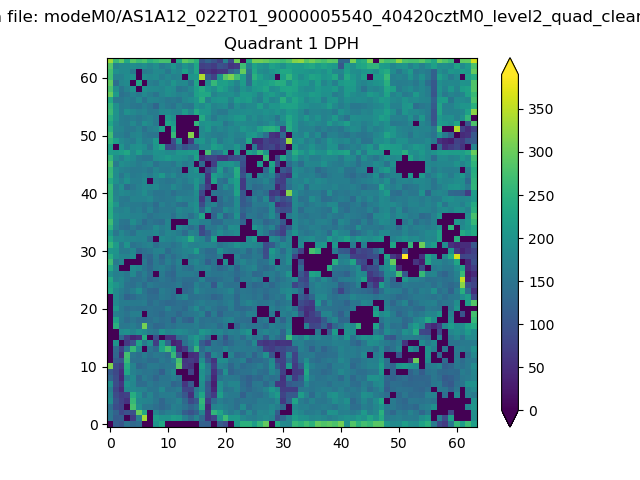 |
Quadrant B |
|---|---|---|---|
| Quadrant D | 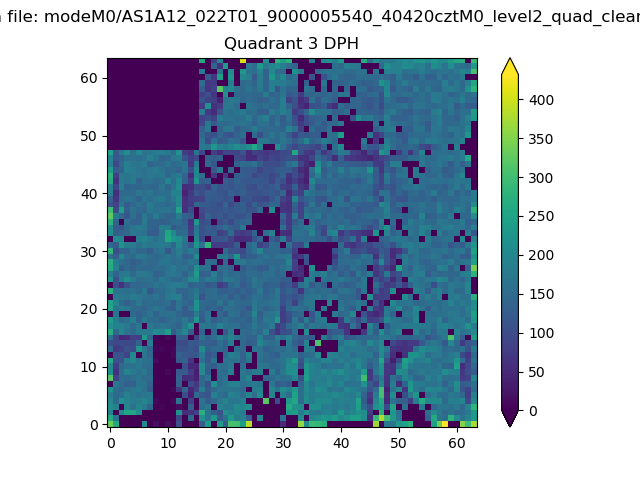 |
 |
Quadrant C |
| Plot type | Count rate plots | Images |
|---|---|---|
| Comparison with Poisson distribution Blue bars denote a histogram of data divided into 1 sec bins. Red curve is a Poisson curve with rate = median count rate of data. |
 |
 |
| Quadrant-wise count rates Data is divided into 100 sec bins |
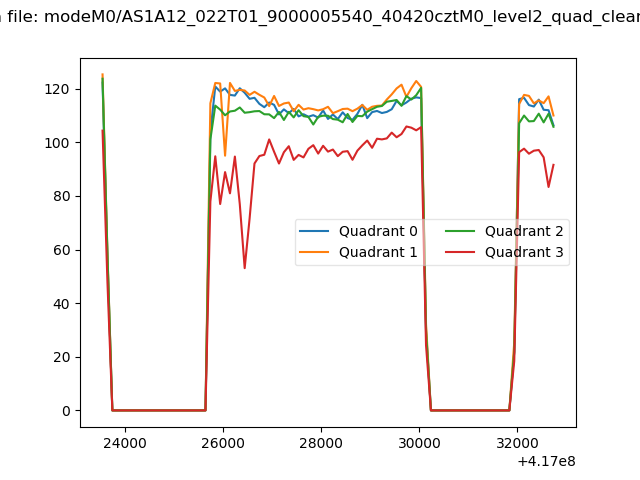 |
|
| Module-wise count rates for Quadrant A Data is divided into 100 sec bins |
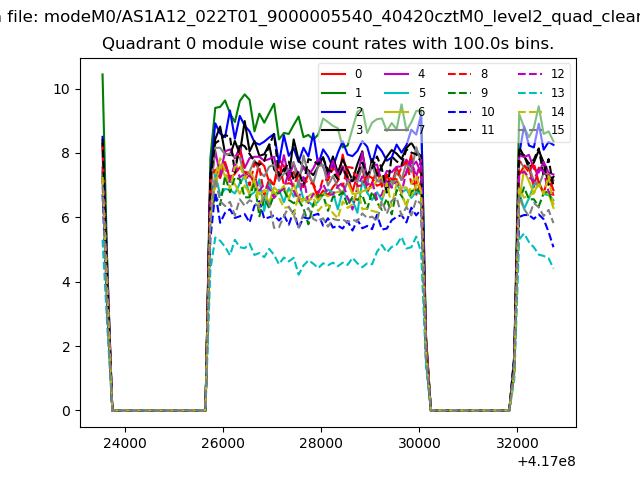 |
 |
| Module-wise count rates for Quadrant B Data is divided into 100 sec bins |
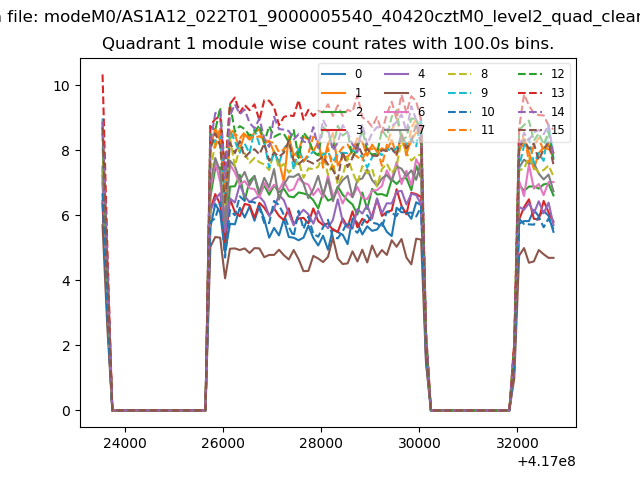 |
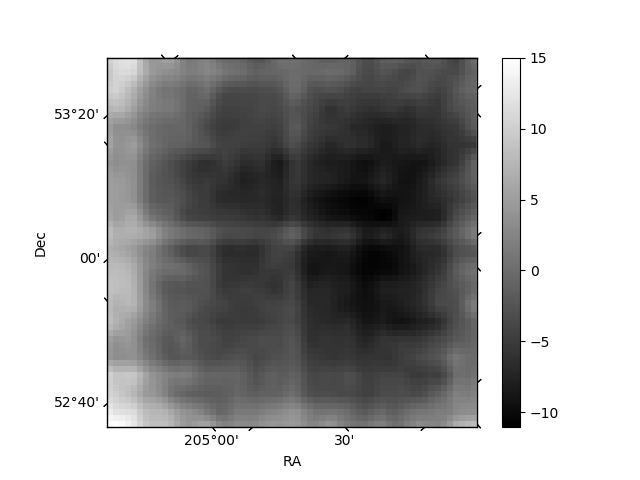 |
| Module-wise count rates for Quadrant C Data is divided into 100 sec bins |
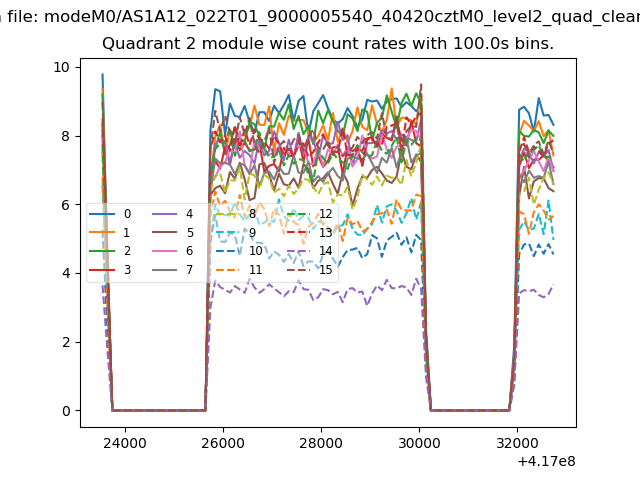 |
 |
| Module-wise count rates for Quadrant D Data is divided into 100 sec bins |
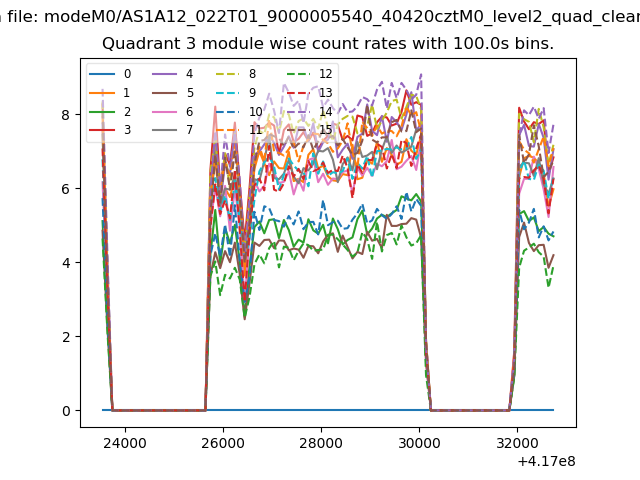 |
 |
| Parameter | Plot |
|---|---|
| CZT HV Monitor | 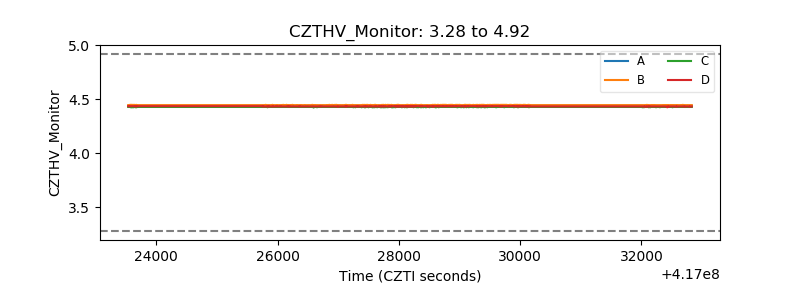 |
| D_VDD | 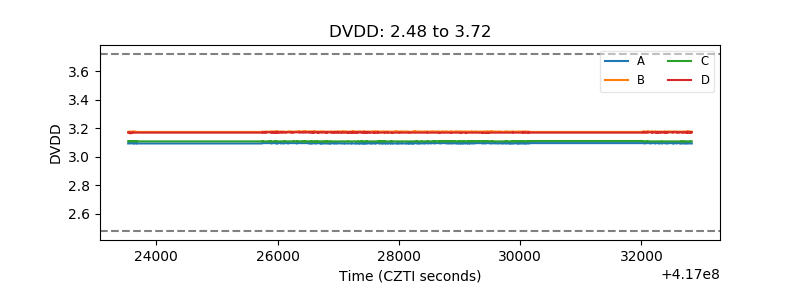 |
| Temperature 1 | 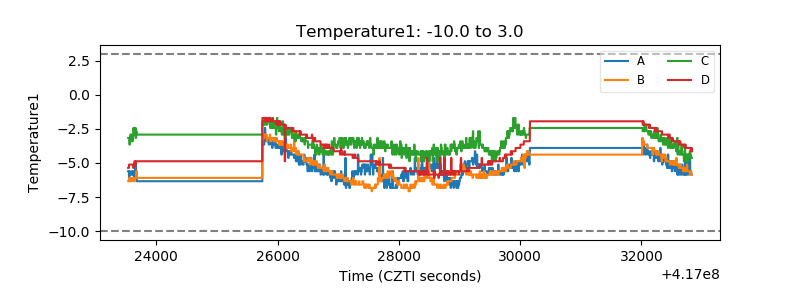 |
| Veto HV Monitor | 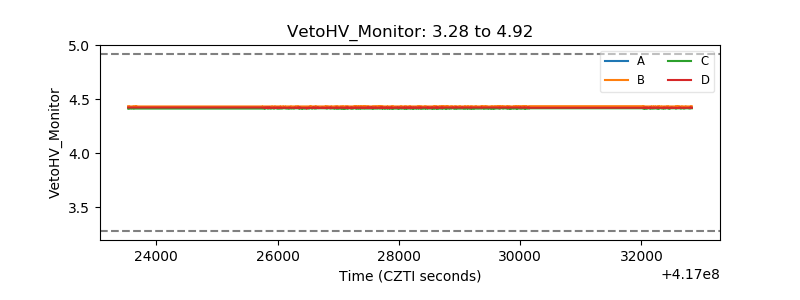 |
| Veto LLD | 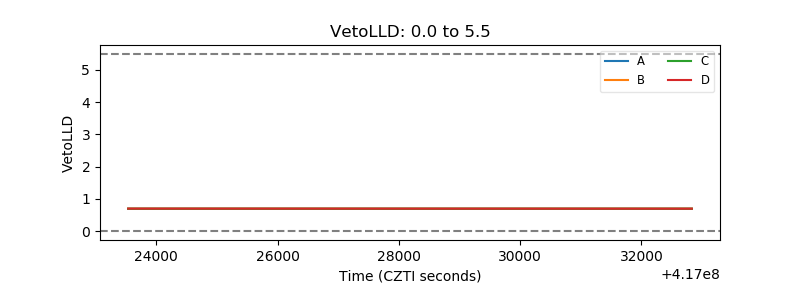 |
| Alpha Counter | 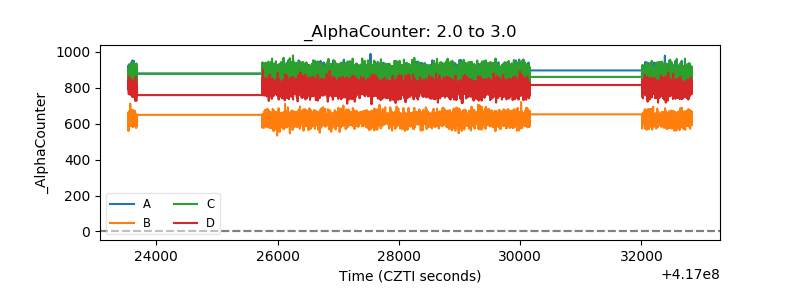 |
| _CPM_Rate |  |
| CZT Counter | 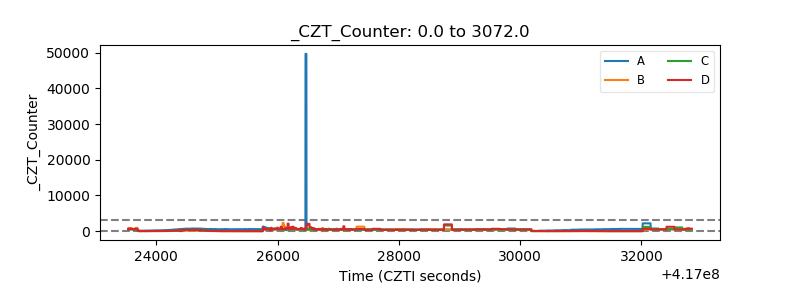 |
| +2.5 Volts monitor | 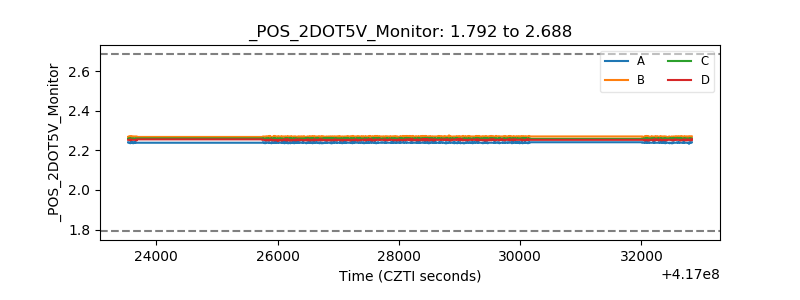 |
| +5 Volts monitor | 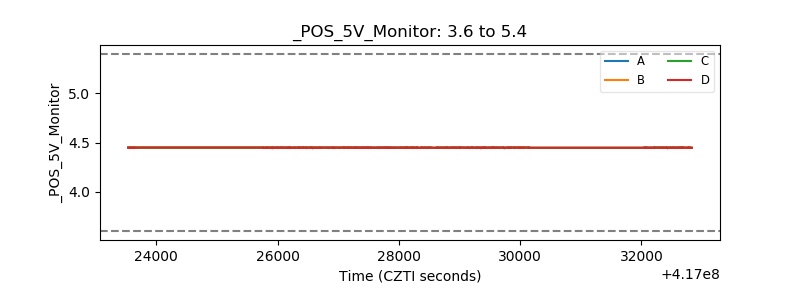 |
| _ROLL_ROT | 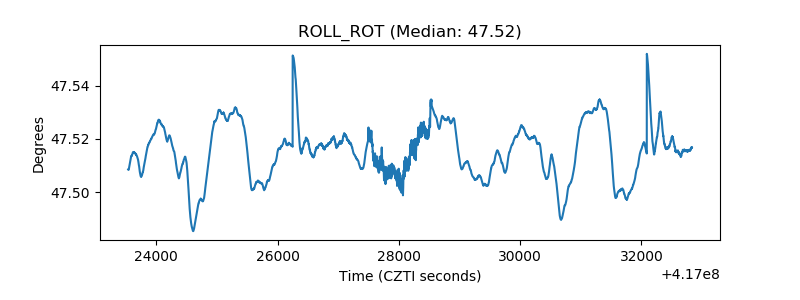 |
| _Roll_DEC |  |
| _Roll_RA | 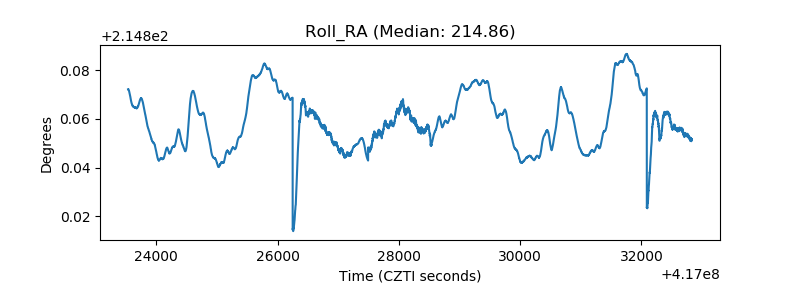 |
| Veto Counter | 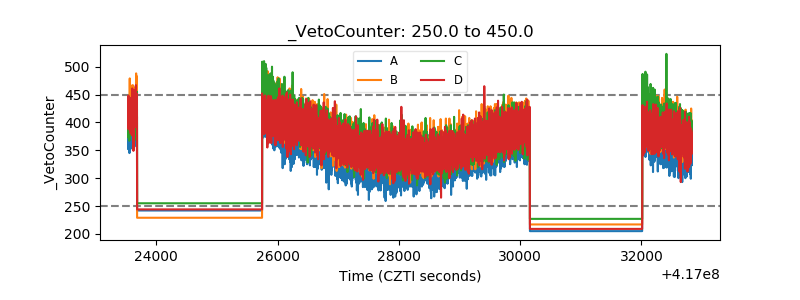 |