| Param | Original file | Final file |
|---|---|---|
| Filename | modeM0/AS1A12_022T01_9000005540_40421cztM0_level2.fits | modeM0/AS1A12_022T01_9000005540_40421cztM0_level2_quad_clean.evt |
| Size (bytes) | 332,634,240 | 93,453,120 |
| Size | 317.2 MB | 89.1 MB |
| Events in quadrant A | 2,898,809 | 634,652 |
| Events in quadrant B | 2,732,503 | 644,981 |
| Events in quadrant C | 2,638,491 | 624,015 |
| Events in quadrant D | 3,599,038 | 527,603 |
| Mode M0 | |||
|---|---|---|---|
| Quadrant | BADHDUFLAG | Total packets | Discarded packets |
| A | 0 | 12296 | 3 |
| B | 0 | 11945 | 2 |
| C | 0 | 11566 | 2 |
| D | 0 | 14651 | 2 |
| Mode M9 | |||
|---|---|---|---|
| Quadrant | BADHDUFLAG | Total packets | Discarded packets |
| A | 0 | 34 | 0 |
| B | 0 | 34 | 0 |
| C | 0 | 34 | 0 |
| D | 0 | 34 | 0 |
| Mode SS | |||
|---|---|---|---|
| Quadrant | BADHDUFLAG | Total packets | Discarded packets |
| A | 0 | 118 | 0 |
| B | 0 | 118 | 0 |
| C | 0 | 118 | 0 |
| D | 0 | 118 | 0 |
| Quadrant | Total seconds | Saturated seconds | Saturation percentage |
|---|---|---|---|
| A | 5695 | 13 | 0.228270% |
| B | 5695 | 22 | 0.386304% |
| C | 5695 | 9 | 0.158033% |
| D | 5695 | 575 | 10.096576% |
Noise dominated data is calculated using 1-second bins in cleaned event files. If a bin has >2000 counts, and if more than 50% of those come from <1% of pixels, then it is considered to be noise-dominated and hence unusable.
| Quadrant | # 1 sec bins | Bins with >0 counts | Bins with >2000 counts | High rate bins dominated by noise | Noise dominated (total time) | Noise dominated (detector-on time) | Marked lightcurve |
|---|---|---|---|---|---|---|---|
| A | 9069 | 5697 | 9 | 9 | 0.10% | 0.16% | 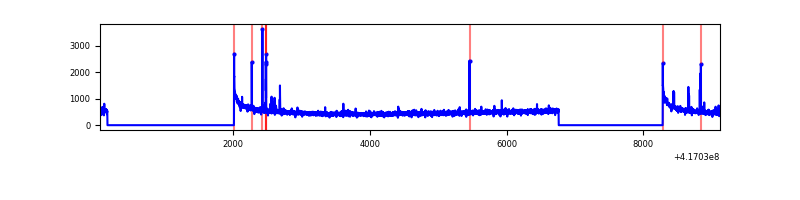 |
| B | 9069 | 5697 | 8 | 8 | 0.09% | 0.14% | 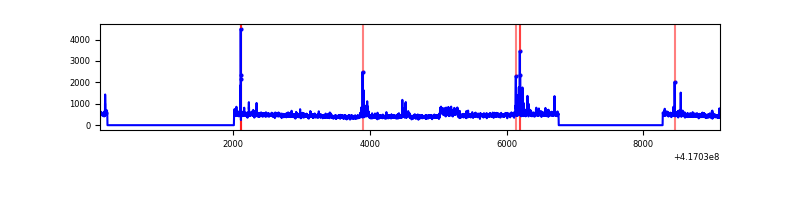 |
| C | 9069 | 5697 | 4 | 4 | 0.04% | 0.07% | 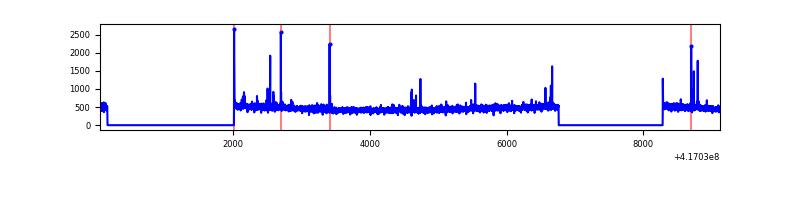 |
| D | 9069 | 5697 | 124 | 124 | 1.37% | 2.18% | 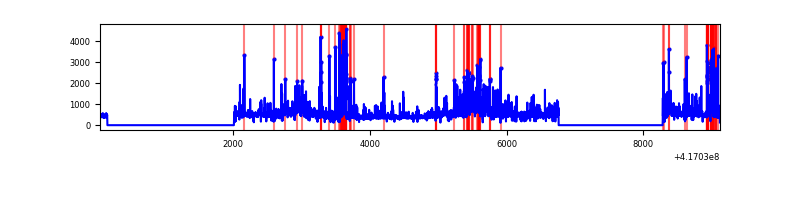 |
Top three noisy pixels from each quadrant. If the there are fewer than three noisy pixels in the level2.evt file, extra rows are filled as -1
| Pixel properties | Quadrant properties | ||||||
|---|---|---|---|---|---|---|---|
| Quadrant | DetID | PixID | Counts | Sigma | Mean | Median | Sigma |
| A | 10 | 83 | 487155 | 3946.93 | 608 | 596 | 123.3 |
| A | 13 | 248 | 37520 | 299.52 | 608 | 596 | 123.3 |
| A | 2 | 79 | 19568 | 153.9 | 608 | 596 | 123.3 |
| B | 7 | 202 | 148980 | 1273.12 | 606 | 588 | 116.6 |
| B | 4 | 170 | 117927 | 1006.7 | 606 | 588 | 116.6 |
| B | 5 | 255 | 39755 | 336.03 | 606 | 588 | 116.6 |
| C | 15 | 214 | 244666 | 1760.57 | 599 | 602 | 138.6 |
| C | 14 | 254 | 42568 | 302.72 | 599 | 602 | 138.6 |
| C | 0 | 10 | 8547 | 57.31 | 599 | 602 | 138.6 |
| D | 2 | 250 | 452752 | 3201.35 | 568 | 550 | 141.3 |
| D | 12 | 227 | 363647 | 2570.54 | 568 | 550 | 141.3 |
| D | 8 | 144 | 264408 | 1867.98 | 568 | 550 | 141.3 |
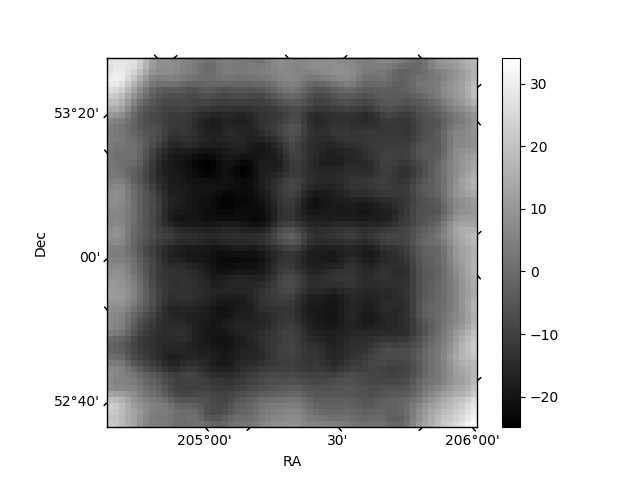
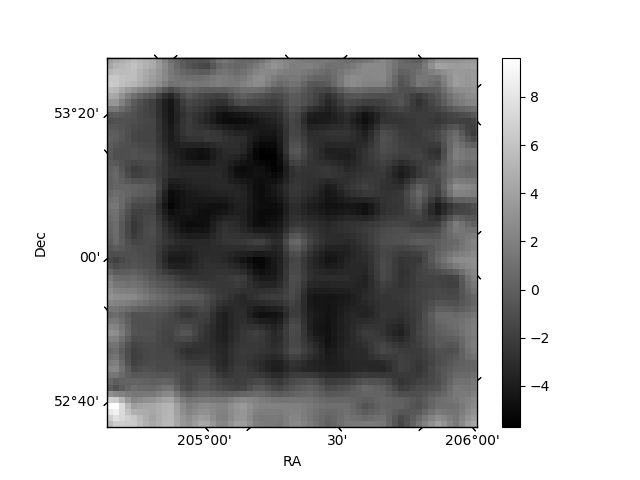
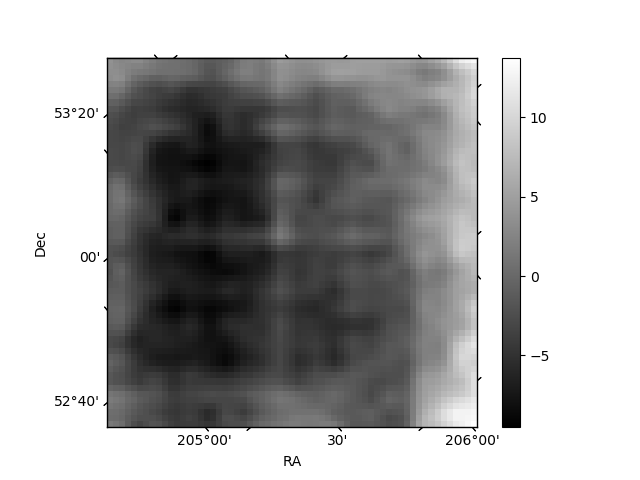
Histogram calculated using DETX and DETY for each event in the final _common_clean file
| Quadrant A | 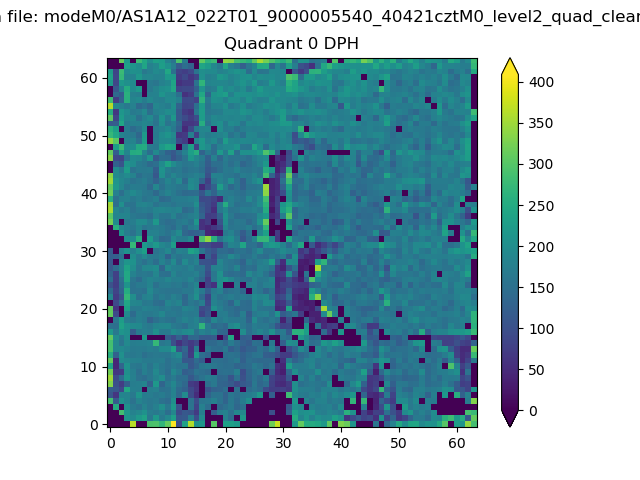 |
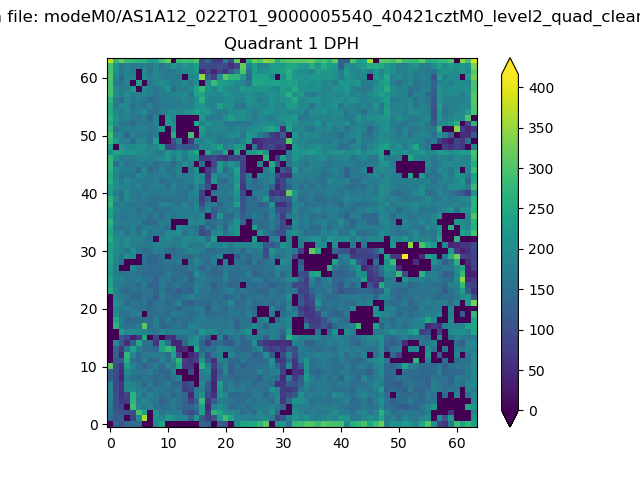 |
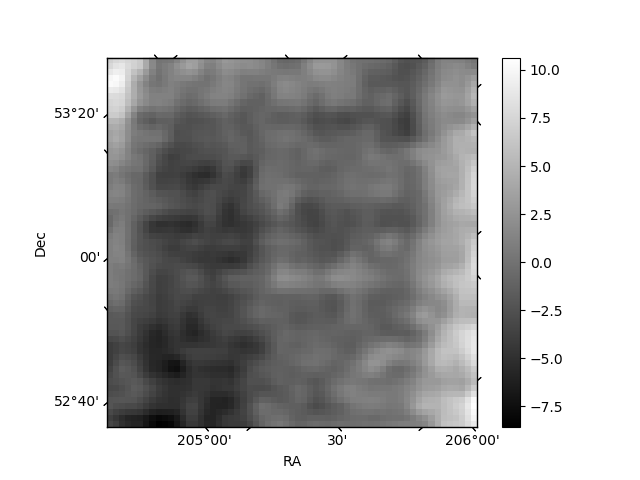
Quadrant B |
|---|---|---|---|
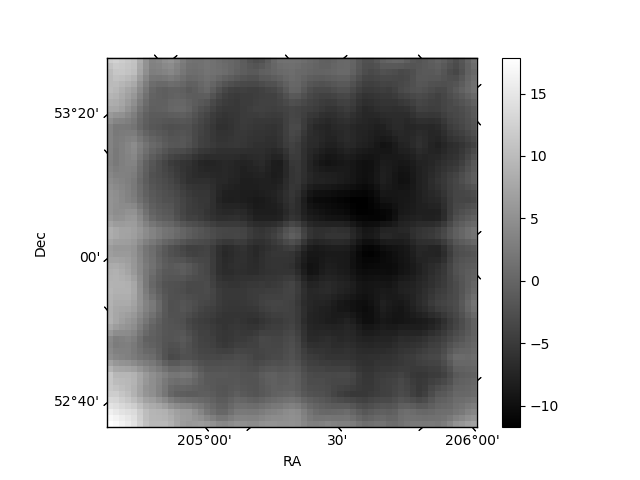
| Quadrant D | 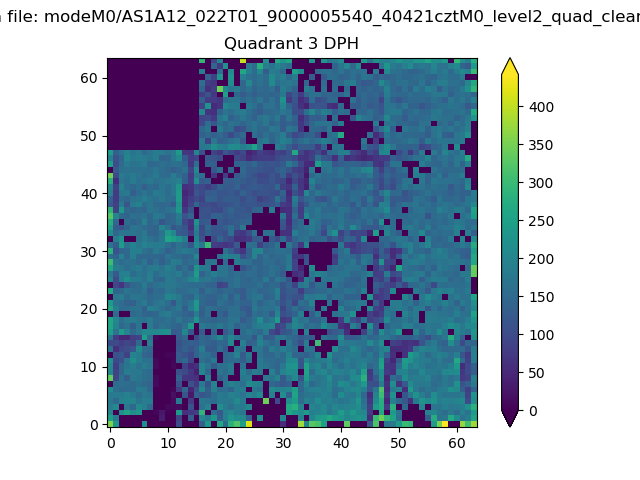 |
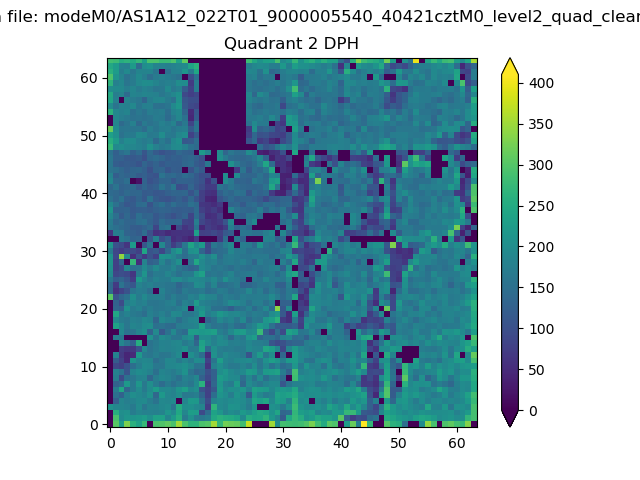 |
Quadrant C |
| Plot type | Count rate plots | Images |
|---|---|---|
| Comparison with Poisson distribution Blue bars denote a histogram of data divided into 1 sec bins. Red curve is a Poisson curve with rate = median count rate of data. |
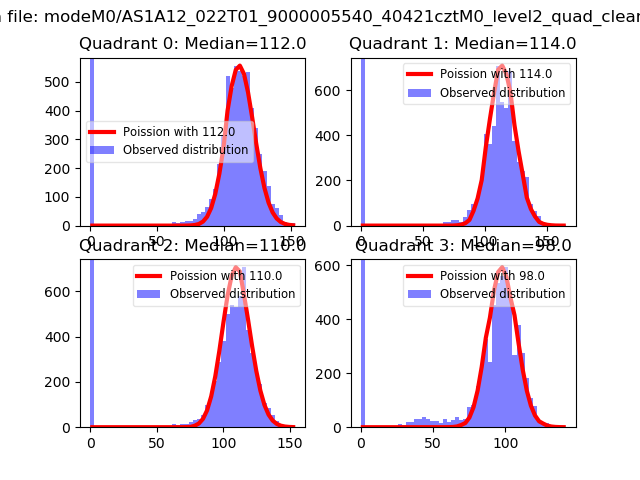 |
 |
| Quadrant-wise count rates Data is divided into 100 sec bins |
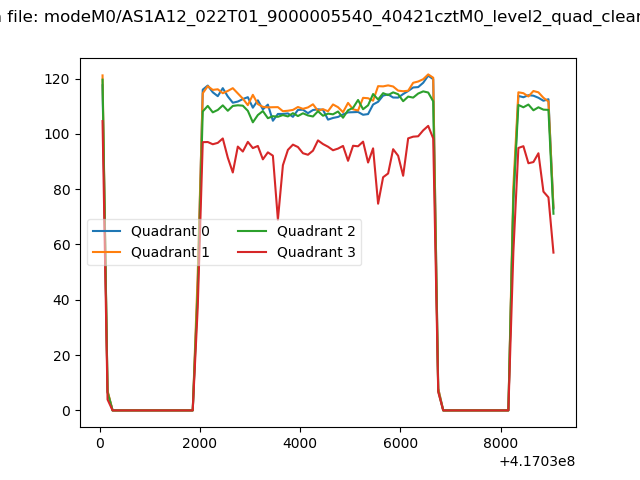 |
|
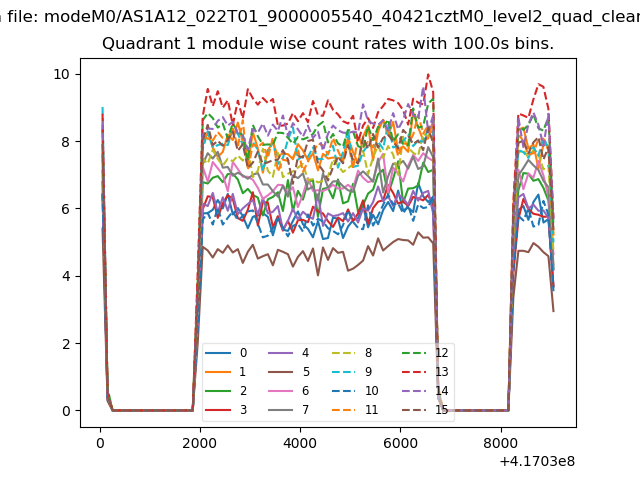
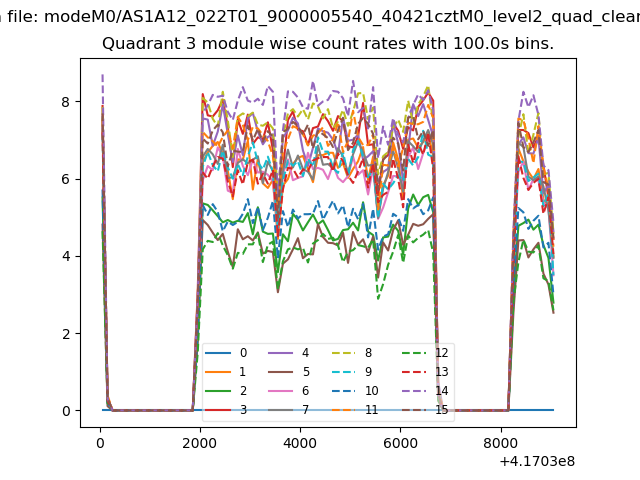
| Module-wise count rates for Quadrant A Data is divided into 100 sec bins |
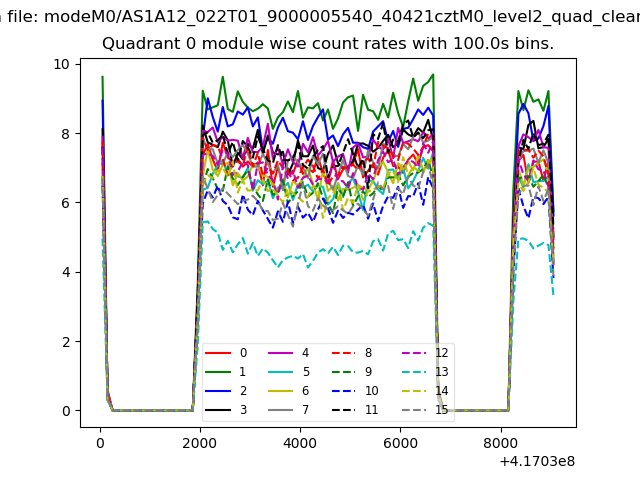 |
 |
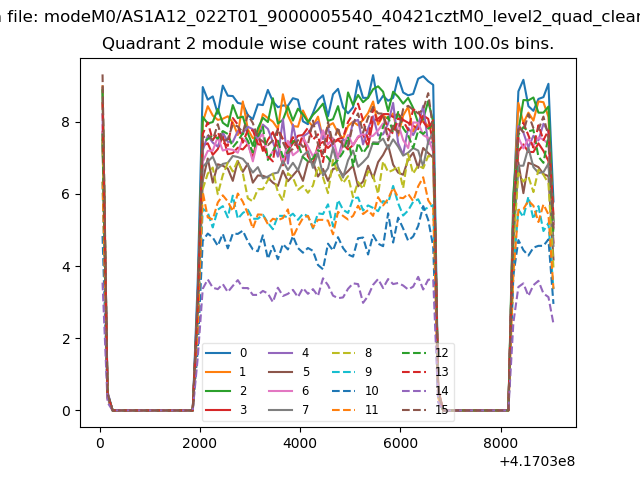
| Module-wise count rates for Quadrant B Data is divided into 100 sec bins |
 |
 |
| Module-wise count rates for Quadrant C Data is divided into 100 sec bins |
 |
 |
| Module-wise count rates for Quadrant D Data is divided into 100 sec bins |
 |
 |
| Parameter | Plot |
|---|---|
| CZT HV Monitor | 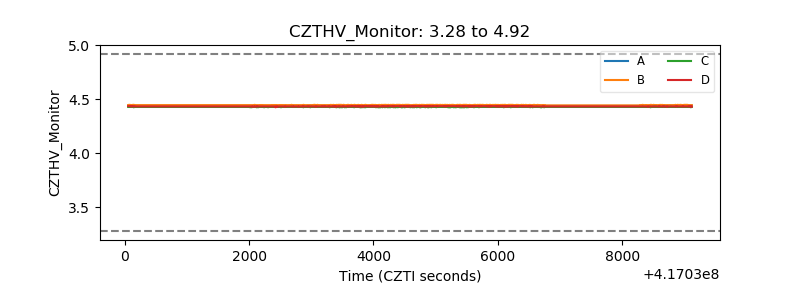 |
| D_VDD | 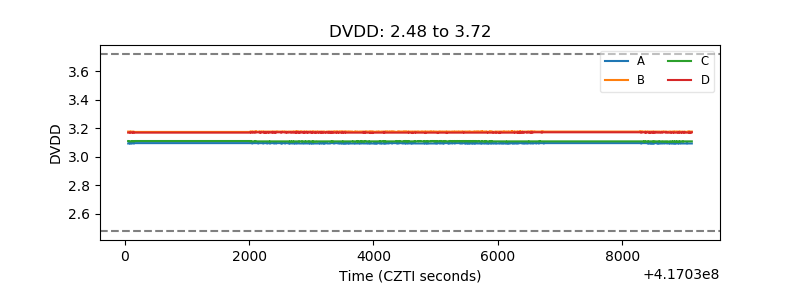 |
| Temperature 1 | 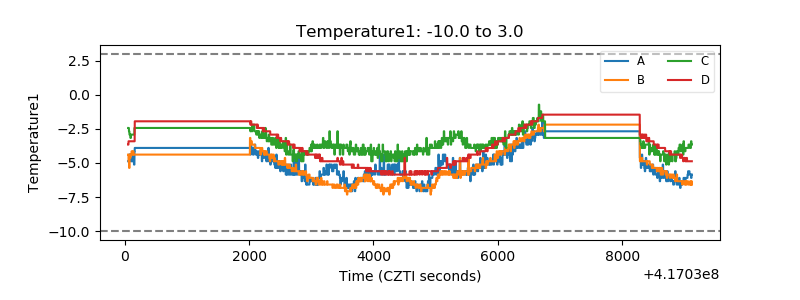 |
| Veto HV Monitor | 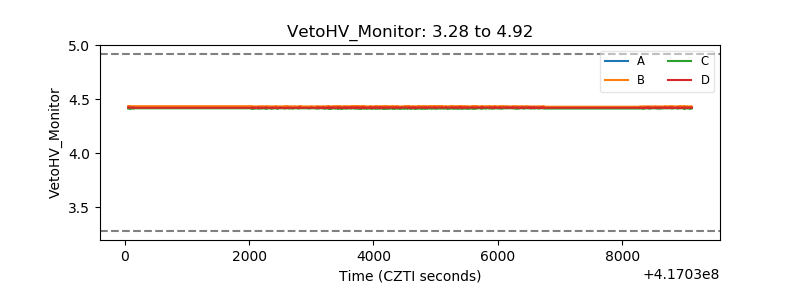 |
| Veto LLD | 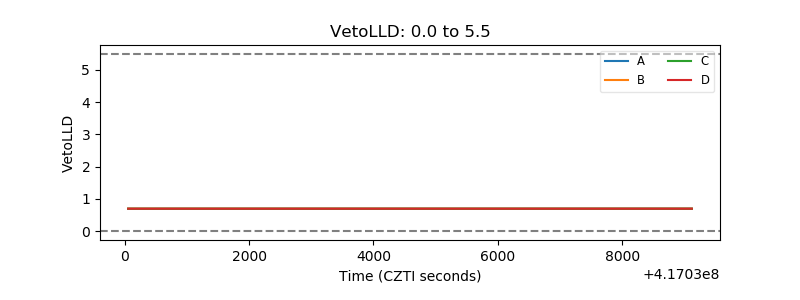 |
| Alpha Counter | 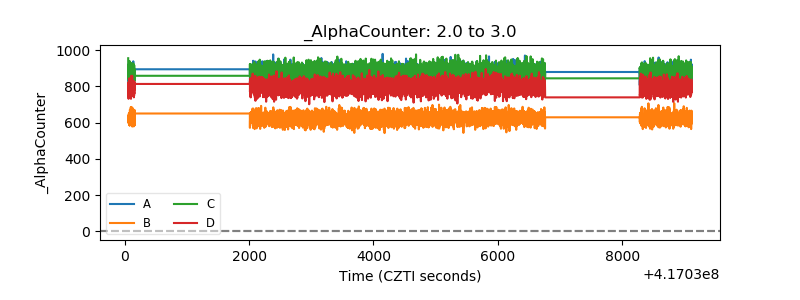 |
| _CPM_Rate | 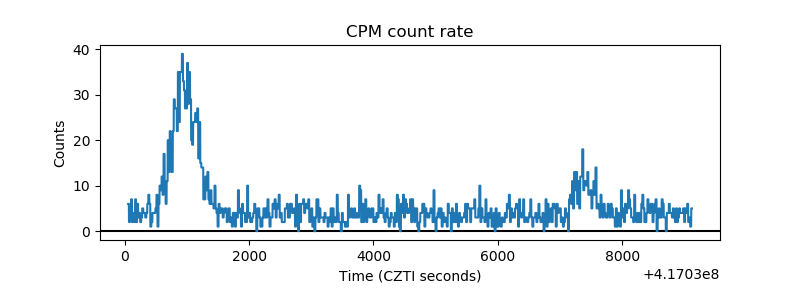 |
| CZT Counter |  |
| +2.5 Volts monitor | 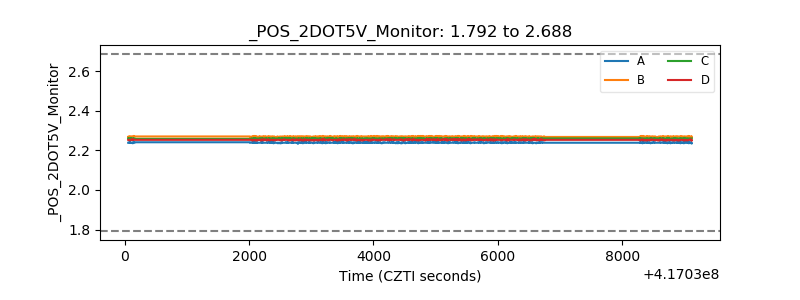 |
| +5 Volts monitor | 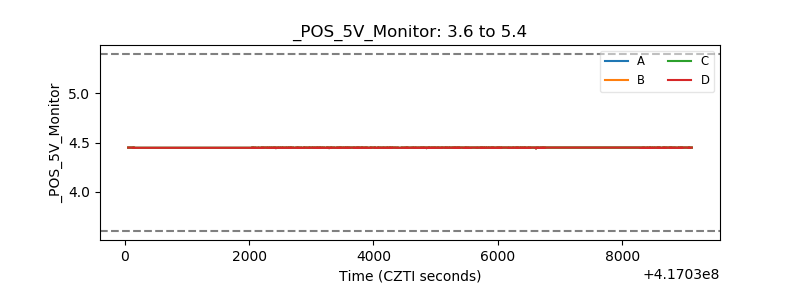 |
| _ROLL_ROT | 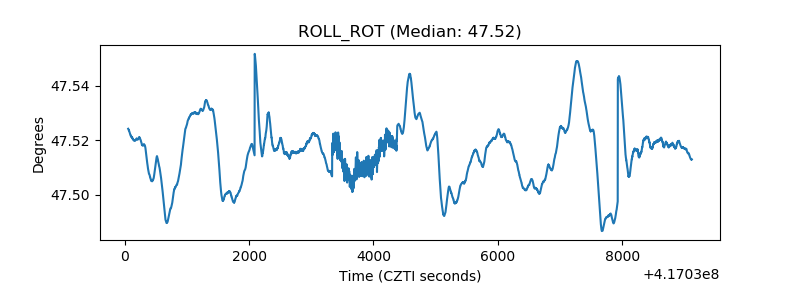 |
| _Roll_DEC | 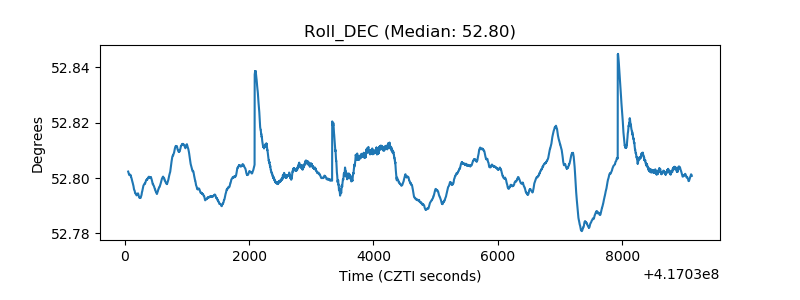 |
| _Roll_RA | 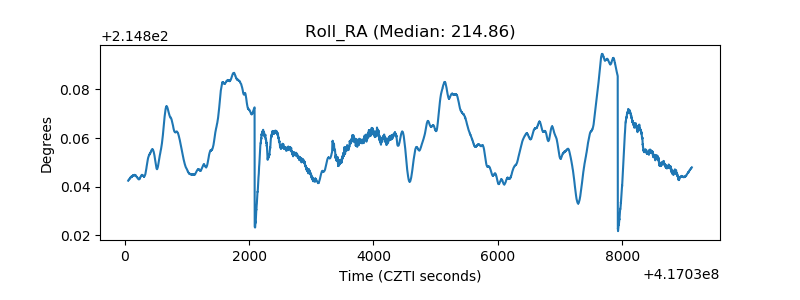 |
| Veto Counter | 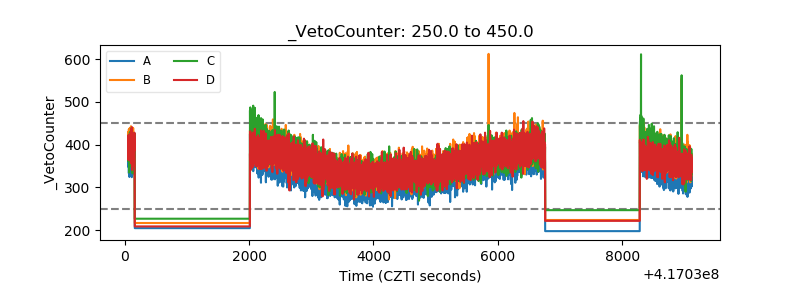 |