| Param | Original file | Final file |
|---|---|---|
| Filename | modeM0/AS1A12_022T01_9000005540_40422cztM0_level2.fits | modeM0/AS1A12_022T01_9000005540_40422cztM0_level2_quad_clean.evt |
| Size (bytes) | 327,695,040 | 92,494,080 |
| Size | 312.5 MB | 88.2 MB |
| Events in quadrant A | 2,981,819 | 624,461 |
| Events in quadrant B | 2,626,770 | 639,010 |
| Events in quadrant C | 2,606,312 | 617,603 |
| Events in quadrant D | 3,469,489 | 520,024 |
| Mode M0 | |||
|---|---|---|---|
| Quadrant | BADHDUFLAG | Total packets | Discarded packets |
| A | 0 | 12611 | 3 |
| B | 0 | 11845 | 2 |
| C | 0 | 11545 | 2 |
| D | 0 | 14401 | 2 |
| Mode M9 | |||
|---|---|---|---|
| Quadrant | BADHDUFLAG | Total packets | Discarded packets |
| A | 0 | 21 | 0 |
| B | 0 | 21 | 0 |
| C | 0 | 21 | 0 |
| D | 0 | 22 | 0 |
| Mode SS | |||
|---|---|---|---|
| Quadrant | BADHDUFLAG | Total packets | Discarded packets |
| A | 0 | 116 | 0 |
| B | 0 | 116 | 0 |
| C | 0 | 116 | 0 |
| D | 0 | 116 | 0 |
| Quadrant | Total seconds | Saturated seconds | Saturation percentage |
|---|---|---|---|
| A | 5715 | 14 | 0.244969% |
| B | 5715 | 12 | 0.209974% |
| C | 5715 | 7 | 0.122485% |
| D | 5715 | 623 | 10.901137% |
Noise dominated data is calculated using 1-second bins in cleaned event files. If a bin has >2000 counts, and if more than 50% of those come from <1% of pixels, then it is considered to be noise-dominated and hence unusable.
| Quadrant | # 1 sec bins | Bins with >0 counts | Bins with >2000 counts | High rate bins dominated by noise | Noise dominated (total time) | Noise dominated (detector-on time) | Marked lightcurve |
|---|---|---|---|---|---|---|---|
| A | 7057 | 5716 | 5 | 5 | 0.07% | 0.09% | 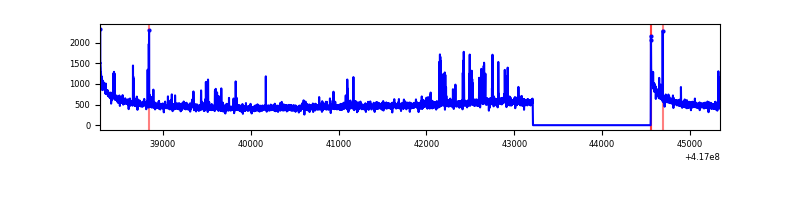 |
| B | 7057 | 5716 | 3 | 3 | 0.04% | 0.05% | 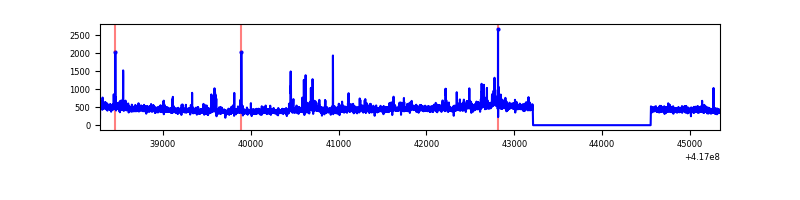 |
| C | 7057 | 5716 | 2 | 2 | 0.03% | 0.03% | 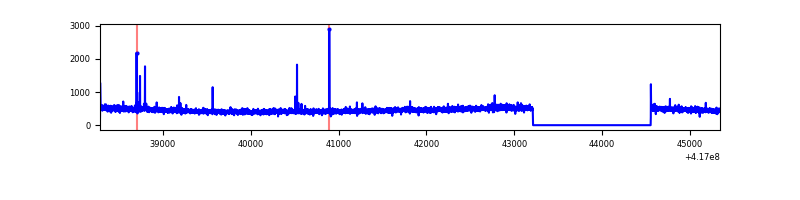 |
| D | 7057 | 5716 | 135 | 135 | 1.91% | 2.36% | 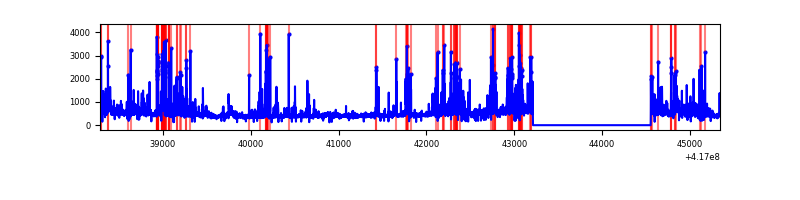 |
Top three noisy pixels from each quadrant. If the there are fewer than three noisy pixels in the level2.evt file, extra rows are filled as -1
| Pixel properties | Quadrant properties | ||||||
|---|---|---|---|---|---|---|---|
| Quadrant | DetID | PixID | Counts | Sigma | Mean | Median | Sigma |
| A | 10 | 83 | 485646 | 3934.81 | 607 | 595 | 123.3 |
| A | 2 | 79 | 119260 | 962.63 | 607 | 595 | 123.3 |
| A | 13 | 248 | 28574 | 226.97 | 607 | 595 | 123.3 |
| B | 4 | 170 | 118566 | 1002.14 | 606 | 591 | 117.7 |
| B | 5 | 255 | 54752 | 460.07 | 606 | 591 | 117.7 |
| B | 0 | 230 | 31821 | 265.28 | 606 | 591 | 117.7 |
| C | 15 | 214 | 248032 | 1783.57 | 596 | 602 | 138.7 |
| C | 14 | 254 | 22908 | 160.79 | 596 | 602 | 138.7 |
| C | 3 | 233 | 7339 | 48.56 | 596 | 602 | 138.7 |
| D | 12 | 227 | 575583 | 4119.99 | 564 | 549 | 139.6 |
| D | 2 | 250 | 220061 | 1572.75 | 564 | 549 | 139.6 |
| D | 9 | 19 | 201564 | 1440.23 | 564 | 549 | 139.6 |
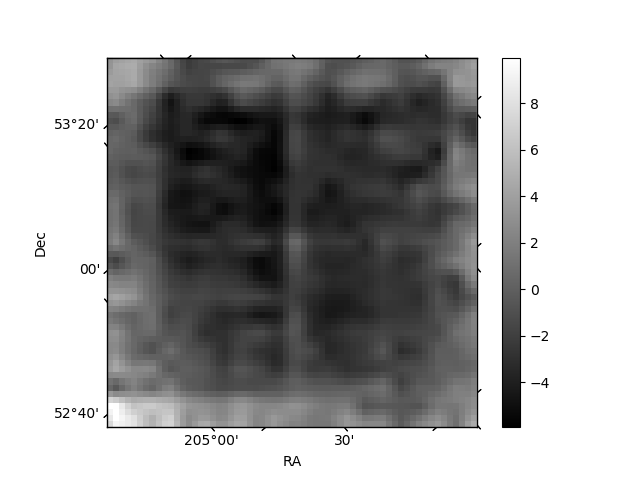
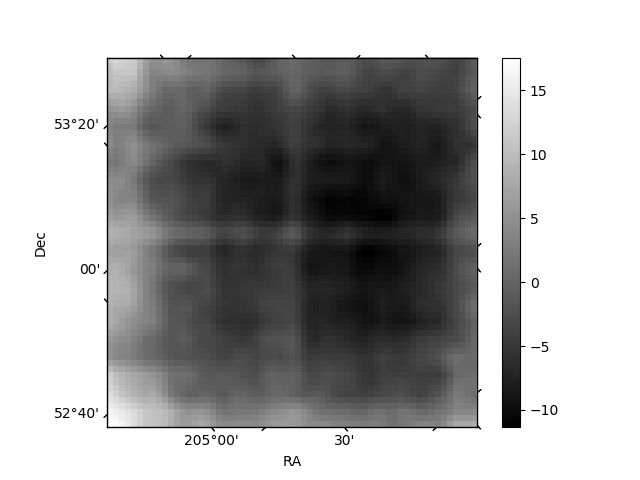
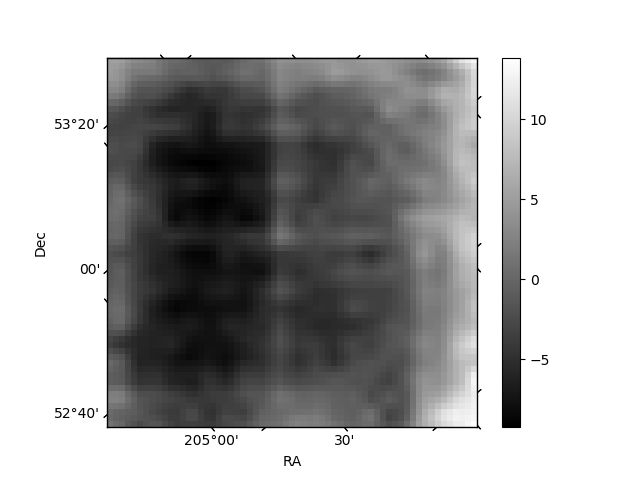
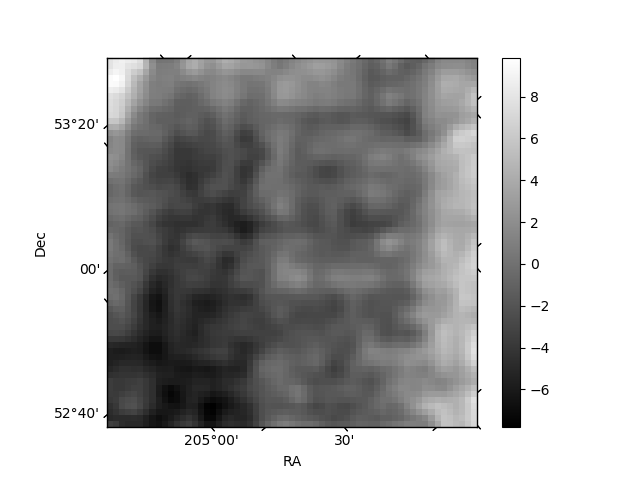
Histogram calculated using DETX and DETY for each event in the final _common_clean file
| Quadrant A | 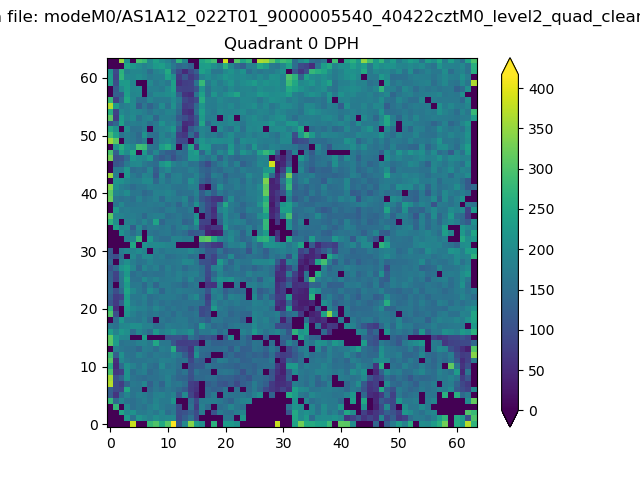 |
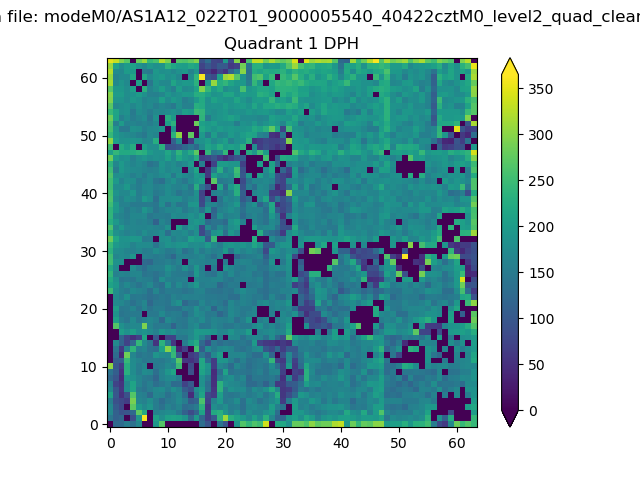 |
Quadrant B |
|---|---|---|---|
| Quadrant D | 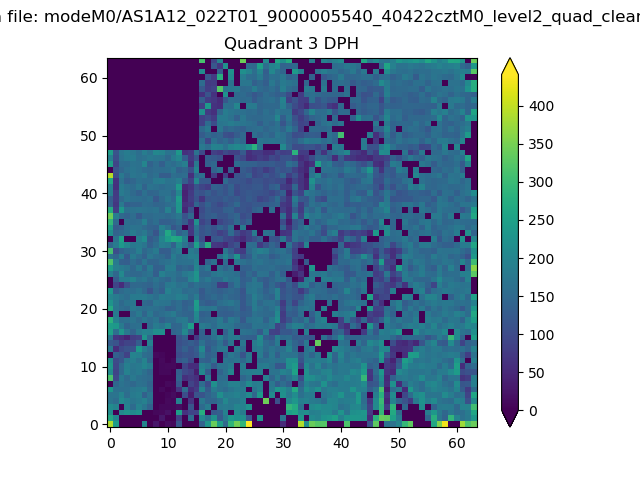 |
 |
Quadrant C |
| Plot type | Count rate plots | Images |
|---|---|---|
| Comparison with Poisson distribution Blue bars denote a histogram of data divided into 1 sec bins. Red curve is a Poisson curve with rate = median count rate of data. |
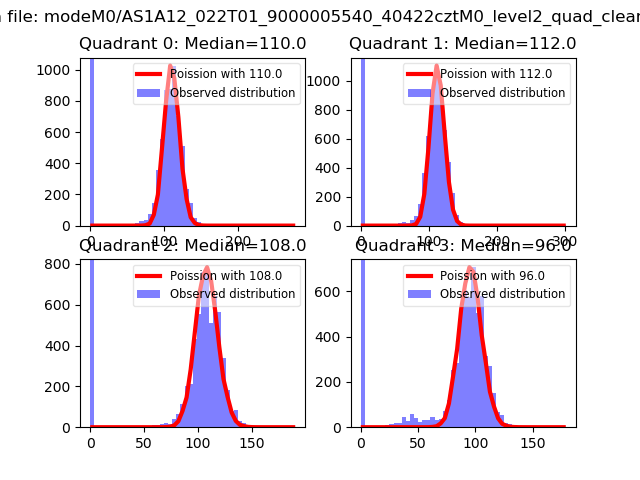 |
 |
| Quadrant-wise count rates Data is divided into 100 sec bins |
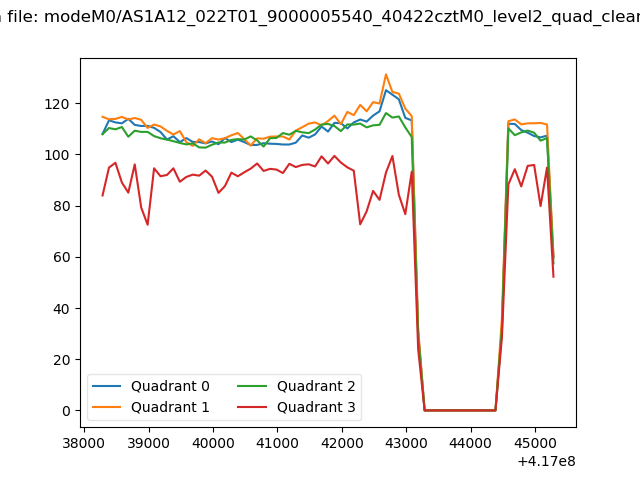 |
|
| Module-wise count rates for Quadrant A Data is divided into 100 sec bins |
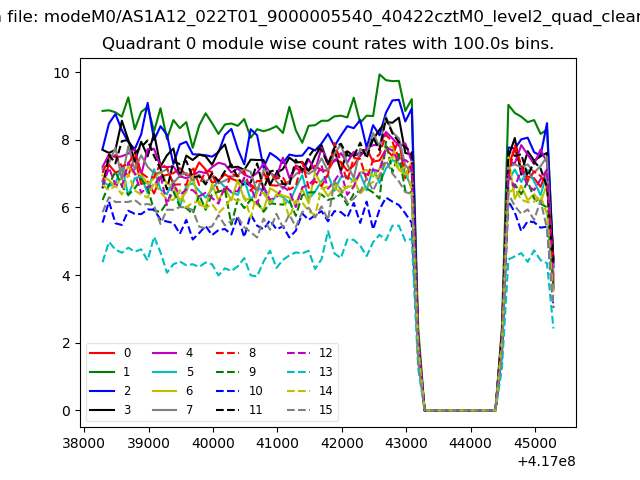 |
 |
| Module-wise count rates for Quadrant B Data is divided into 100 sec bins |
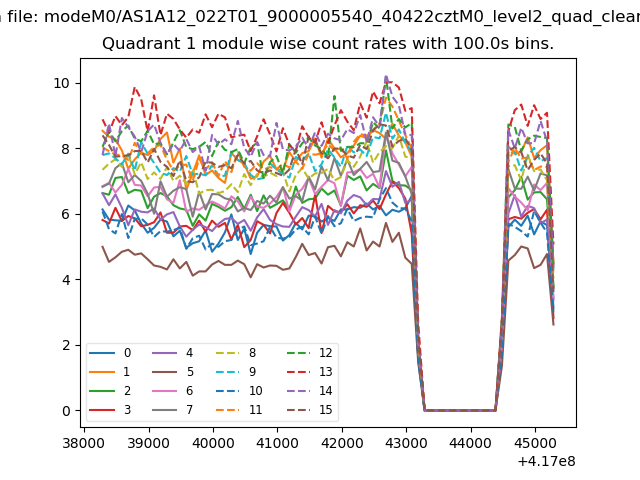 |
 |
| Module-wise count rates for Quadrant C Data is divided into 100 sec bins |
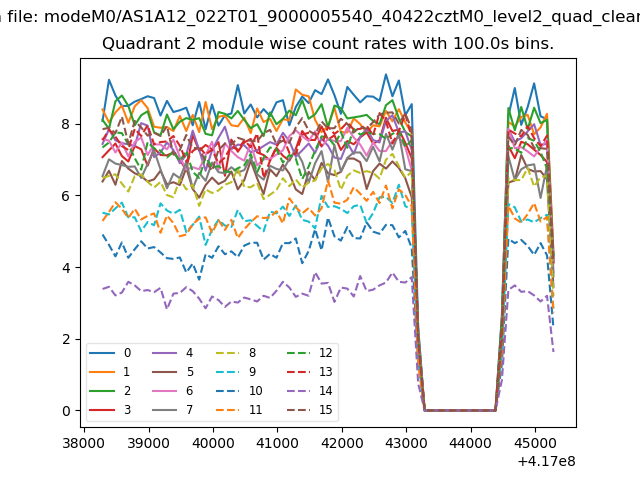 |
 |
| Module-wise count rates for Quadrant D Data is divided into 100 sec bins |
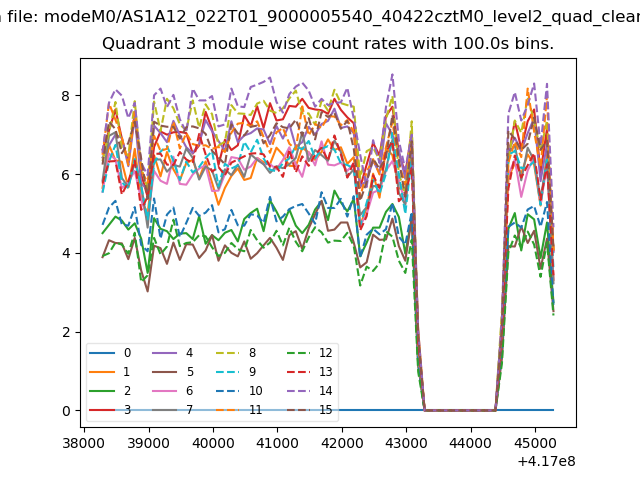 |
 |
| Parameter | Plot |
|---|---|
| CZT HV Monitor | 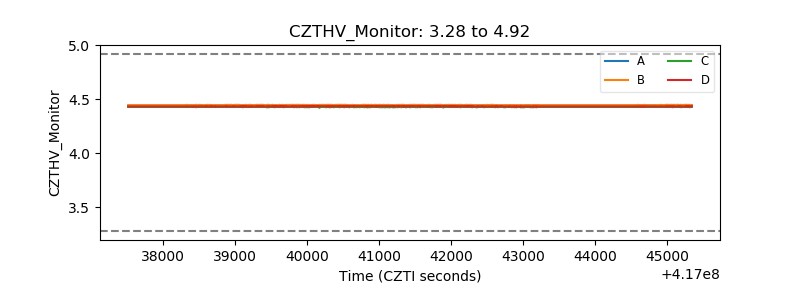 |
| D_VDD | 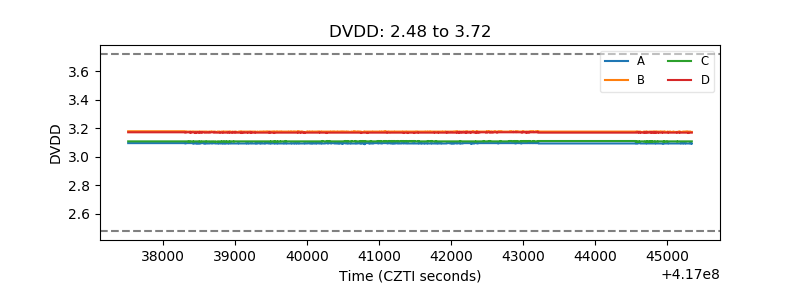 |
| Temperature 1 | 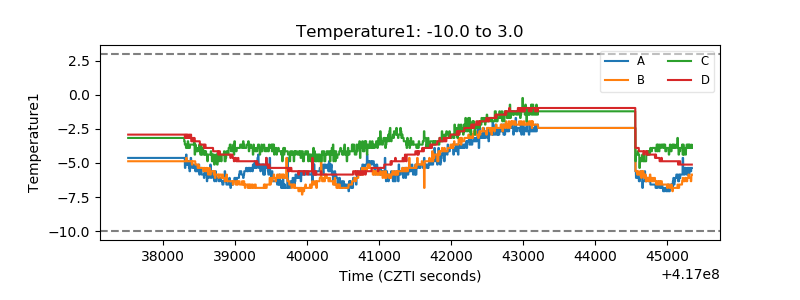 |
| Veto HV Monitor | 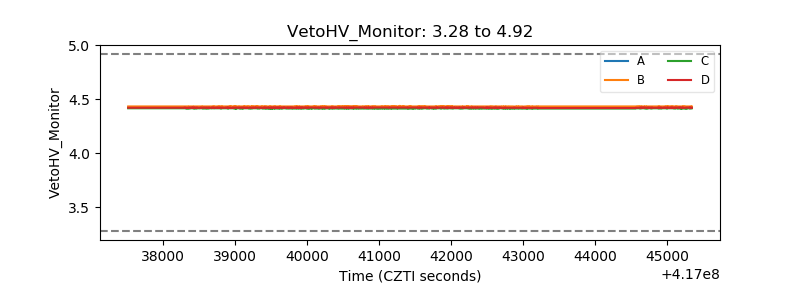 |
| Veto LLD | 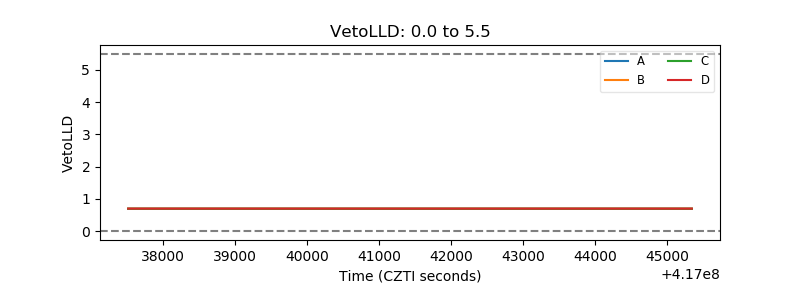 |
| Alpha Counter | 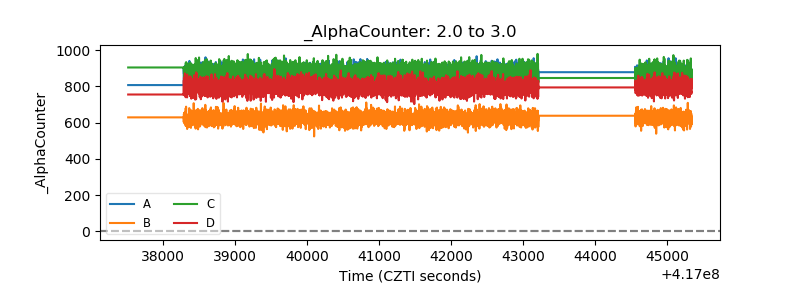 |
| _CPM_Rate | 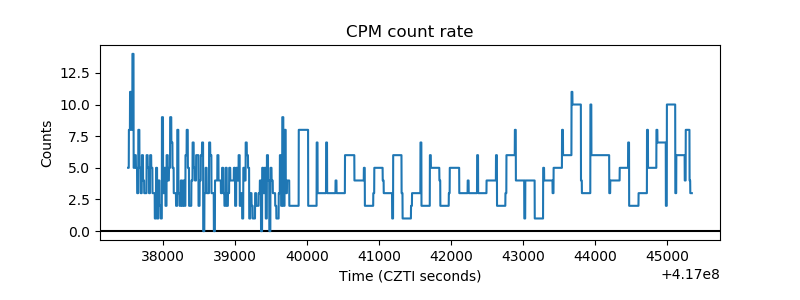 |
| CZT Counter | 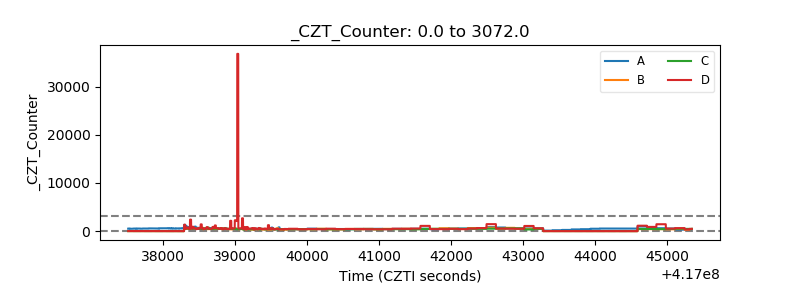 |
| +2.5 Volts monitor | 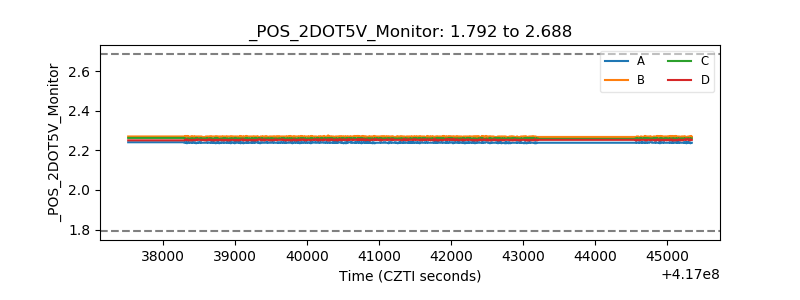 |
| +5 Volts monitor | 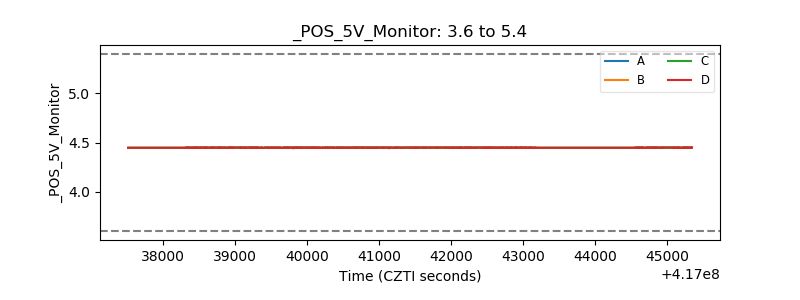 |
| _ROLL_ROT | 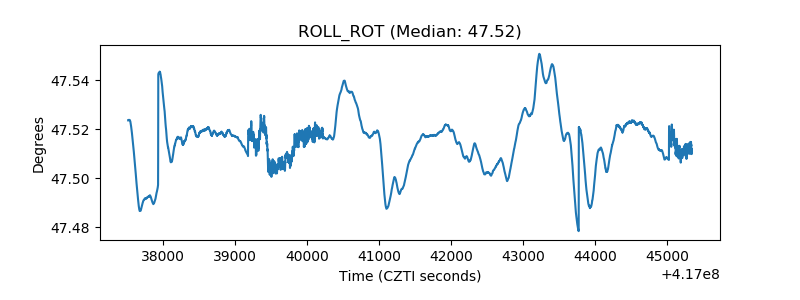 |
| _Roll_DEC |  |
| _Roll_RA | 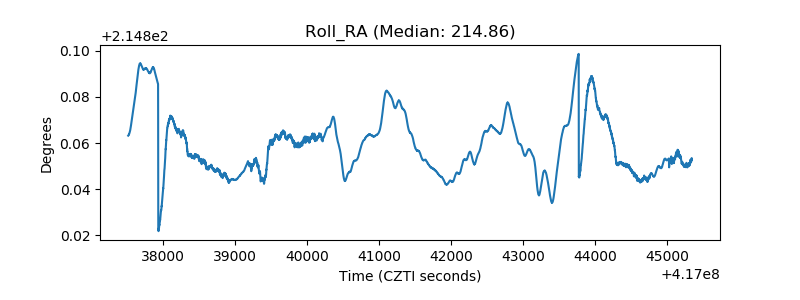 |
| Veto Counter | 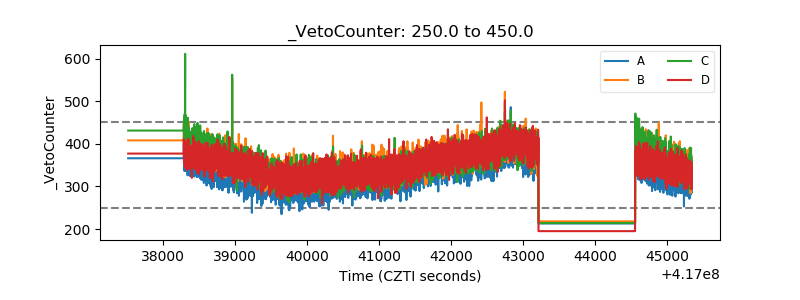 |