| Param | Original file | Final file |
|---|---|---|
| Filename | modeM0/AS1A12_022T01_9000005540_40423cztM0_level2.fits | modeM0/AS1A12_022T01_9000005540_40423cztM0_level2_quad_clean.evt |
| Size (bytes) | 364,363,200 | 106,214,400 |
| Size | 347.5 MB | 101.3 MB |
| Events in quadrant A | 3,466,474 | 719,638 |
| Events in quadrant B | 2,918,749 | 738,791 |
| Events in quadrant C | 3,049,678 | 710,428 |
| Events in quadrant D | 3,538,850 | 587,778 |
| Mode M0 | |||
|---|---|---|---|
| Quadrant | BADHDUFLAG | Total packets | Discarded packets |
| A | 0 | 14508 | 3 |
| B | 0 | 13529 | 2 |
| C | 0 | 13386 | 2 |
| D | 0 | 15189 | 2 |
| Mode M9 | |||
|---|---|---|---|
| Quadrant | BADHDUFLAG | Total packets | Discarded packets |
| A | 0 | 26 | 0 |
| B | 0 | 26 | 0 |
| C | 0 | 26 | 0 |
| D | 0 | 26 | 0 |
| Mode SS | |||
|---|---|---|---|
| Quadrant | BADHDUFLAG | Total packets | Discarded packets |
| A | 0 | 134 | 0 |
| B | 0 | 134 | 0 |
| C | 0 | 134 | 0 |
| D | 0 | 134 | 0 |
| Quadrant | Total seconds | Saturated seconds | Saturation percentage |
|---|---|---|---|
| A | 6585 | 12 | 0.182232% |
| B | 6585 | 14 | 0.212604% |
| C | 6585 | 9 | 0.136674% |
| D | 6585 | 857 | 13.014427% |
Noise dominated data is calculated using 1-second bins in cleaned event files. If a bin has >2000 counts, and if more than 50% of those come from <1% of pixels, then it is considered to be noise-dominated and hence unusable.
| Quadrant | # 1 sec bins | Bins with >0 counts | Bins with >2000 counts | High rate bins dominated by noise | Noise dominated (total time) | Noise dominated (detector-on time) | Marked lightcurve |
|---|---|---|---|---|---|---|---|
| A | 9208 | 6587 | 4 | 4 | 0.04% | 0.06% | 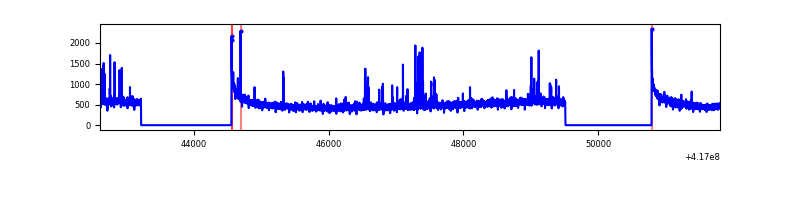 |
| B | 9208 | 6587 | 4 | 4 | 0.04% | 0.06% | 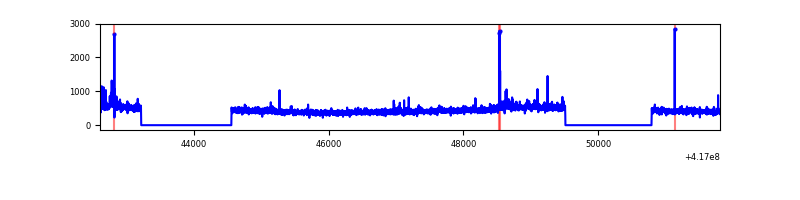 |
| C | 9208 | 6587 | 2 | 2 | 0.02% | 0.03% | 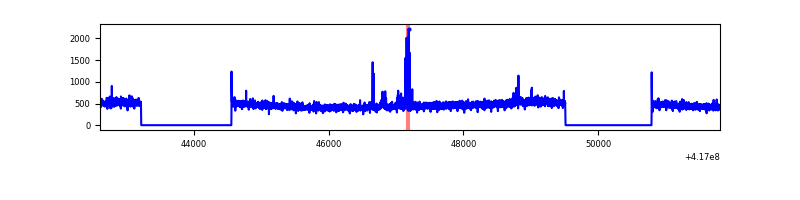 |
| D | 9208 | 6587 | 66 | 66 | 0.72% | 1.00% | 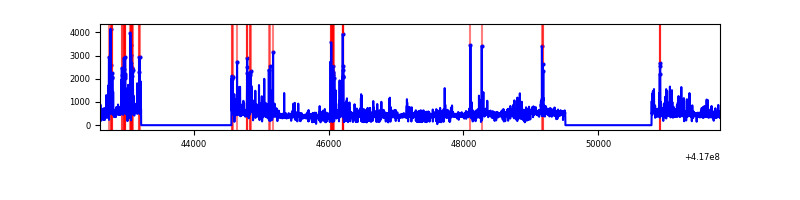 |
Top three noisy pixels from each quadrant. If the there are fewer than three noisy pixels in the level2.evt file, extra rows are filled as -1
| Pixel properties | Quadrant properties | ||||||
|---|---|---|---|---|---|---|---|
| Quadrant | DetID | PixID | Counts | Sigma | Mean | Median | Sigma |
| A | 10 | 83 | 541216 | 3757.62 | 710 | 697 | 143.8 |
| A | 13 | 248 | 75116 | 517.35 | 710 | 697 | 143.8 |
| A | 2 | 79 | 68751 | 473.1 | 710 | 697 | 143.8 |
| B | 4 | 170 | 53980 | 389.94 | 707 | 688 | 136.7 |
| B | 0 | 230 | 41246 | 296.76 | 707 | 688 | 136.7 |
| B | 5 | 255 | 20818 | 147.29 | 707 | 688 | 136.7 |
| C | 15 | 214 | 282482 | 1744.96 | 695 | 701 | 161.5 |
| C | 14 | 254 | 45209 | 275.62 | 695 | 701 | 161.5 |
| C | 3 | 233 | 9354 | 53.58 | 695 | 701 | 161.5 |
| D | 12 | 227 | 334275 | 2091.24 | 647 | 629 | 159.5 |
| D | 2 | 250 | 280649 | 1755.12 | 647 | 629 | 159.5 |
| D | 12 | 191 | 229378 | 1433.76 | 647 | 629 | 159.5 |
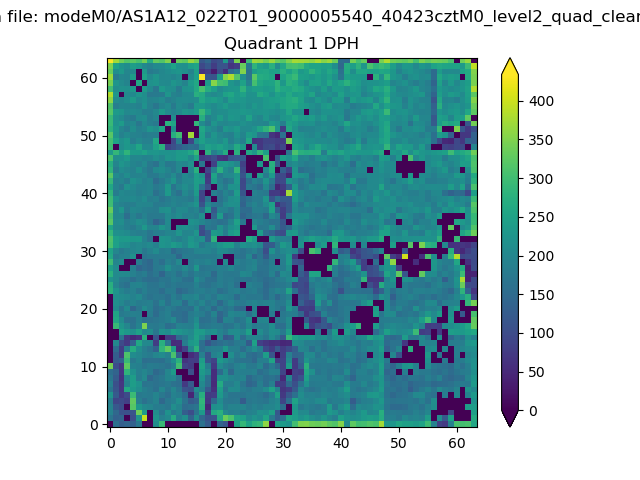
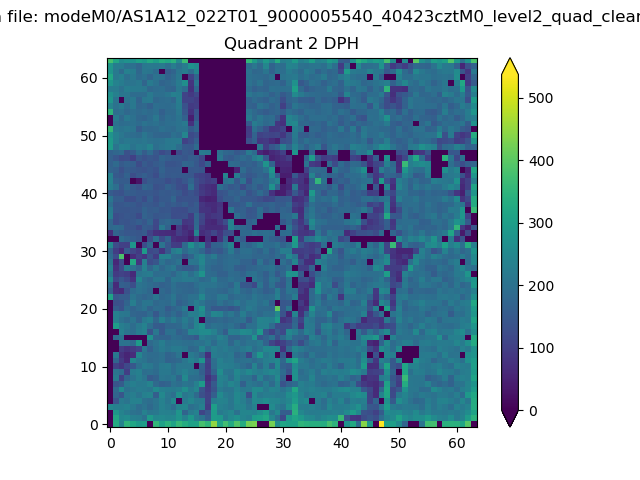
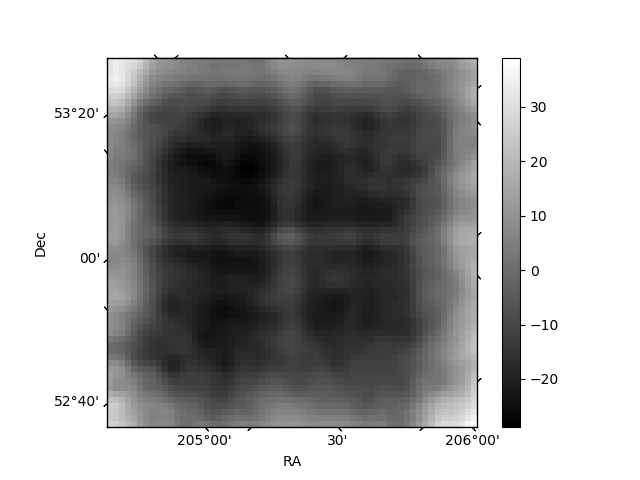
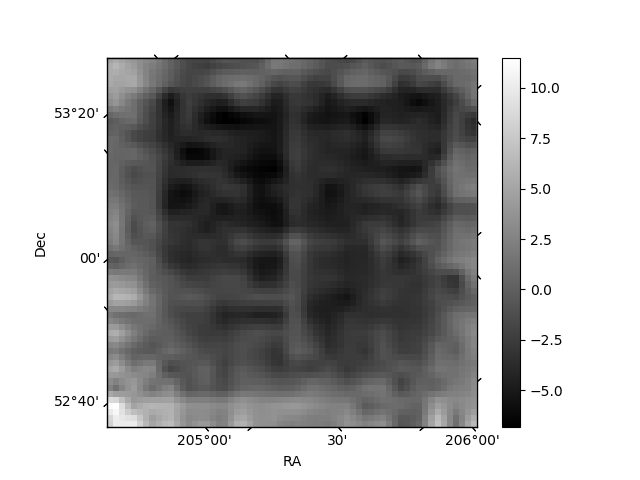
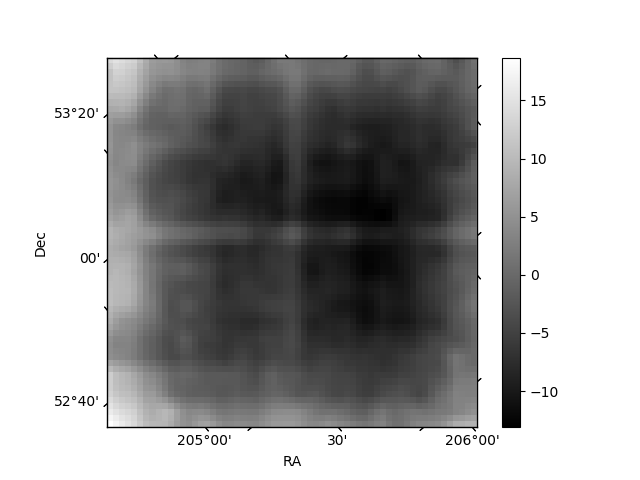
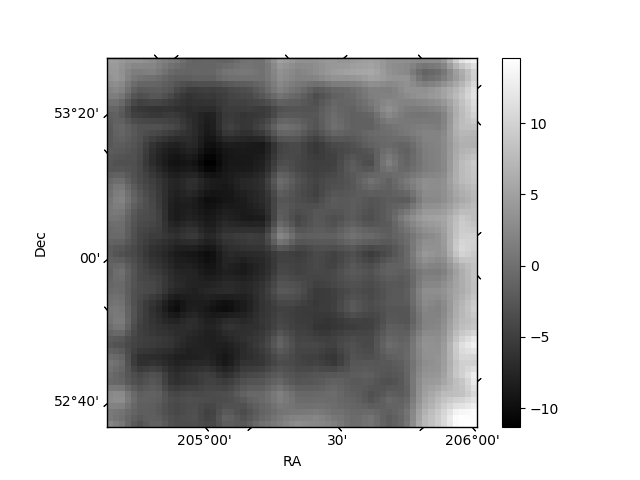
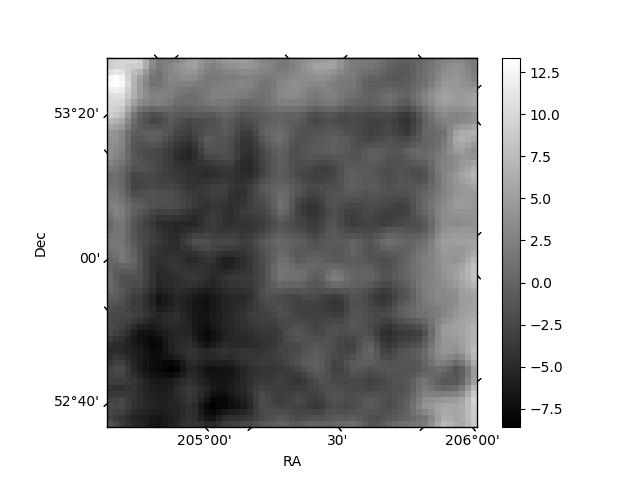
Histogram calculated using DETX and DETY for each event in the final _common_clean file
| Quadrant A |  |
 |
Quadrant B |
|---|---|---|---|
| Quadrant D | 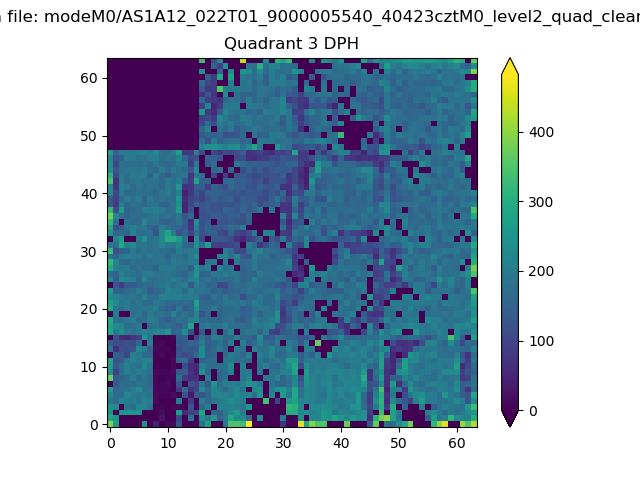 |
 |
Quadrant C |
| Plot type | Count rate plots | Images |
|---|---|---|
| Comparison with Poisson distribution Blue bars denote a histogram of data divided into 1 sec bins. Red curve is a Poisson curve with rate = median count rate of data. |
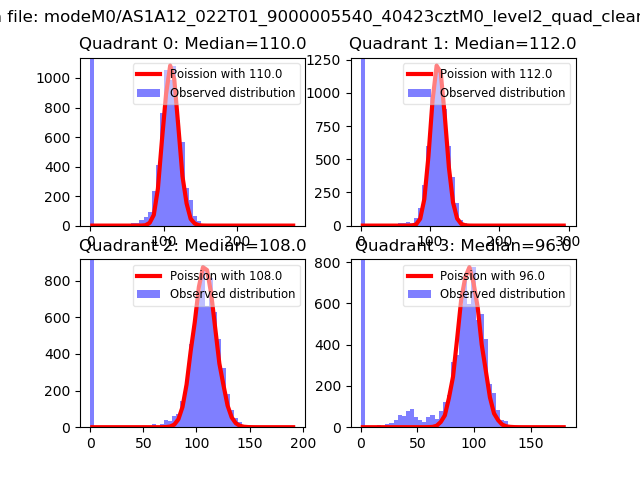 |
 |
| Quadrant-wise count rates Data is divided into 100 sec bins |
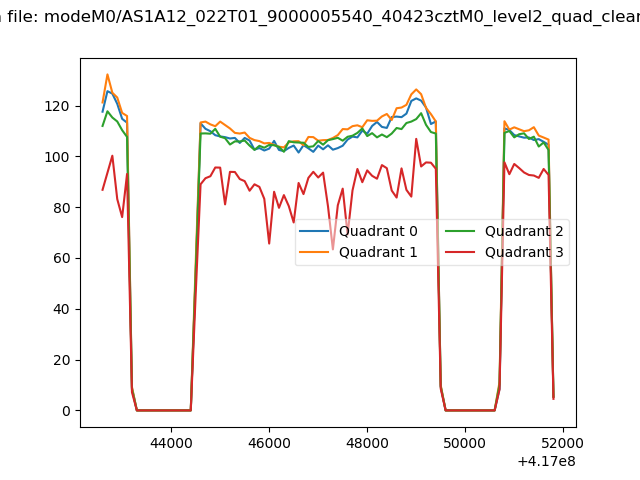 |
|
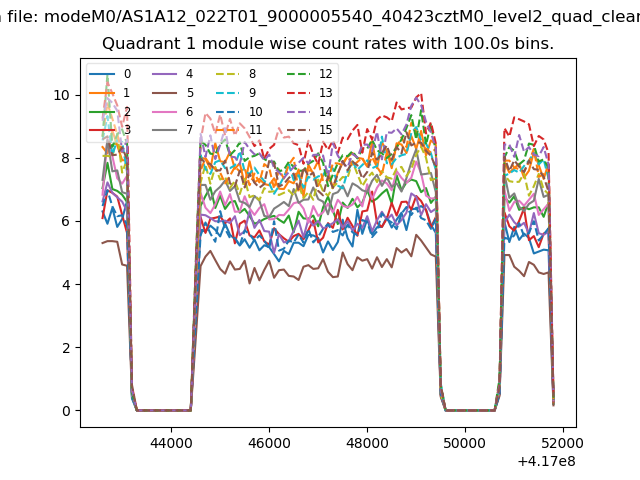
| Module-wise count rates for Quadrant A Data is divided into 100 sec bins |
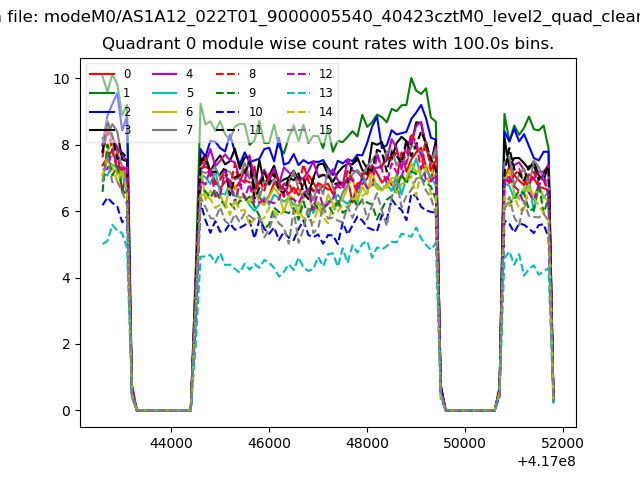 |
 |
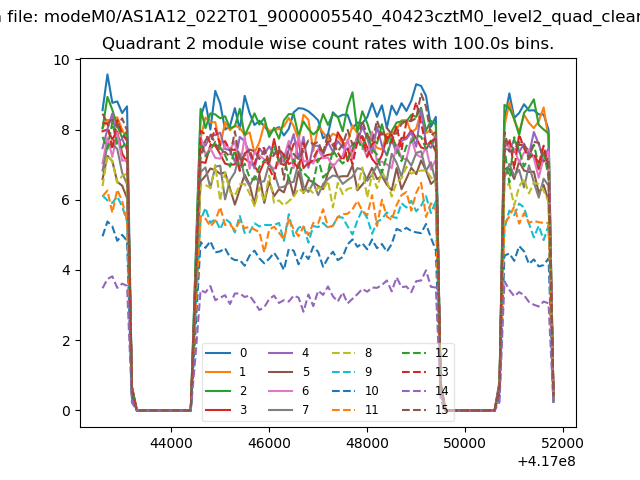
| Module-wise count rates for Quadrant B Data is divided into 100 sec bins |
 |
 |
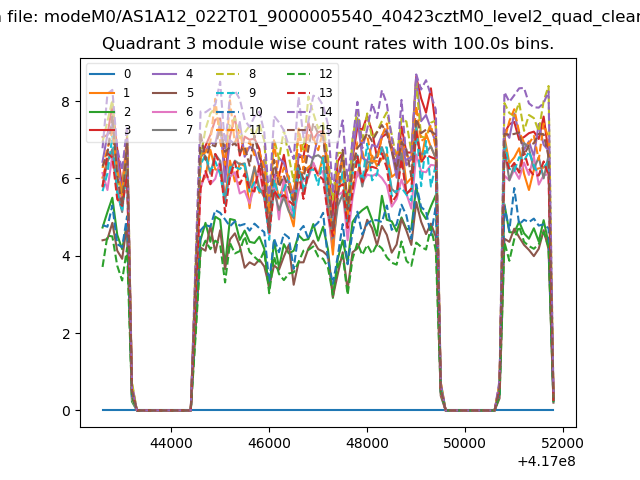
| Module-wise count rates for Quadrant C Data is divided into 100 sec bins |
 |
 |
| Module-wise count rates for Quadrant D Data is divided into 100 sec bins |
 |
 |
| Parameter | Plot |
|---|---|
| CZT HV Monitor |  |
| D_VDD | 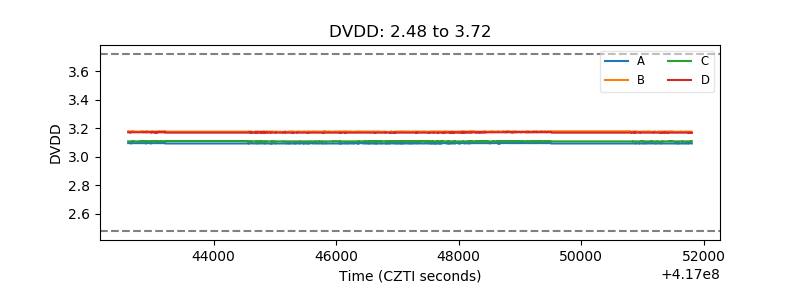 |
| Temperature 1 | 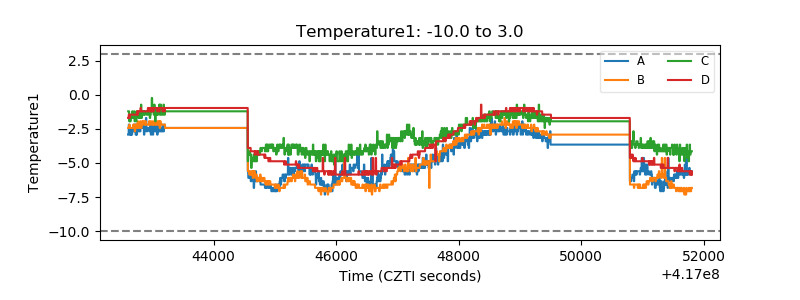 |
| Veto HV Monitor | 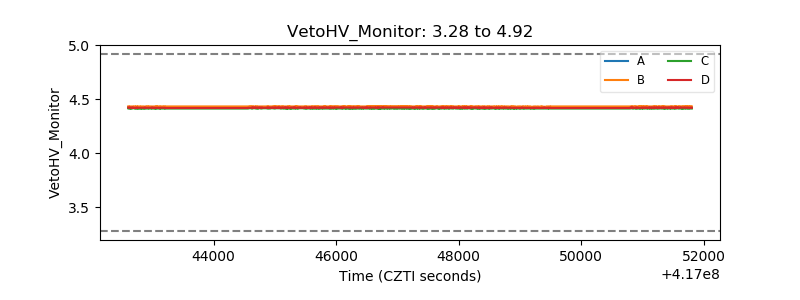 |
| Veto LLD | 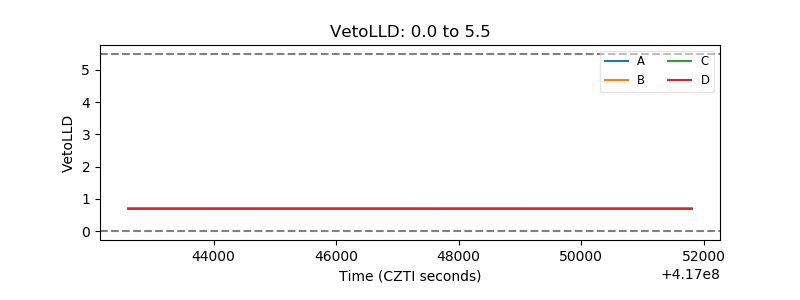 |
| Alpha Counter |  |
| _CPM_Rate | 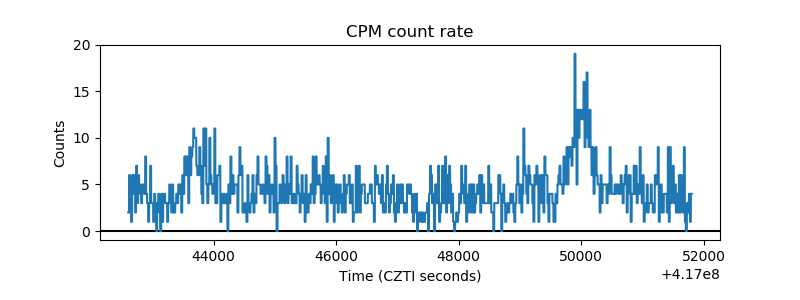 |
| CZT Counter | 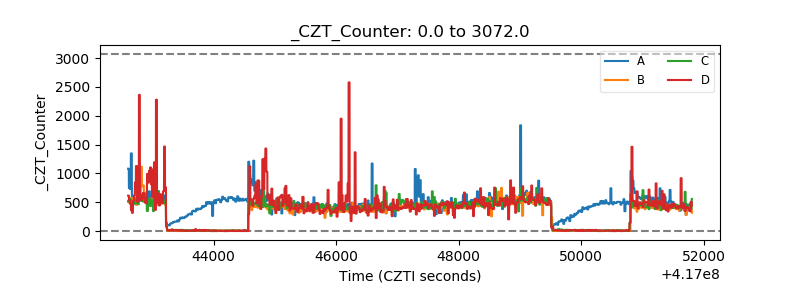 |
| +2.5 Volts monitor | 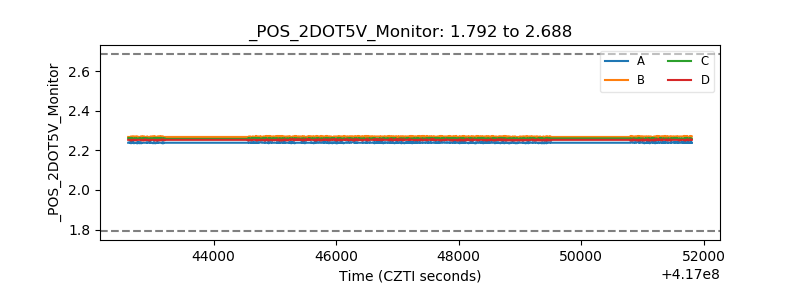 |
| +5 Volts monitor | 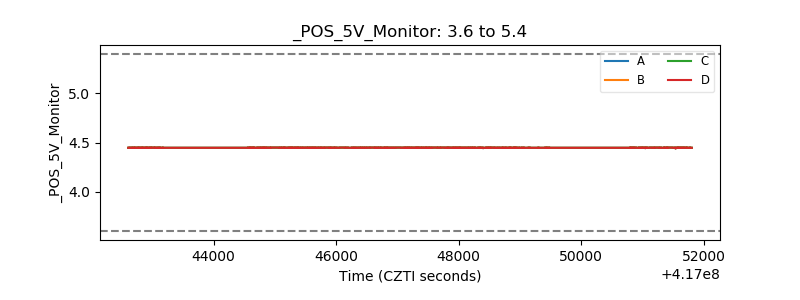 |
| _ROLL_ROT | 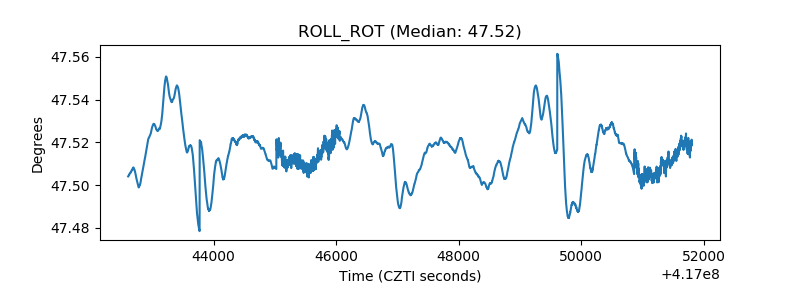 |
| _Roll_DEC | 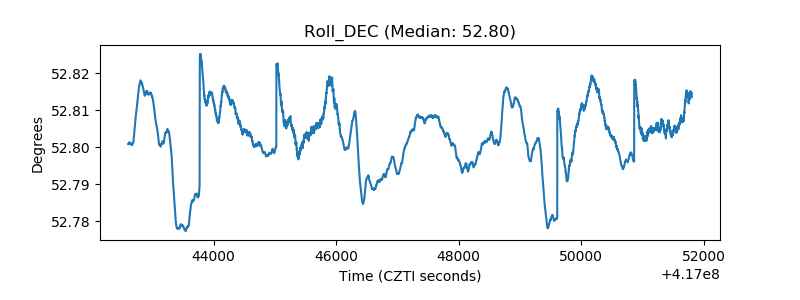 |
| _Roll_RA | 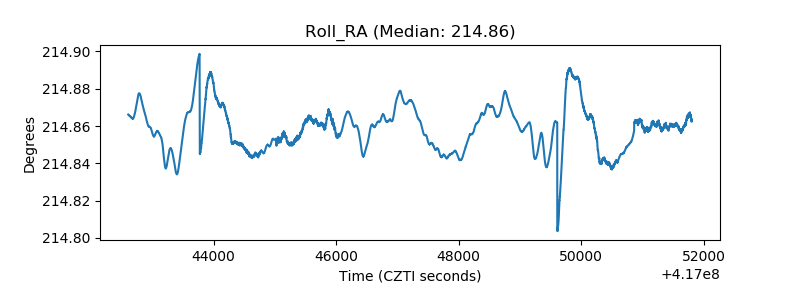 |
| Veto Counter | 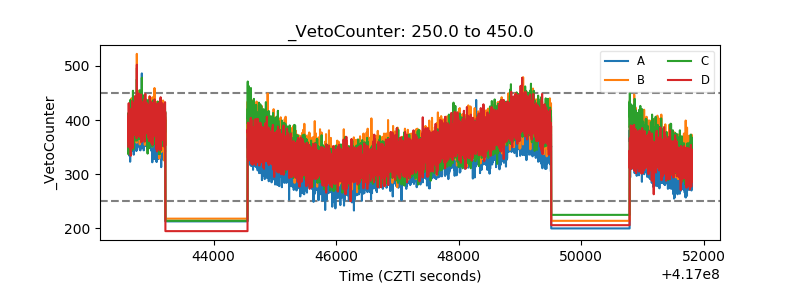 |