| Param | Original file | Final file |
|---|---|---|
| Filename | modeM0/AS1A12_022T01_9000005540_40425cztM0_level2.fits | modeM0/AS1A12_022T01_9000005540_40425cztM0_level2_quad_clean.evt |
| Size (bytes) | 665,069,760 | 175,230,720 |
| Size | 634.3 MB | 167.1 MB |
| Events in quadrant A | 5,745,137 | 1,174,010 |
| Events in quadrant B | 6,548,181 | 1,206,689 |
| Events in quadrant C | 5,123,308 | 1,163,789 |
| Events in quadrant D | 6,345,566 | 996,792 |
| Mode M0 | |||
|---|---|---|---|
| Quadrant | BADHDUFLAG | Total packets | Discarded packets |
| A | 0 | 24045 | 4 |
| B | 0 | 27544 | 3 |
| C | 0 | 22578 | 3 |
| D | 0 | 26894 | 3 |
| Mode M9 | |||
|---|---|---|---|
| Quadrant | BADHDUFLAG | Total packets | Discarded packets |
| A | 0 | 40 | 0 |
| B | 0 | 40 | 0 |
| C | 0 | 40 | 0 |
| D | 0 | 40 | 0 |
| Mode SS | |||
|---|---|---|---|
| Quadrant | BADHDUFLAG | Total packets | Discarded packets |
| A | 0 | 226 | 0 |
| B | 0 | 226 | 0 |
| C | 0 | 226 | 0 |
| D | 0 | 226 | 0 |
| Quadrant | Total seconds | Saturated seconds | Saturation percentage |
|---|---|---|---|
| A | 11034 | 53 | 0.480334% |
| B | 11034 | 116 | 1.051296% |
| C | 11034 | 18 | 0.163132% |
| D | 11034 | 952 | 8.627877% |
Noise dominated data is calculated using 1-second bins in cleaned event files. If a bin has >2000 counts, and if more than 50% of those come from <1% of pixels, then it is considered to be noise-dominated and hence unusable.
| Quadrant | # 1 sec bins | Bins with >0 counts | Bins with >2000 counts | High rate bins dominated by noise | Noise dominated (total time) | Noise dominated (detector-on time) | Marked lightcurve |
|---|---|---|---|---|---|---|---|
| A | 15093 | 11037 | 34 | 34 | 0.23% | 0.31% | 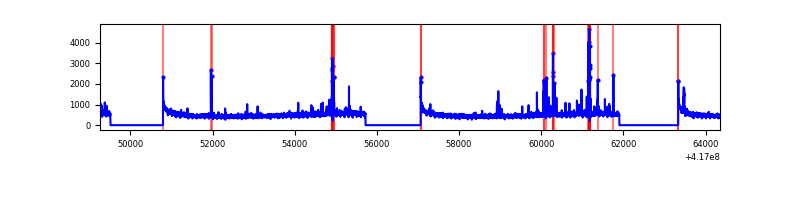 |
| B | 15093 | 11037 | 2 | 2 | 0.01% | 0.02% | 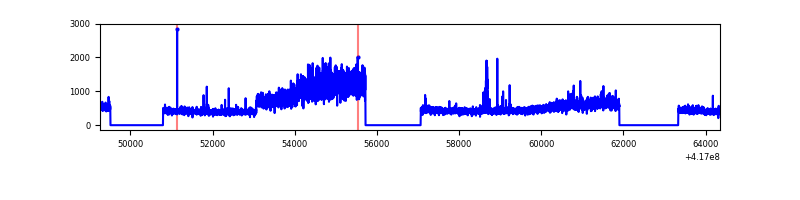 |
| C | 15093 | 11037 | 8 | 8 | 0.05% | 0.07% | 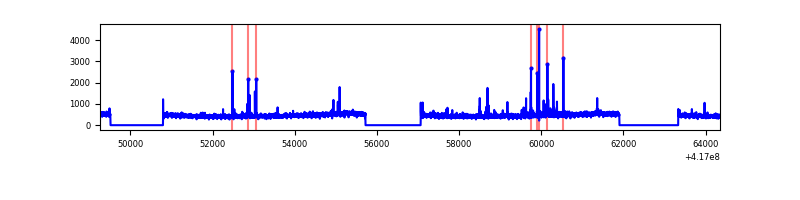 |
| D | 15093 | 11037 | 168 | 168 | 1.11% | 1.52% | 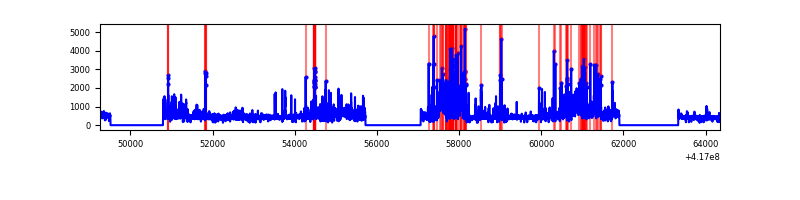 |
Top three noisy pixels from each quadrant. If the there are fewer than three noisy pixels in the level2.evt file, extra rows are filled as -1
| Pixel properties | Quadrant properties | ||||||
|---|---|---|---|---|---|---|---|
| Quadrant | DetID | PixID | Counts | Sigma | Mean | Median | Sigma |
| A | 10 | 83 | 878799 | 3654.55 | 1184 | 1161 | 240.1 |
| A | 13 | 248 | 213854 | 885.67 | 1184 | 1161 | 240.1 |
| A | 2 | 79 | 28015 | 111.82 | 1184 | 1161 | 240.1 |
| B | 7 | 202 | 1583275 | 7031.57 | 1173 | 1141 | 225.0 |
| B | 3 | 112 | 150170 | 662.34 | 1173 | 1141 | 225.0 |
| B | 4 | 170 | 91975 | 403.7 | 1173 | 1141 | 225.0 |
| C | 15 | 214 | 473091 | 1768.15 | 1154 | 1161 | 266.9 |
| C | 14 | 254 | 135192 | 502.17 | 1154 | 1161 | 266.9 |
| C | 4 | 254 | 10025 | 33.21 | 1154 | 1161 | 266.9 |
| D | 12 | 227 | 1215027 | 4480.7 | 1103 | 1070 | 270.9 |
| D | 12 | 191 | 291011 | 1070.17 | 1103 | 1070 | 270.9 |
| D | 2 | 250 | 129886 | 475.46 | 1103 | 1070 | 270.9 |
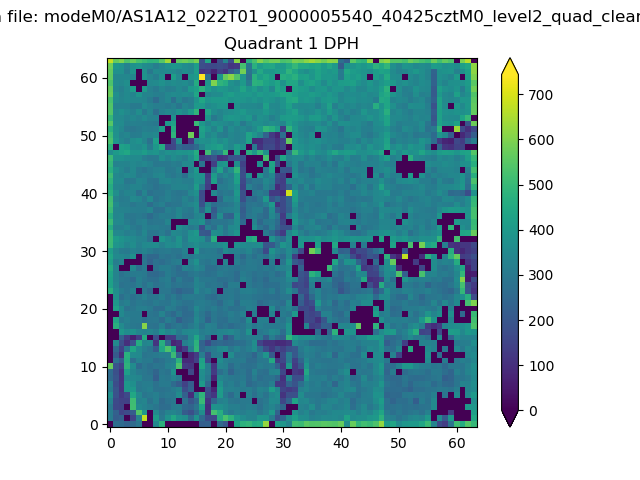
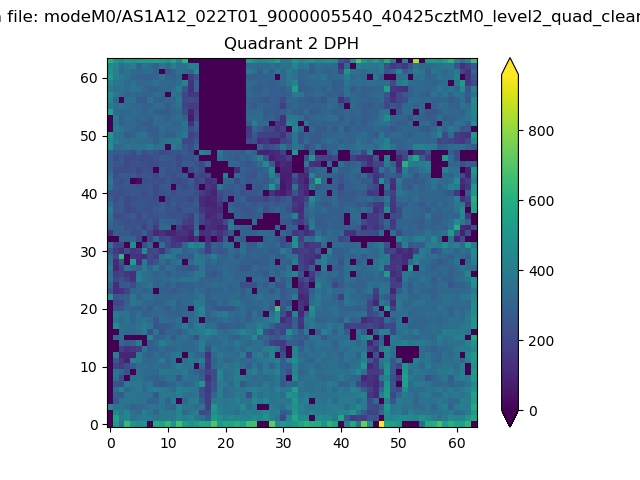
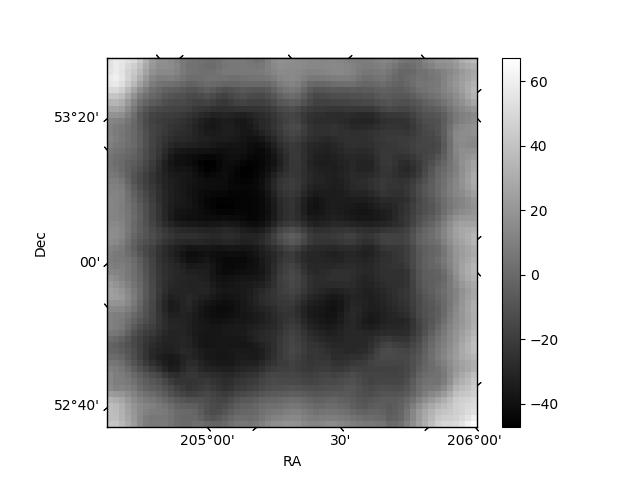
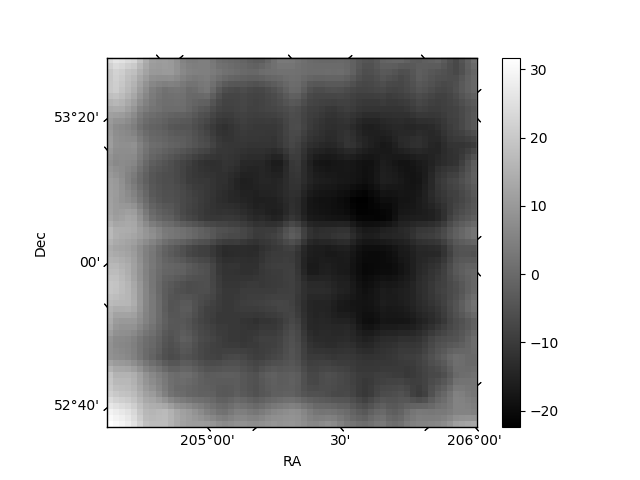
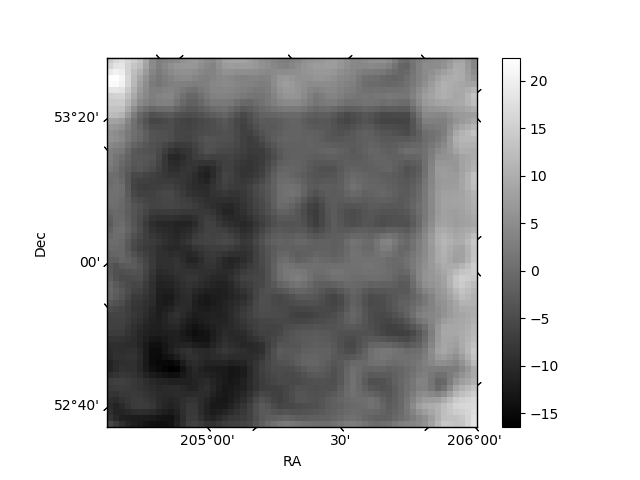
Histogram calculated using DETX and DETY for each event in the final _common_clean file
| Quadrant A |  |
 |
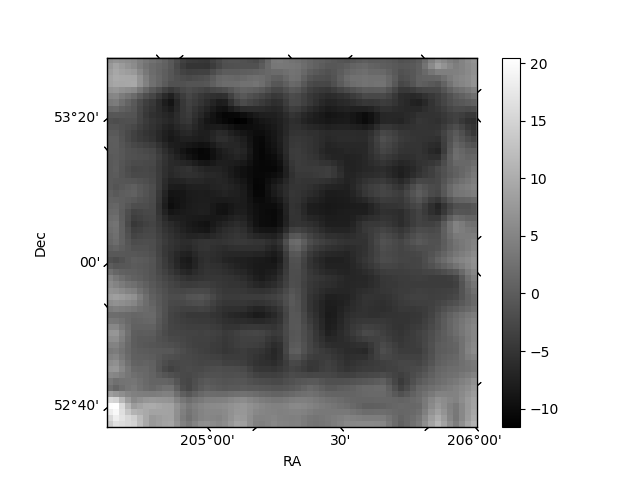
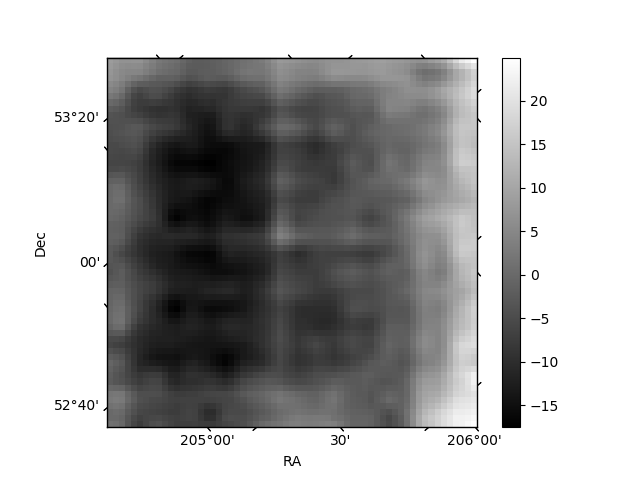
Quadrant B |
|---|---|---|---|
| Quadrant D | 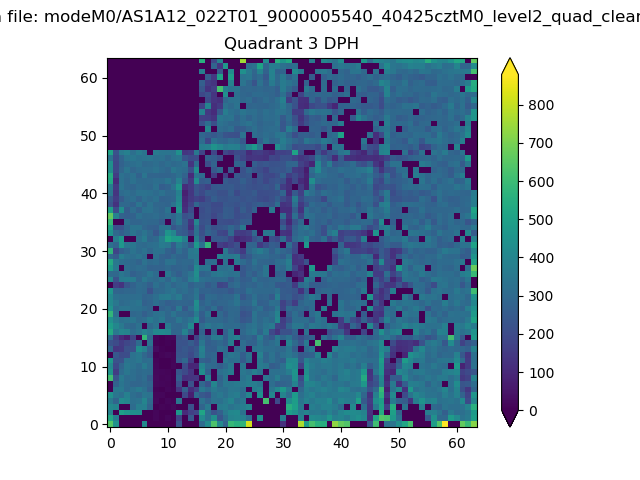 |
 |
Quadrant C |
| Plot type | Count rate plots | Images |
|---|---|---|
| Comparison with Poisson distribution Blue bars denote a histogram of data divided into 1 sec bins. Red curve is a Poisson curve with rate = median count rate of data. |
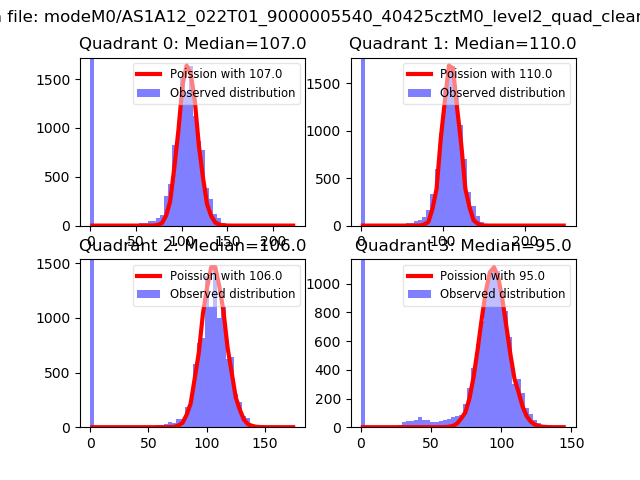 |
 |
| Quadrant-wise count rates Data is divided into 100 sec bins |
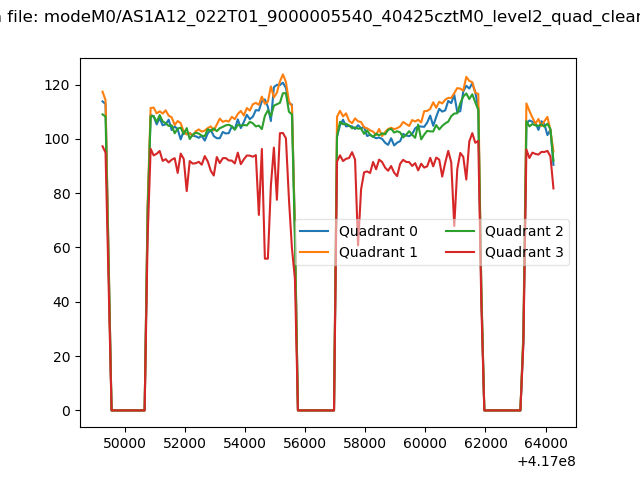 |
|
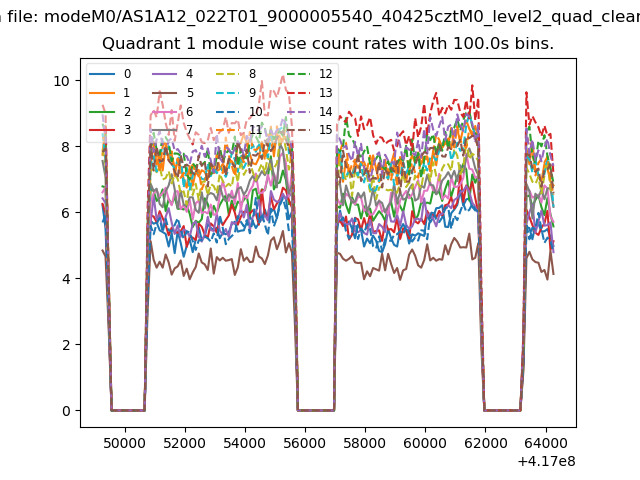
| Module-wise count rates for Quadrant A Data is divided into 100 sec bins |
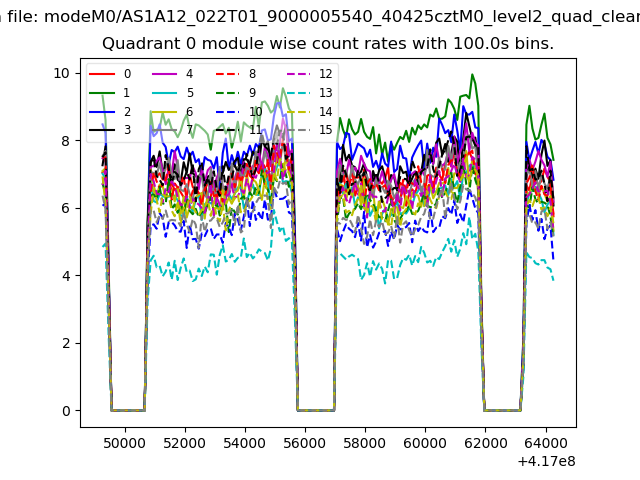 |
 |
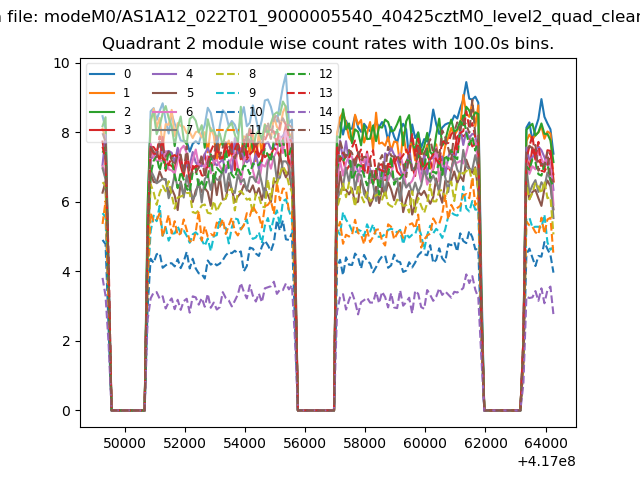
| Module-wise count rates for Quadrant B Data is divided into 100 sec bins |
 |
 |
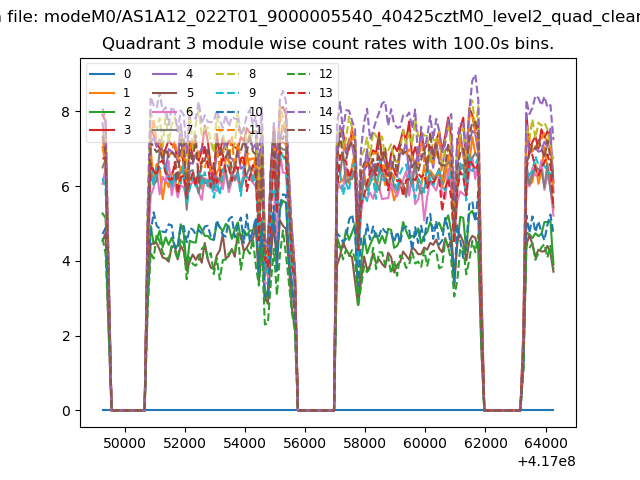
| Module-wise count rates for Quadrant C Data is divided into 100 sec bins |
 |
 |
| Module-wise count rates for Quadrant D Data is divided into 100 sec bins |
 |
 |
| Parameter | Plot |
|---|---|
| CZT HV Monitor | 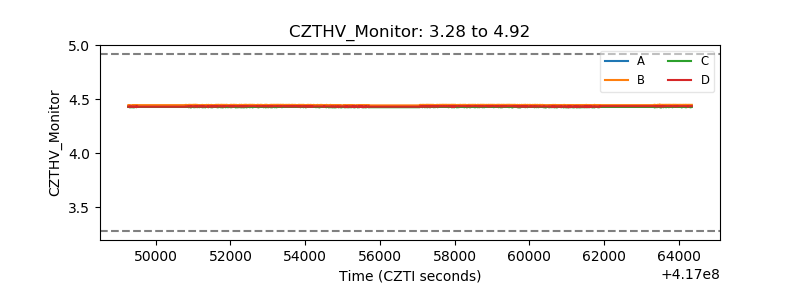 |
| D_VDD | 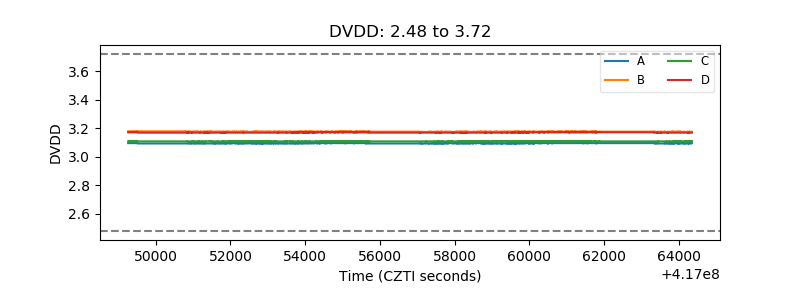 |
| Temperature 1 | 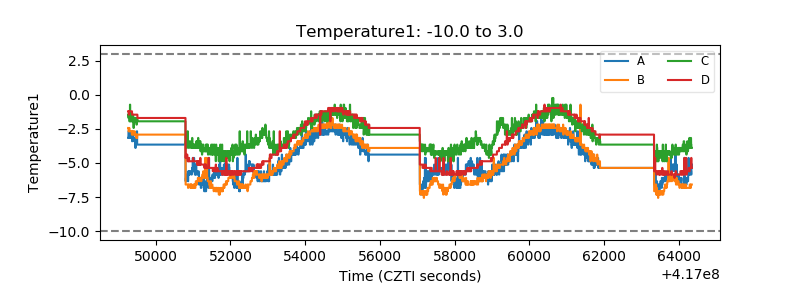 |
| Veto HV Monitor | 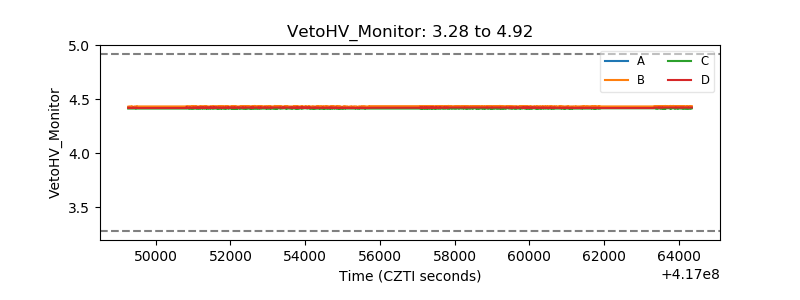 |
| Veto LLD | 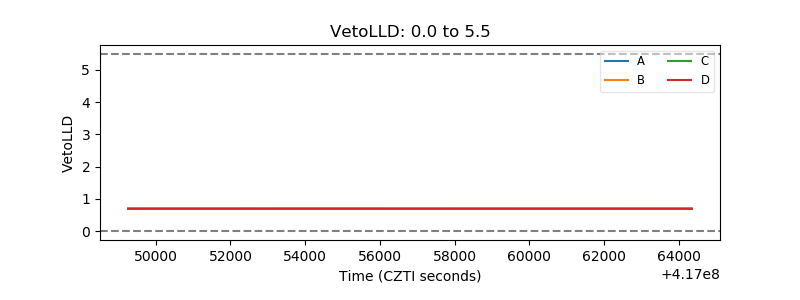 |
| Alpha Counter | 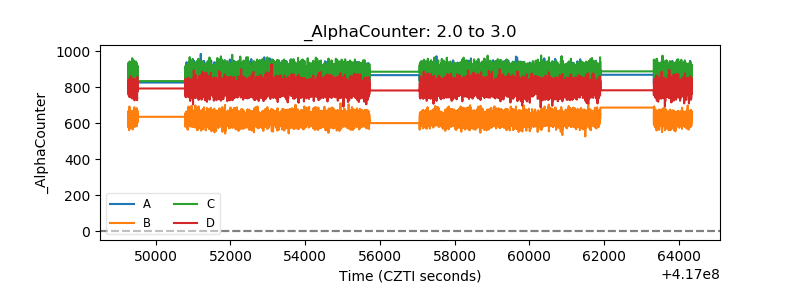 |
| _CPM_Rate | 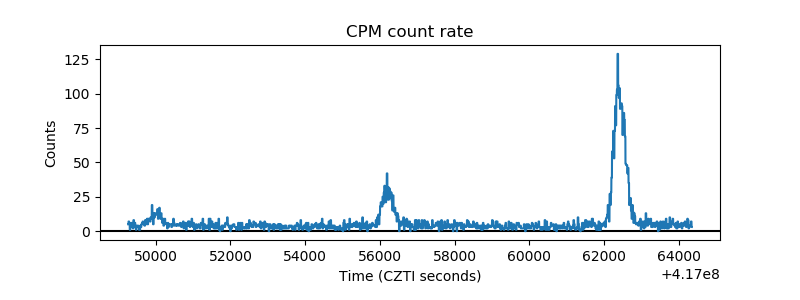 |
| CZT Counter | 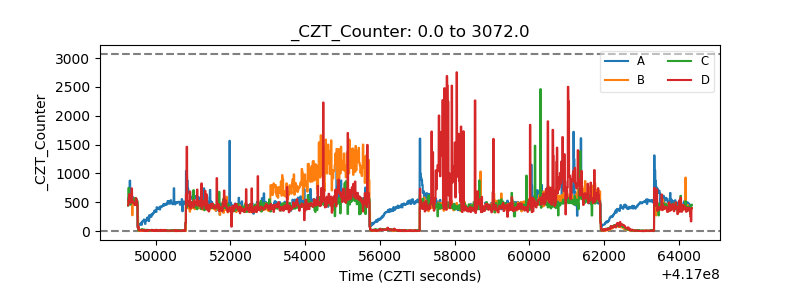 |
| +2.5 Volts monitor | 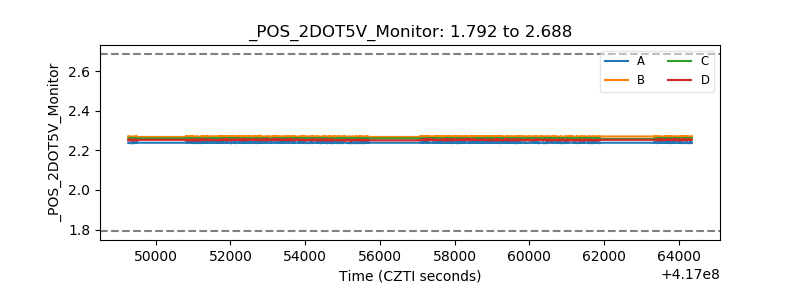 |
| +5 Volts monitor | 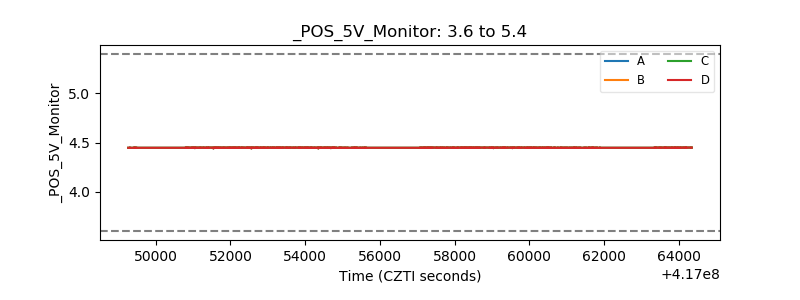 |
| _ROLL_ROT | 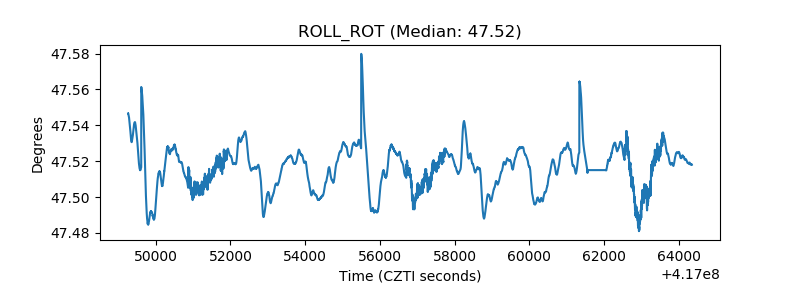 |
| _Roll_DEC | 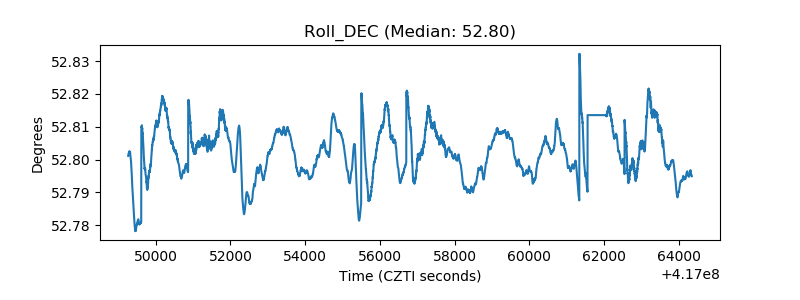 |
| _Roll_RA | 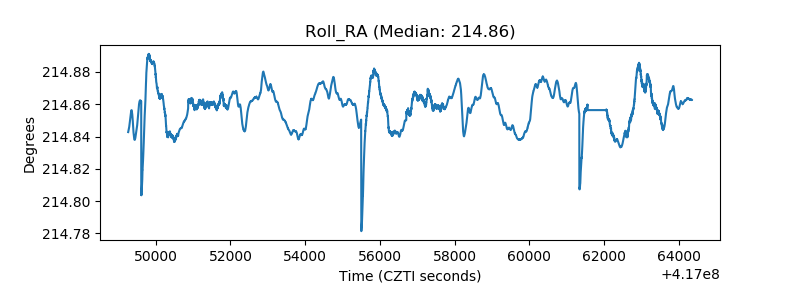 |
| Veto Counter | 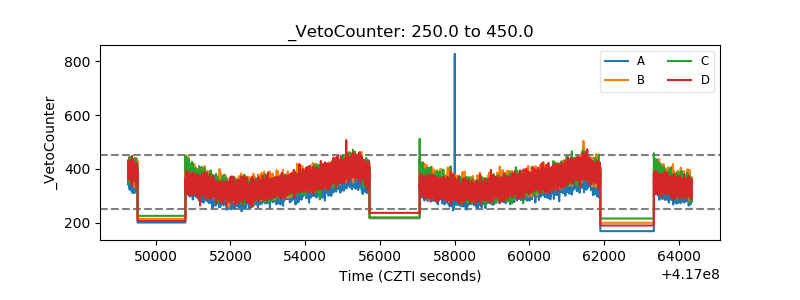 |