| Param | Original file | Final file |
|---|---|---|
| Filename | modeM0/AS1A12_022T01_9000005540_40426cztM0_level2.fits | modeM0/AS1A12_022T01_9000005540_40426cztM0_level2_quad_clean.evt |
| Size (bytes) | 328,308,480 | 90,624,960 |
| Size | 313.1 MB | 86.4 MB |
| Events in quadrant A | 2,925,703 | 611,838 |
| Events in quadrant B | 3,343,876 | 616,611 |
| Events in quadrant C | 2,582,248 | 601,727 |
| Events in quadrant D | 2,857,398 | 516,049 |
| Mode M0 | |||
|---|---|---|---|
| Quadrant | BADHDUFLAG | Total packets | Discarded packets |
| A | 0 | 12181 | 3 |
| B | 0 | 13964 | 2 |
| C | 0 | 11467 | 2 |
| D | 0 | 12732 | 2 |
| Mode M9 | |||
|---|---|---|---|
| Quadrant | BADHDUFLAG | Total packets | Discarded packets |
| A | 0 | 21 | 0 |
| B | 0 | 21 | 0 |
| C | 0 | 21 | 0 |
| D | 0 | 22 | 0 |
| Mode SS | |||
|---|---|---|---|
| Quadrant | BADHDUFLAG | Total packets | Discarded packets |
| A | 0 | 116 | 0 |
| B | 0 | 116 | 0 |
| C | 0 | 116 | 0 |
| D | 0 | 116 | 0 |
| Quadrant | Total seconds | Saturated seconds | Saturation percentage |
|---|---|---|---|
| A | 5687 | 7 | 0.123088% |
| B | 5687 | 151 | 2.655178% |
| C | 5687 | 4 | 0.070336% |
| D | 5687 | 424 | 7.455600% |
Noise dominated data is calculated using 1-second bins in cleaned event files. If a bin has >2000 counts, and if more than 50% of those come from <1% of pixels, then it is considered to be noise-dominated and hence unusable.
| Quadrant | # 1 sec bins | Bins with >0 counts | Bins with >2000 counts | High rate bins dominated by noise | Noise dominated (total time) | Noise dominated (detector-on time) | Marked lightcurve |
|---|---|---|---|---|---|---|---|
| A | 7272 | 5688 | 4 | 4 | 0.06% | 0.07% | 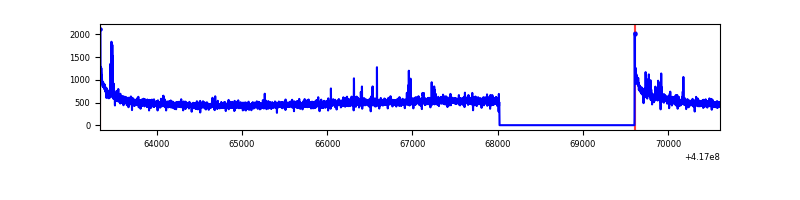 |
| B | 7272 | 5688 | 99 | 99 | 1.36% | 1.74% | 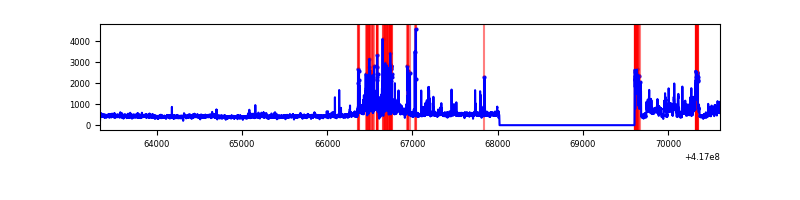 |
| C | 7272 | 5688 | 0 | 0 | 0.00% | 0.00% | 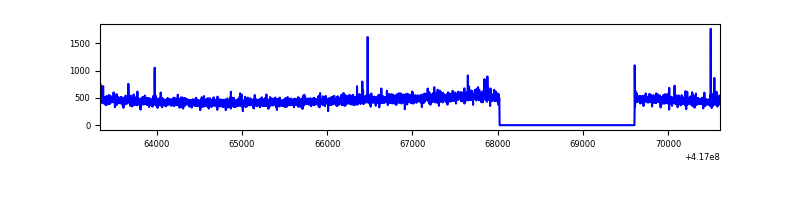 |
| D | 7272 | 5688 | 50 | 50 | 0.69% | 0.88% | 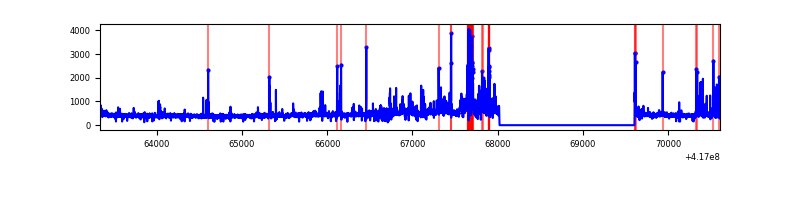 |
Top three noisy pixels from each quadrant. If the there are fewer than three noisy pixels in the level2.evt file, extra rows are filled as -1
| Pixel properties | Quadrant properties | ||||||
|---|---|---|---|---|---|---|---|
| Quadrant | DetID | PixID | Counts | Sigma | Mean | Median | Sigma |
| A | 10 | 83 | 496675 | 3985.54 | 610 | 597 | 124.5 |
| A | 13 | 248 | 25701 | 201.69 | 610 | 597 | 124.5 |
| A | 9 | 191 | 20256 | 157.94 | 610 | 597 | 124.5 |
| B | 7 | 202 | 422561 | 3607.8 | 601 | 583 | 117.0 |
| B | 5 | 255 | 417898 | 3567.93 | 601 | 583 | 117.0 |
| B | 0 | 230 | 58425 | 494.53 | 601 | 583 | 117.0 |
| C | 15 | 214 | 247298 | 1768.68 | 593 | 595 | 139.5 |
| C | 14 | 254 | 16437 | 113.58 | 593 | 595 | 139.5 |
| C | 13 | 61 | 3907 | 23.74 | 593 | 595 | 139.5 |
| D | 12 | 227 | 177438 | 1270.42 | 565 | 549 | 139.2 |
| D | 2 | 250 | 156680 | 1121.34 | 565 | 549 | 139.2 |
| D | 12 | 191 | 146683 | 1049.54 | 565 | 549 | 139.2 |
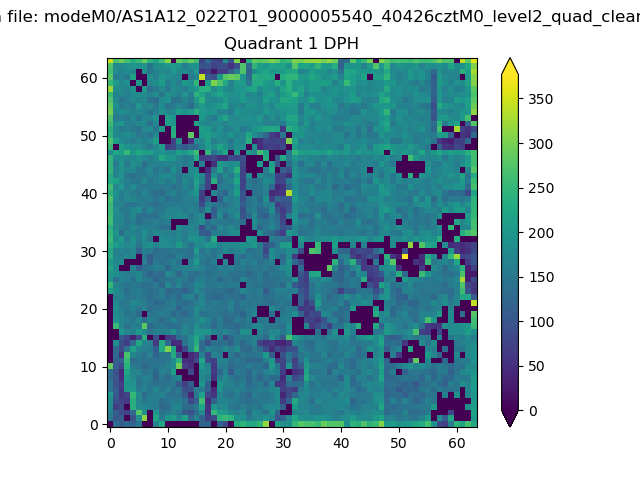
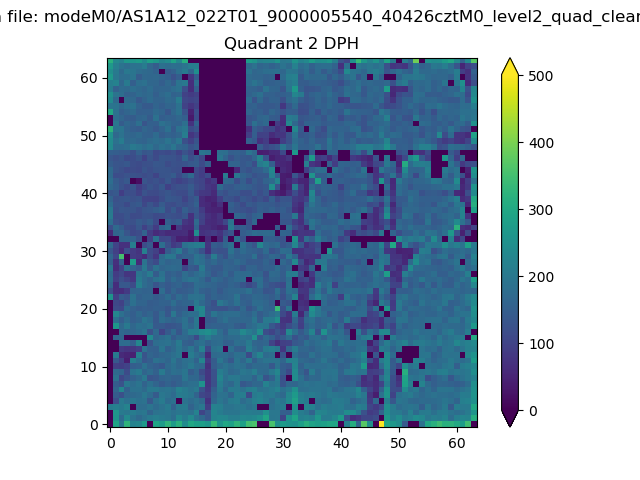
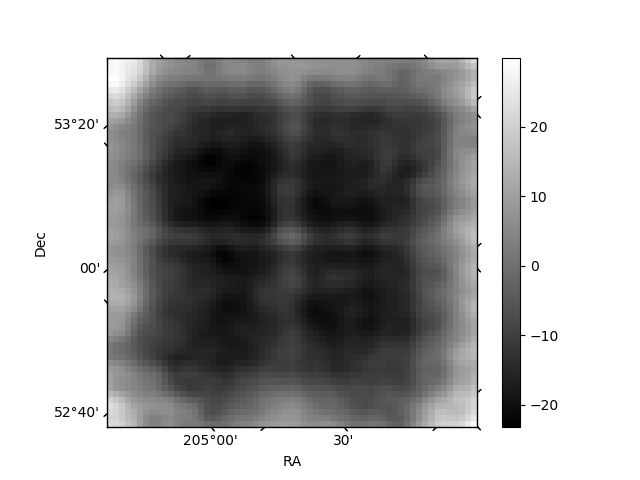
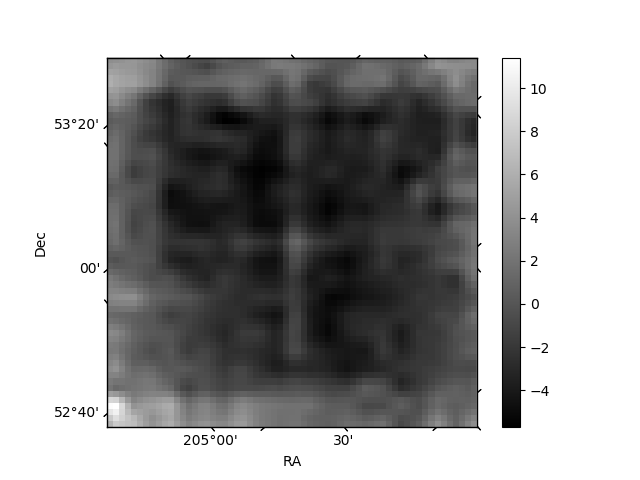
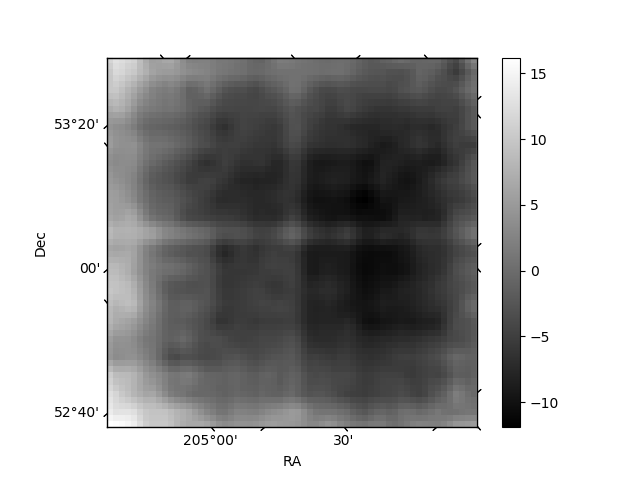
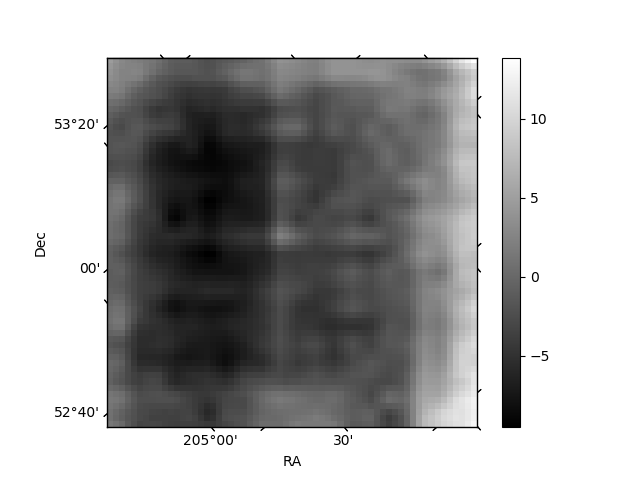
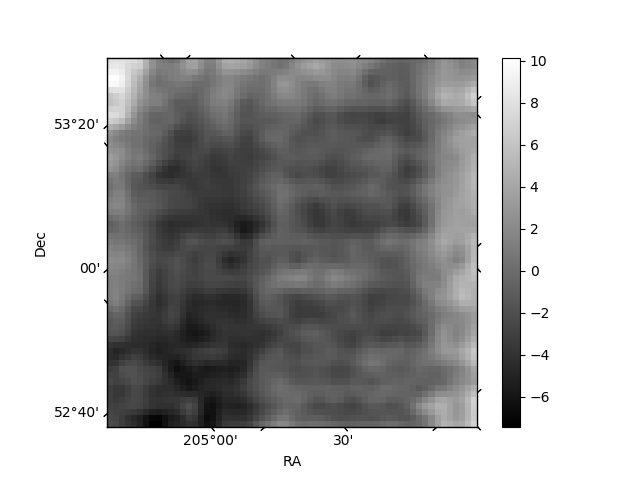
Histogram calculated using DETX and DETY for each event in the final _common_clean file
| Quadrant A |  |
 |
Quadrant B |
|---|---|---|---|
| Quadrant D | 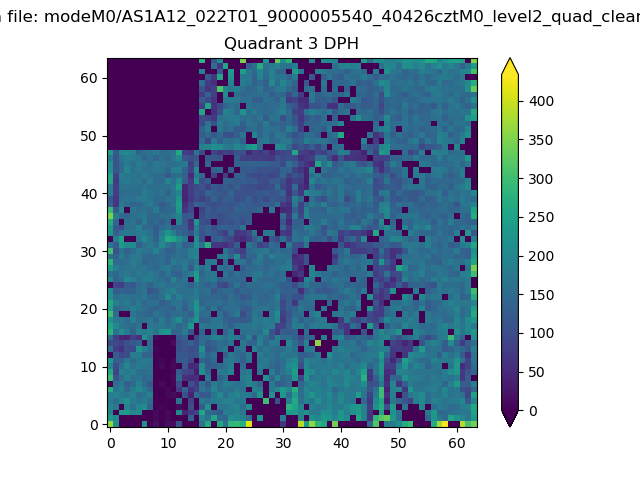 |
 |
Quadrant C |
| Plot type | Count rate plots | Images |
|---|---|---|
| Comparison with Poisson distribution Blue bars denote a histogram of data divided into 1 sec bins. Red curve is a Poisson curve with rate = median count rate of data. |
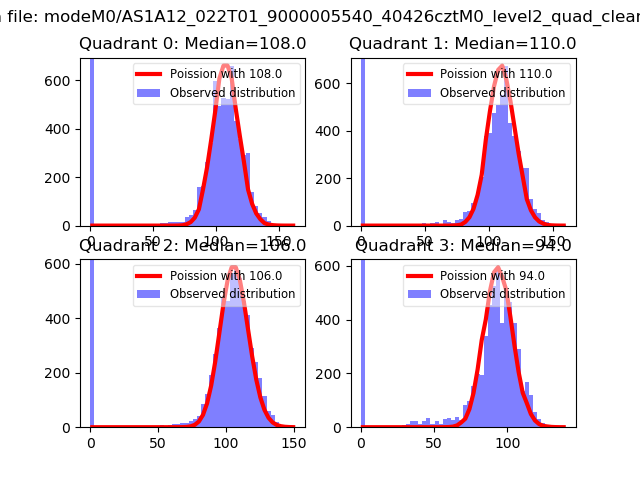 |
 |
| Quadrant-wise count rates Data is divided into 100 sec bins |
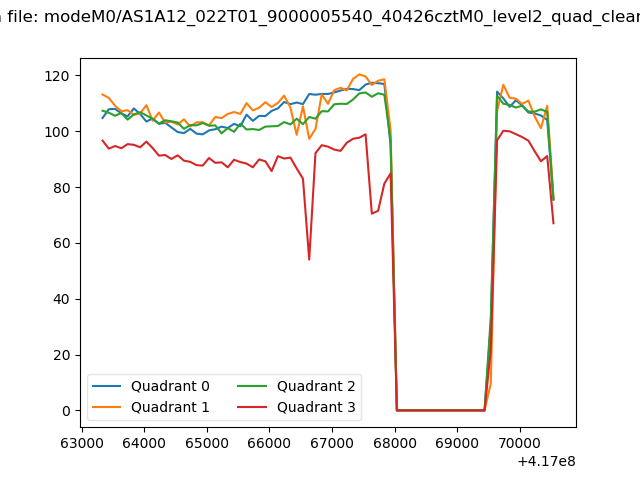 |
|
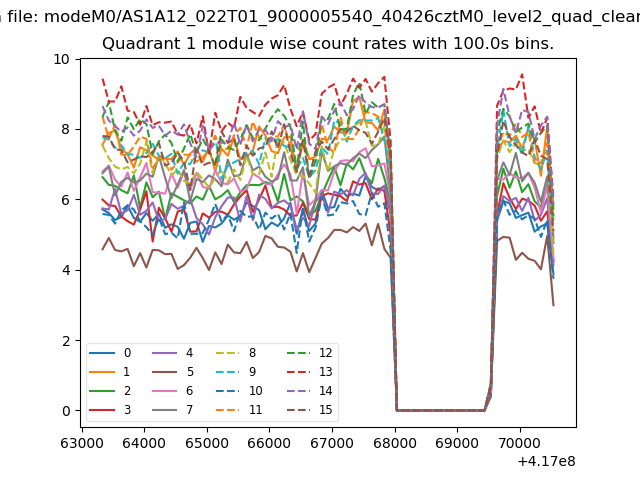
| Module-wise count rates for Quadrant A Data is divided into 100 sec bins |
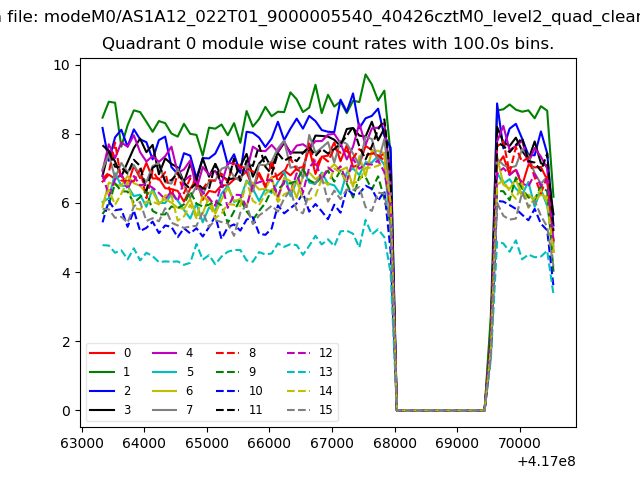 |
 |
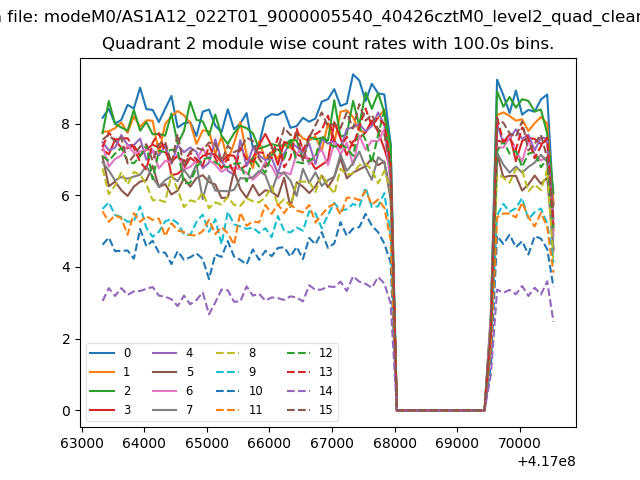
| Module-wise count rates for Quadrant B Data is divided into 100 sec bins |
 |
 |
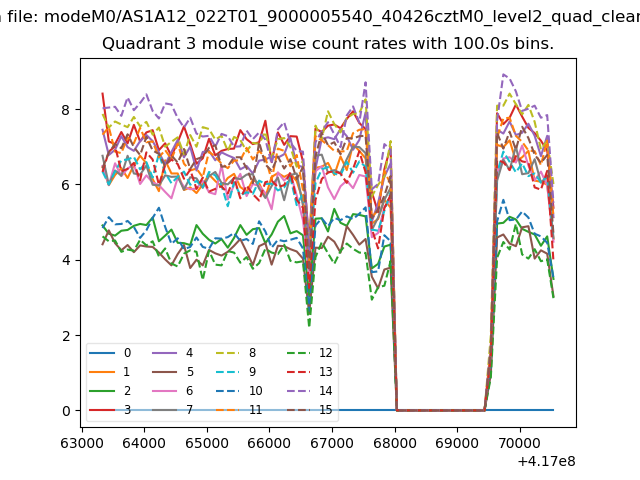
| Module-wise count rates for Quadrant C Data is divided into 100 sec bins |
 |
 |
| Module-wise count rates for Quadrant D Data is divided into 100 sec bins |
 |
 |
| Parameter | Plot |
|---|---|
| CZT HV Monitor | 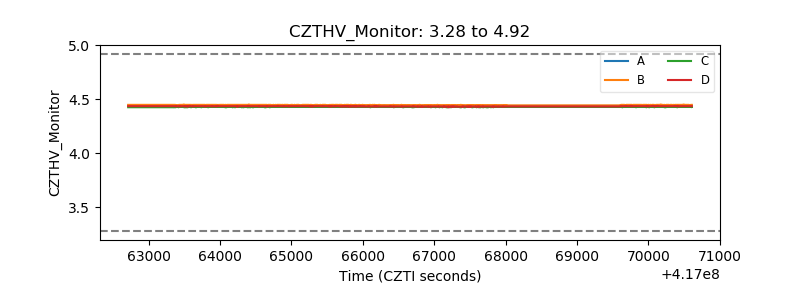 |
| D_VDD | 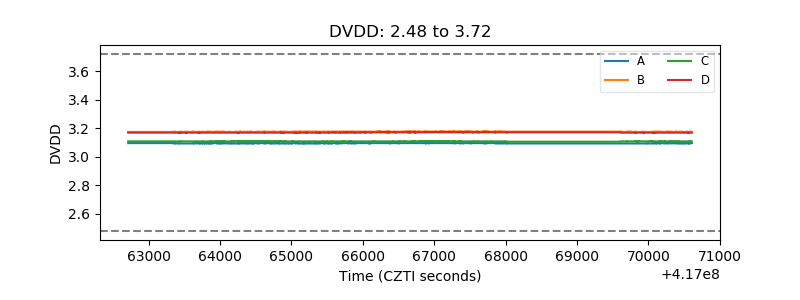 |
| Temperature 1 | 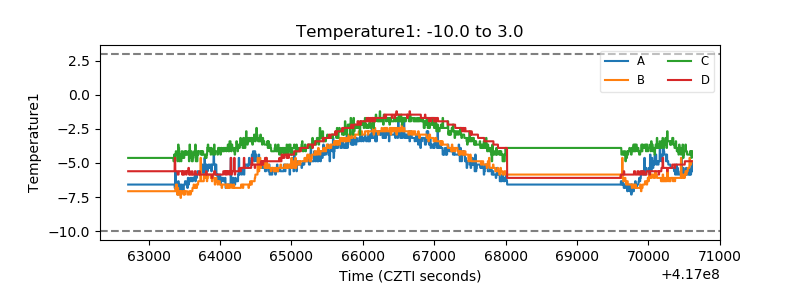 |
| Veto HV Monitor | 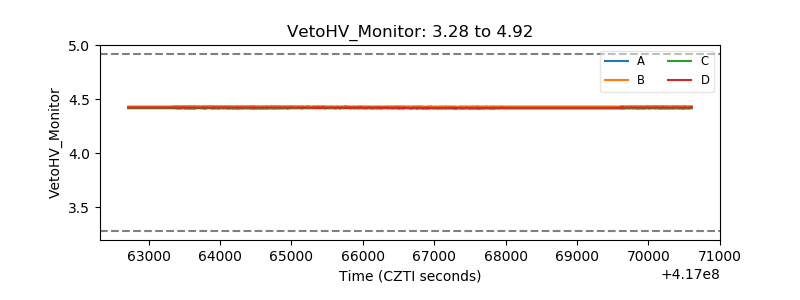 |
| Veto LLD | 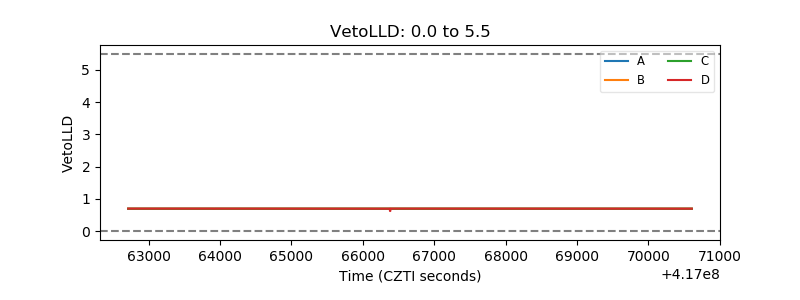 |
| Alpha Counter | 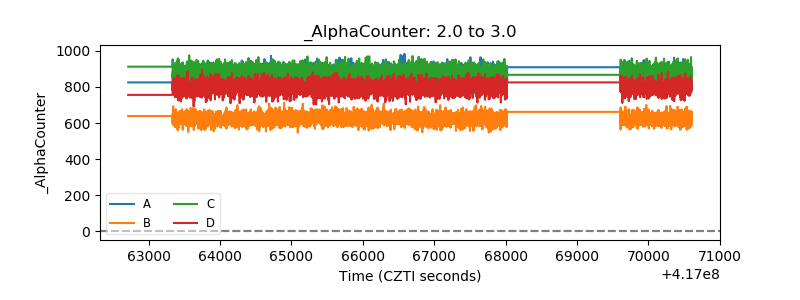 |
| _CPM_Rate | 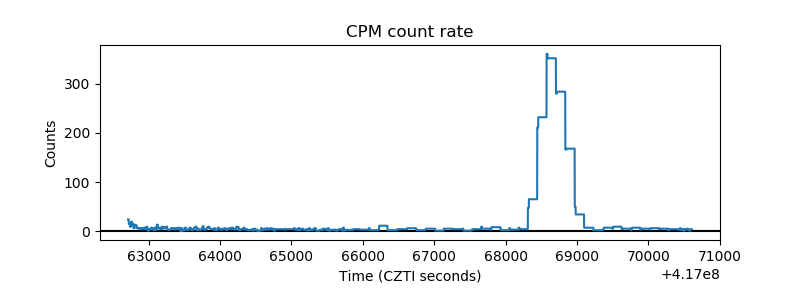 |
| CZT Counter | 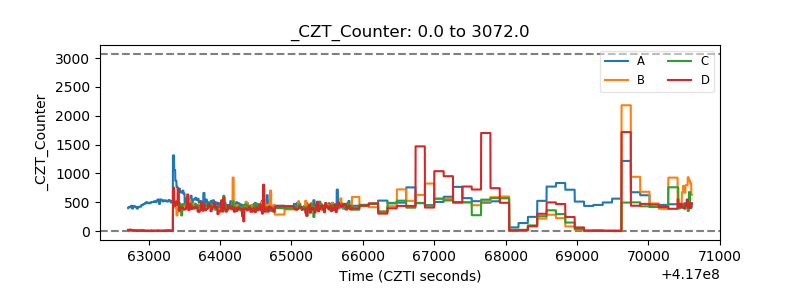 |
| +2.5 Volts monitor |  |
| +5 Volts monitor | 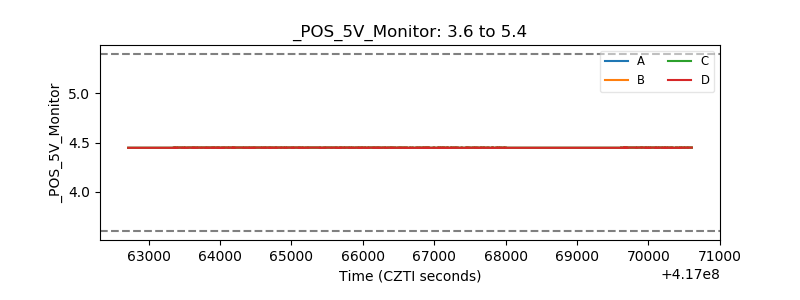 |
| _ROLL_ROT | 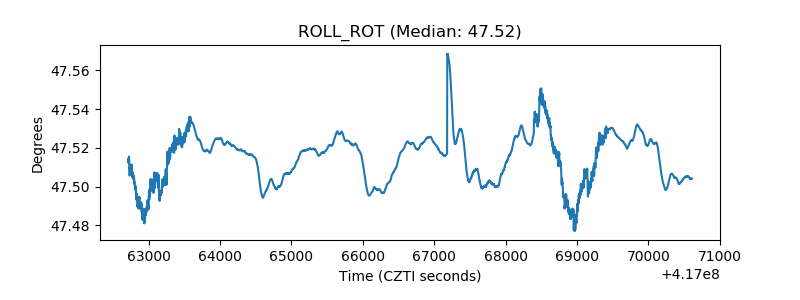 |
| _Roll_DEC | 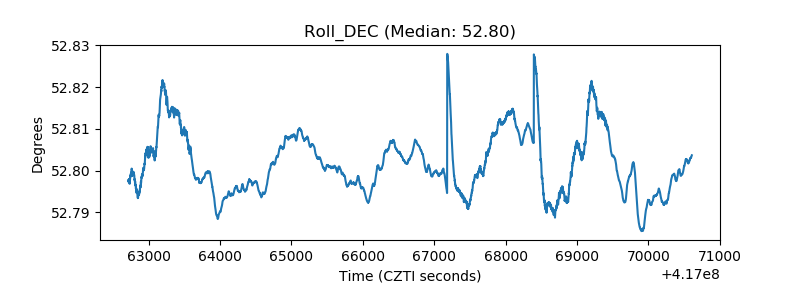 |
| _Roll_RA | 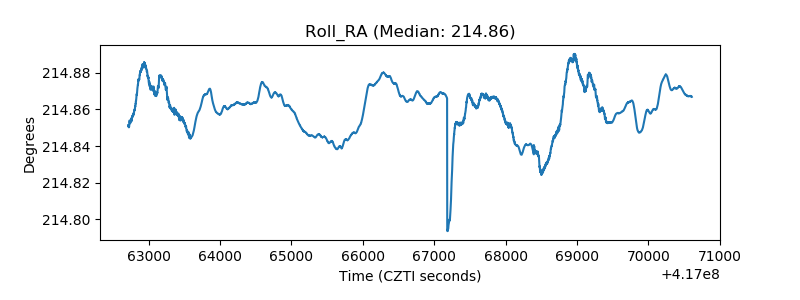 |
| Veto Counter | 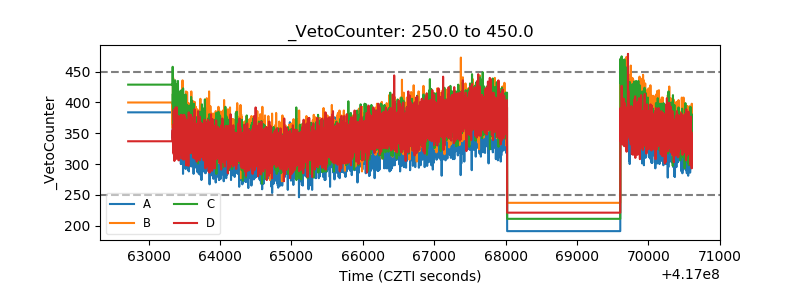 |