| Param | Original file | Final file |
|---|---|---|
| Filename | modeM0/AS1A12_022T01_9000005540_40427cztM0_level2.fits | modeM0/AS1A12_022T01_9000005540_40427cztM0_level2_quad_clean.evt |
| Size (bytes) | 364,518,720 | 90,362,880 |
| Size | 347.6 MB | 86.2 MB |
| Events in quadrant A | 3,047,448 | 617,732 |
| Events in quadrant B | 4,388,242 | 585,613 |
| Events in quadrant C | 2,602,705 | 608,644 |
| Events in quadrant D | 3,013,671 | 527,974 |
| Mode M0 | |||
|---|---|---|---|
| Quadrant | BADHDUFLAG | Total packets | Discarded packets |
| A | 0 | 12526 | 2 |
| B | 0 | 16724 | 1 |
| C | 0 | 11425 | 1 |
| D | 0 | 12870 | 1 |
| Mode M9 | |||
|---|---|---|---|
| Quadrant | BADHDUFLAG | Total packets | Discarded packets |
| A | 0 | 17 | 0 |
| B | 0 | 17 | 0 |
| C | 0 | 17 | 0 |
| D | 0 | 17 | 0 |
| Mode SS | |||
|---|---|---|---|
| Quadrant | BADHDUFLAG | Total packets | Discarded packets |
| A | 0 | 116 | 0 |
| B | 0 | 116 | 0 |
| C | 0 | 116 | 0 |
| D | 0 | 116 | 0 |
| Quadrant | Total seconds | Saturated seconds | Saturation percentage |
|---|---|---|---|
| A | 5660 | 52 | 0.918728% |
| B | 5660 | 550 | 9.717314% |
| C | 5660 | 3 | 0.053004% |
| D | 5660 | 400 | 7.067138% |
Noise dominated data is calculated using 1-second bins in cleaned event files. If a bin has >2000 counts, and if more than 50% of those come from <1% of pixels, then it is considered to be noise-dominated and hence unusable.
| Quadrant | # 1 sec bins | Bins with >0 counts | Bins with >2000 counts | High rate bins dominated by noise | Noise dominated (total time) | Noise dominated (detector-on time) | Marked lightcurve |
|---|---|---|---|---|---|---|---|
| A | 7364 | 5661 | 40 | 40 | 0.54% | 0.71% | 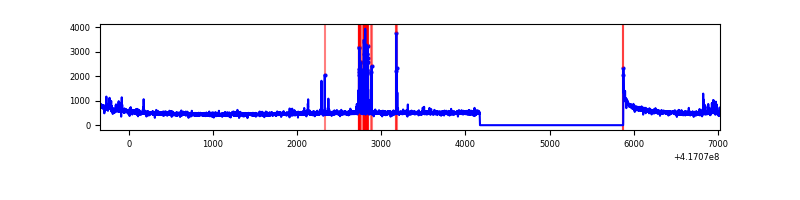 |
| B | 7364 | 5661 | 475 | 475 | 6.45% | 8.39% | 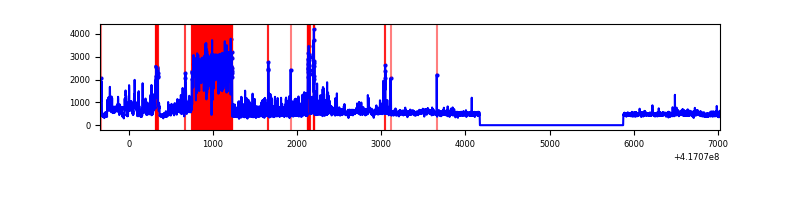 |
| C | 7364 | 5661 | 1 | 1 | 0.01% | 0.02% | 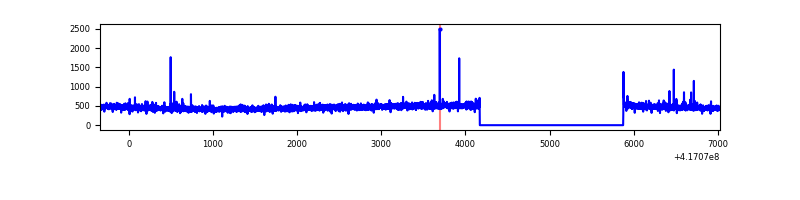 |
| D | 7364 | 5661 | 55 | 55 | 0.75% | 0.97% | 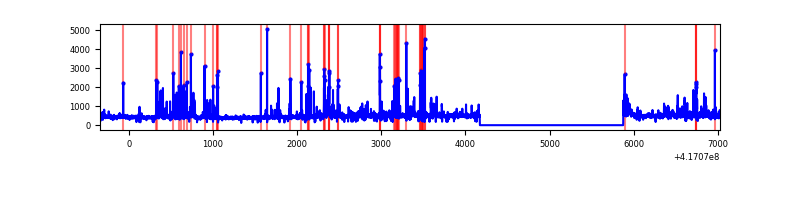 |
Top three noisy pixels from each quadrant. If the there are fewer than three noisy pixels in the level2.evt file, extra rows are filled as -1
| Pixel properties | Quadrant properties | ||||||
|---|---|---|---|---|---|---|---|
| Quadrant | DetID | PixID | Counts | Sigma | Mean | Median | Sigma |
| A | 10 | 83 | 459532 | 3672.07 | 615 | 603 | 125.0 |
| A | 13 | 248 | 177228 | 1413.25 | 615 | 603 | 125.0 |
| A | 9 | 191 | 19386 | 150.29 | 615 | 603 | 125.0 |
| B | 7 | 202 | 1725993 | 15015.86 | 591 | 574 | 114.9 |
| B | 3 | 112 | 161872 | 1403.73 | 591 | 574 | 114.9 |
| B | 0 | 230 | 109465 | 947.65 | 591 | 574 | 114.9 |
| C | 15 | 214 | 246253 | 1762.42 | 596 | 601 | 139.4 |
| C | 14 | 254 | 19725 | 137.2 | 596 | 601 | 139.4 |
| C | 5 | 250 | 5157 | 32.68 | 596 | 601 | 139.4 |
| D | 12 | 227 | 332460 | 2351.01 | 575 | 561 | 141.2 |
| D | 12 | 191 | 149898 | 1057.83 | 575 | 561 | 141.2 |
| D | 13 | 249 | 103334 | 727.99 | 575 | 561 | 141.2 |
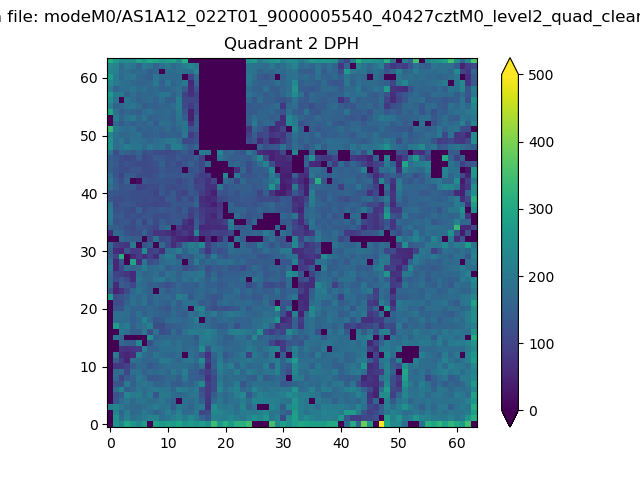
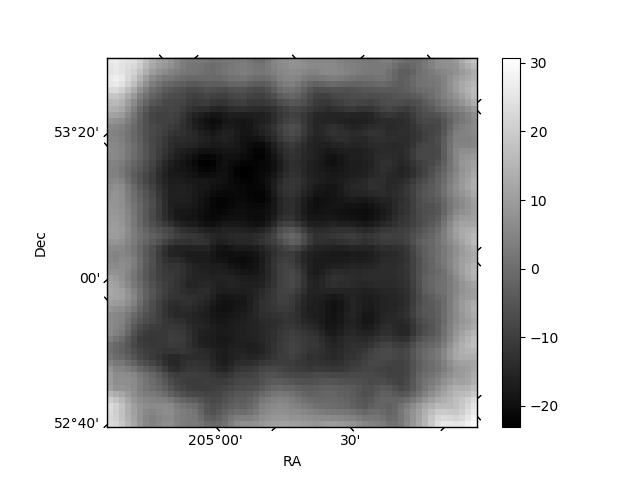
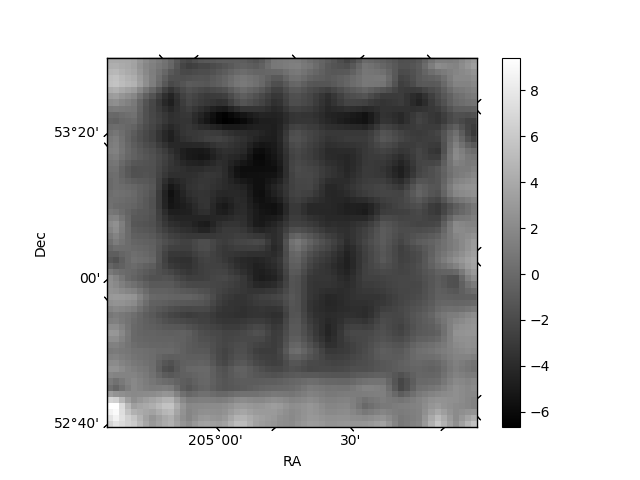
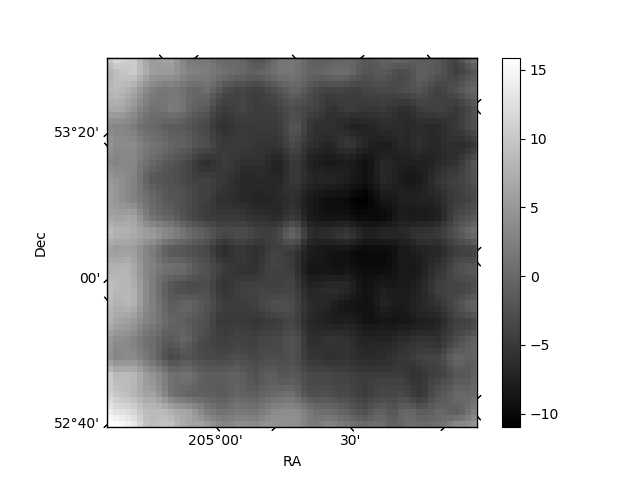
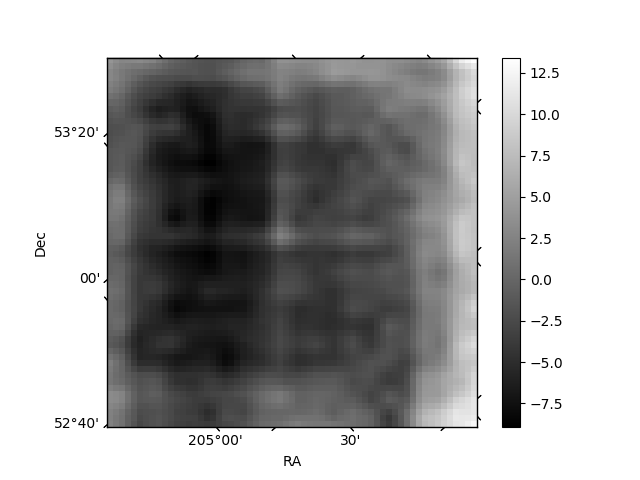
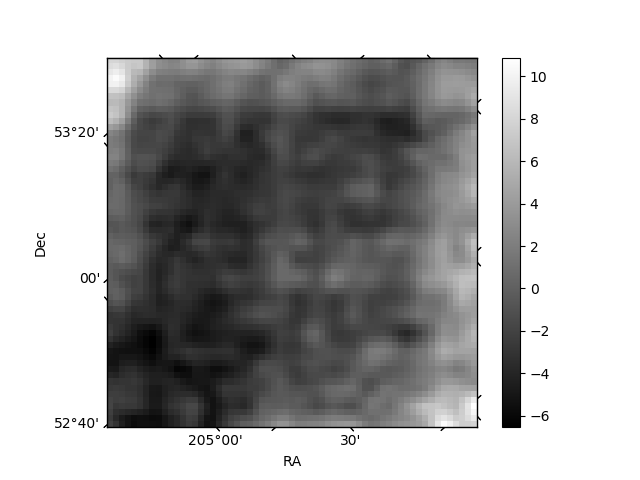
Histogram calculated using DETX and DETY for each event in the final _common_clean file
| Quadrant A | 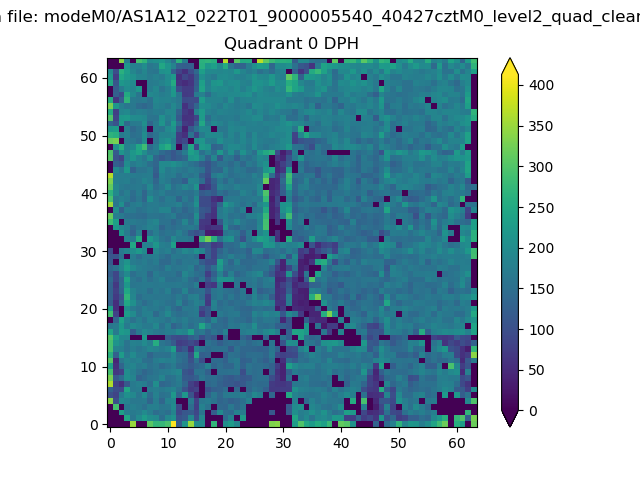 |
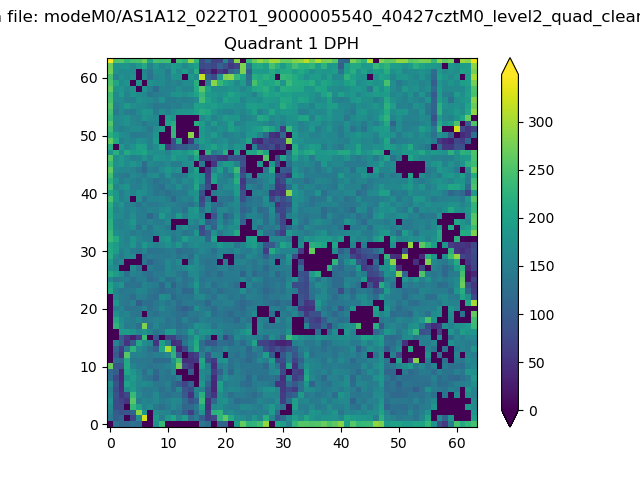 |
Quadrant B |
|---|---|---|---|
| Quadrant D | 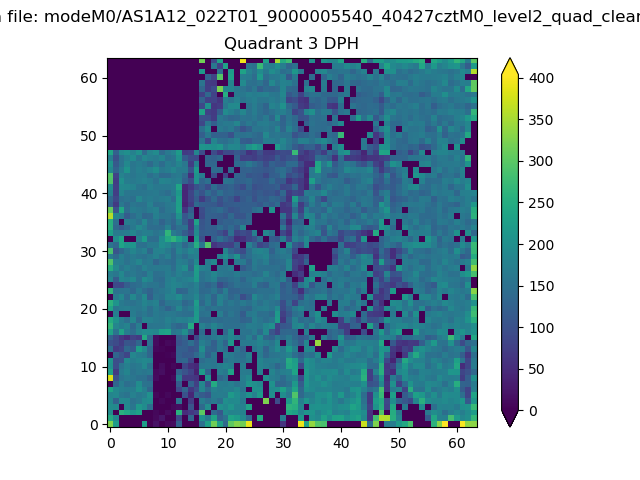 |
 |
Quadrant C |
| Plot type | Count rate plots | Images |
|---|---|---|
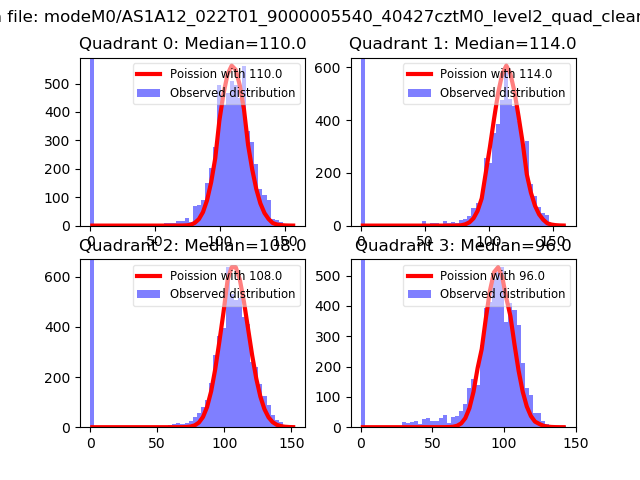
| Comparison with Poisson distribution Blue bars denote a histogram of data divided into 1 sec bins. Red curve is a Poisson curve with rate = median count rate of data. |
 |
 |
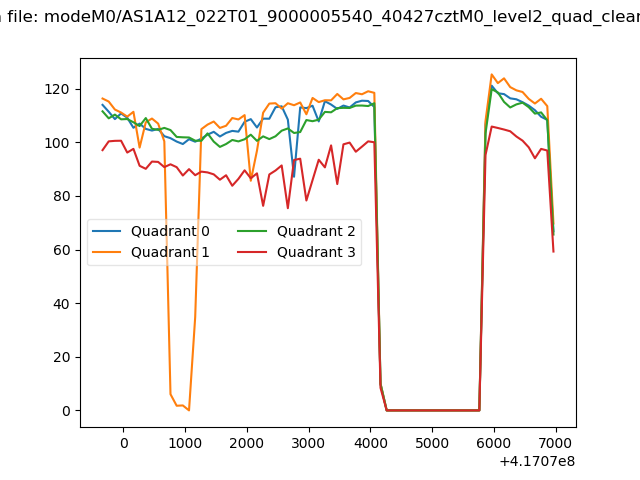
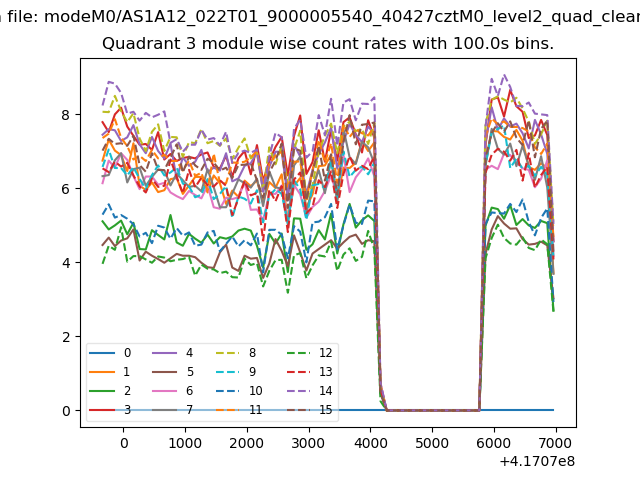
| Quadrant-wise count rates Data is divided into 100 sec bins |
 |
|
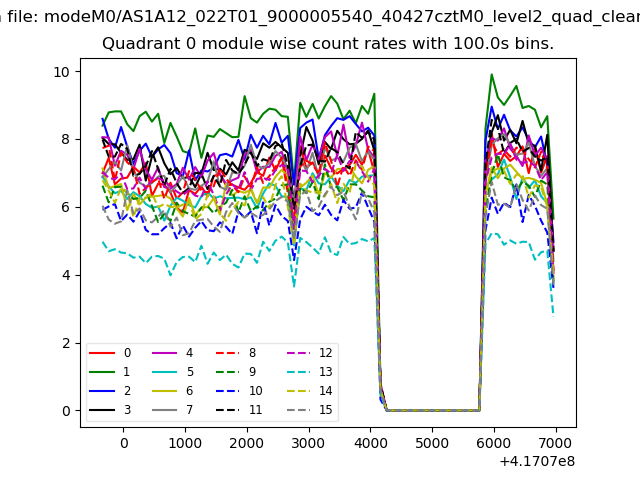
| Module-wise count rates for Quadrant A Data is divided into 100 sec bins |
 |
 |
| Module-wise count rates for Quadrant B Data is divided into 100 sec bins |
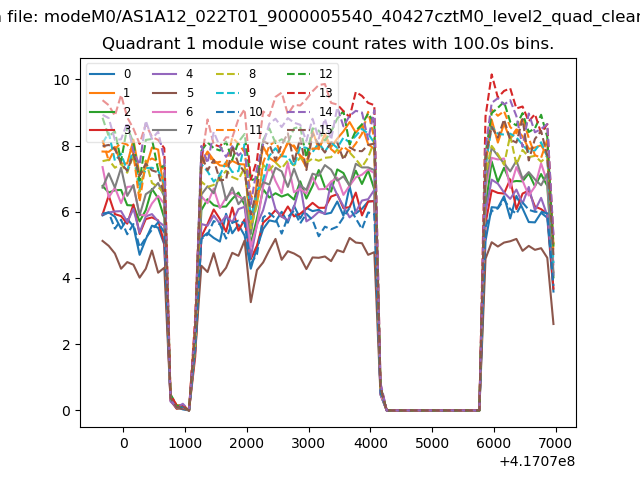 |
 |
| Module-wise count rates for Quadrant C Data is divided into 100 sec bins |
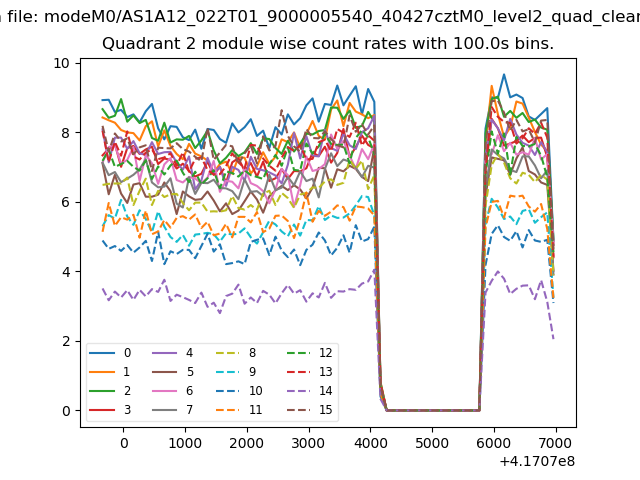 |
 |
| Module-wise count rates for Quadrant D Data is divided into 100 sec bins |
 |
 |
| Parameter | Plot |
|---|---|
| CZT HV Monitor | 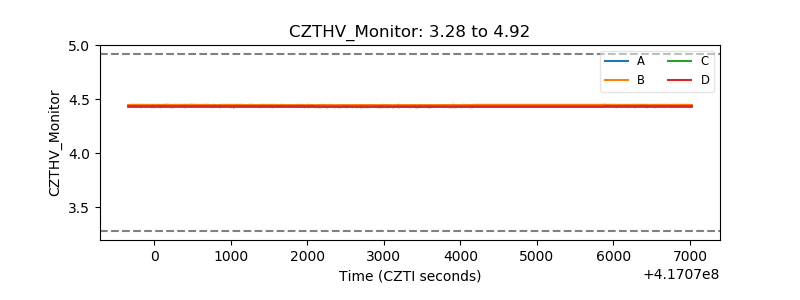 |
| D_VDD | 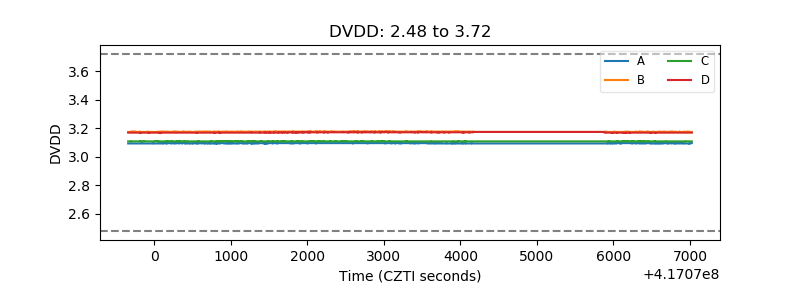 |
| Temperature 1 | 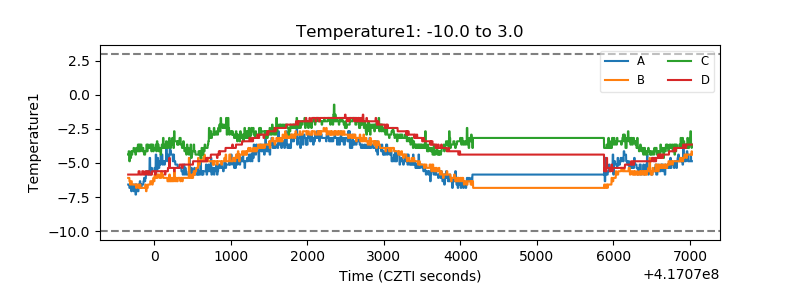 |
| Veto HV Monitor | 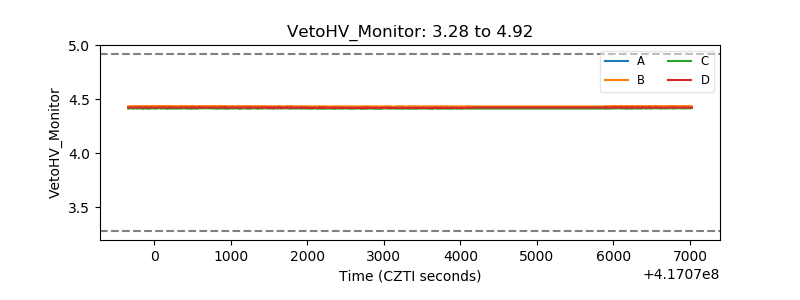 |
| Veto LLD | 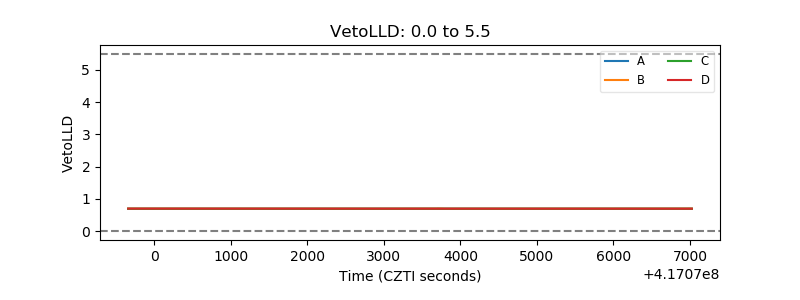 |
| Alpha Counter | 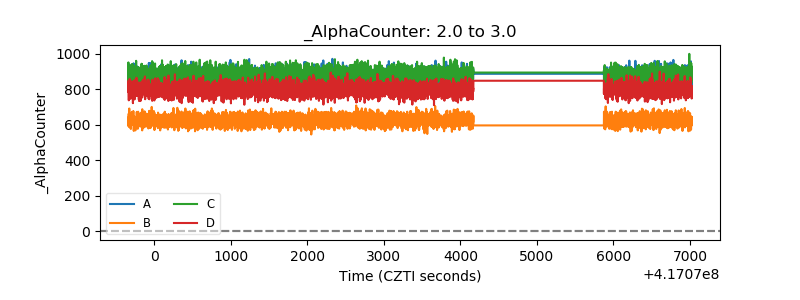 |
| _CPM_Rate | 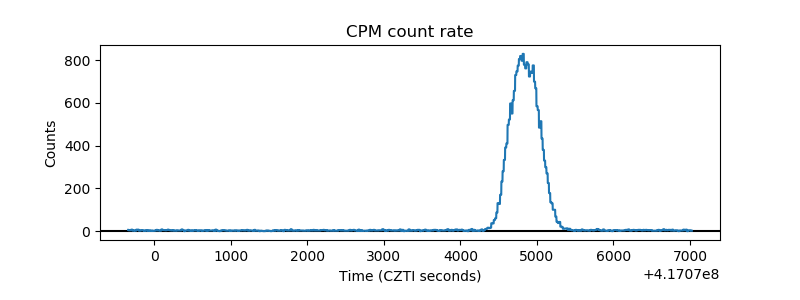 |
| CZT Counter | 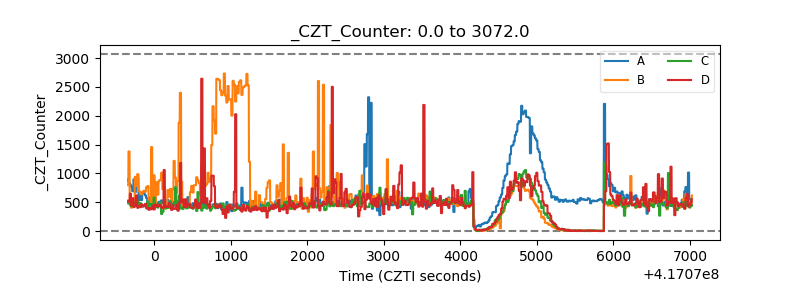 |
| +2.5 Volts monitor | 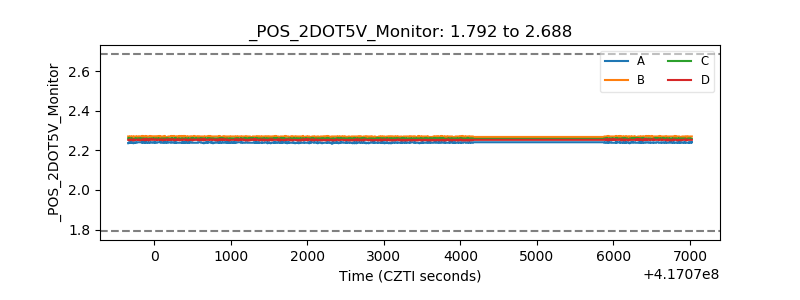 |
| +5 Volts monitor | 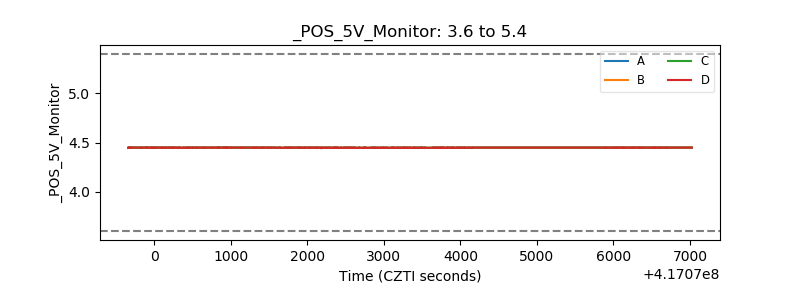 |
| _ROLL_ROT | 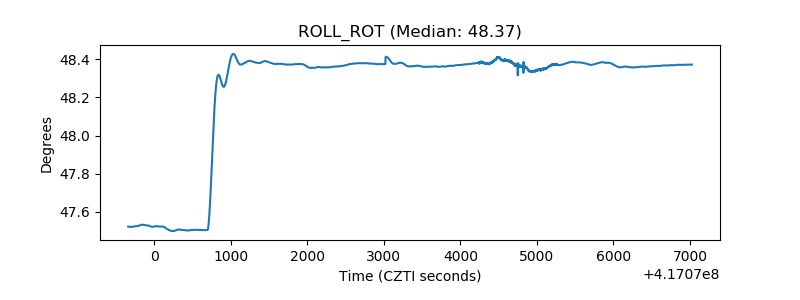 |
| _Roll_DEC | 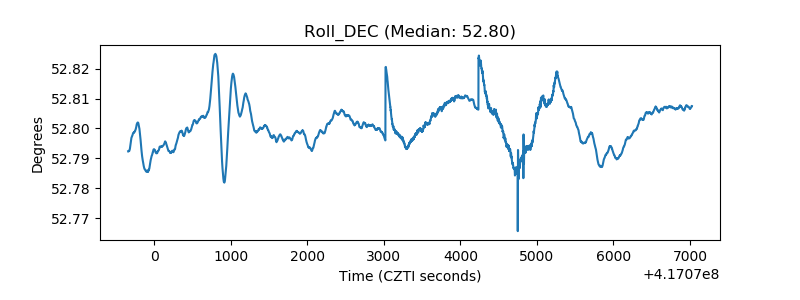 |
| _Roll_RA | 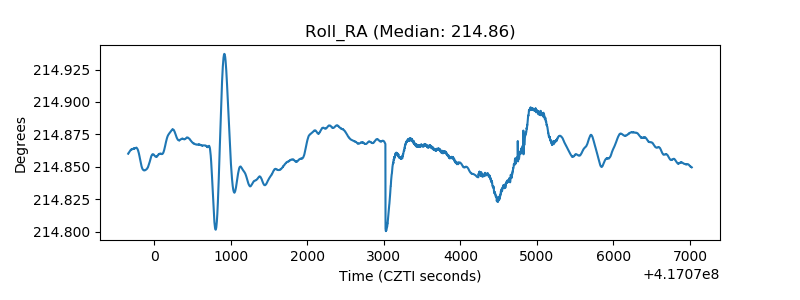 |
| Veto Counter | 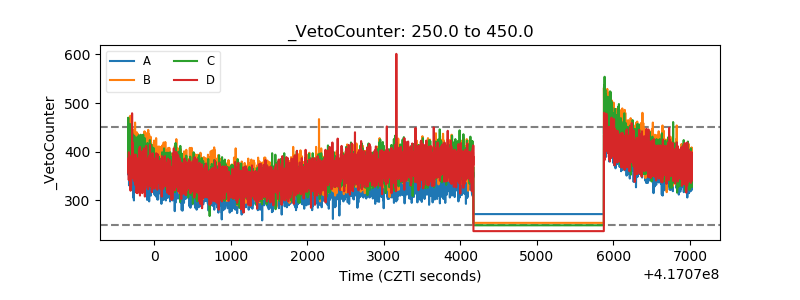 |