| Param | Original file | Final file |
|---|---|---|
| Filename | modeM0/AS1A12_022T01_9000005540_40429cztM0_level2.fits | modeM0/AS1A12_022T01_9000005540_40429cztM0_level2_quad_clean.evt |
| Size (bytes) | 359,449,920 | 91,198,080 |
| Size | 342.8 MB | 87.0 MB |
| Events in quadrant A | 2,960,587 | 633,232 |
| Events in quadrant B | 2,866,633 | 651,044 |
| Events in quadrant C | 2,567,802 | 612,061 |
| Events in quadrant D | 4,486,484 | 484,479 |
| Mode M0 | |||
|---|---|---|---|
| Quadrant | BADHDUFLAG | Total packets | Discarded packets |
| A | 0 | 12071 | 3 |
| B | 0 | 11783 | 2 |
| C | 0 | 10998 | 2 |
| D | 0 | 16866 | 2 |
| Mode M9 | |||
|---|---|---|---|
| Quadrant | BADHDUFLAG | Total packets | Discarded packets |
| A | 0 | 20 | 0 |
| B | 0 | 20 | 0 |
| C | 0 | 20 | 0 |
| D | 0 | 21 | 0 |
| Mode SS | |||
|---|---|---|---|
| Quadrant | BADHDUFLAG | Total packets | Discarded packets |
| A | 0 | 110 | 0 |
| B | 0 | 110 | 0 |
| C | 0 | 110 | 0 |
| D | 0 | 110 | 0 |
| Quadrant | Total seconds | Saturated seconds | Saturation percentage |
|---|---|---|---|
| A | 5441 | 14 | 0.257306% |
| B | 5441 | 18 | 0.330822% |
| C | 5441 | 5 | 0.091895% |
| D | 5441 | 902 | 16.577835% |
Noise dominated data is calculated using 1-second bins in cleaned event files. If a bin has >2000 counts, and if more than 50% of those come from <1% of pixels, then it is considered to be noise-dominated and hence unusable.
| Quadrant | # 1 sec bins | Bins with >0 counts | Bins with >2000 counts | High rate bins dominated by noise | Noise dominated (total time) | Noise dominated (detector-on time) | Marked lightcurve |
|---|---|---|---|---|---|---|---|
| A | 7294 | 5442 | 6 | 6 | 0.08% | 0.11% | 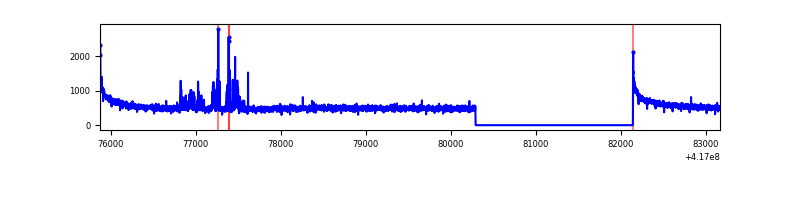 |
| B | 7294 | 5442 | 5 | 5 | 0.07% | 0.09% | 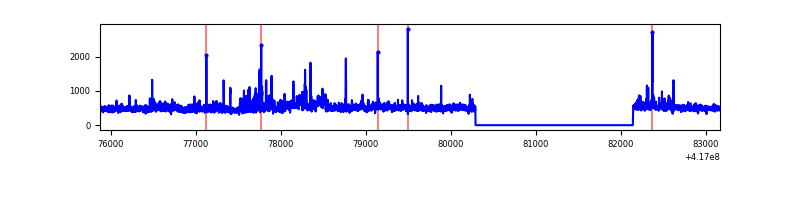 |
| C | 7294 | 5442 | 1 | 1 | 0.01% | 0.02% | 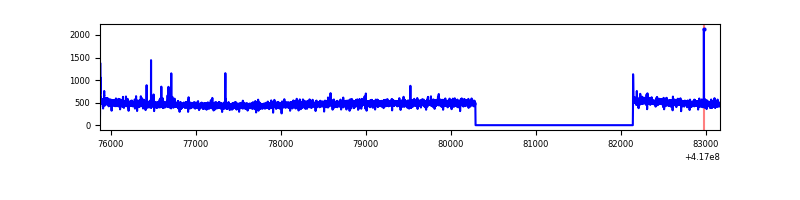 |
| D | 7294 | 5442 | 510 | 510 | 6.99% | 9.37% | 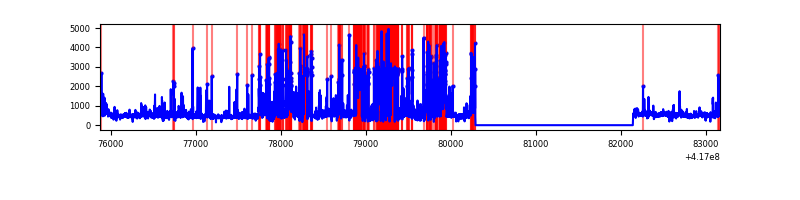 |
Top three noisy pixels from each quadrant. If the there are fewer than three noisy pixels in the level2.evt file, extra rows are filled as -1
| Pixel properties | Quadrant properties | ||||||
|---|---|---|---|---|---|---|---|
| Quadrant | DetID | PixID | Counts | Sigma | Mean | Median | Sigma |
| A | 10 | 83 | 474007 | 3792.47 | 614 | 602 | 124.8 |
| A | 13 | 248 | 114420 | 911.8 | 614 | 602 | 124.8 |
| A | 3 | 137 | 6599 | 48.04 | 614 | 602 | 124.8 |
| B | 3 | 112 | 197867 | 1689.52 | 605 | 589 | 116.8 |
| B | 0 | 230 | 178604 | 1524.55 | 605 | 589 | 116.8 |
| B | 4 | 170 | 82469 | 701.23 | 605 | 589 | 116.8 |
| C | 15 | 214 | 242367 | 1763.02 | 588 | 591 | 137.1 |
| C | 5 | 250 | 13294 | 92.63 | 588 | 591 | 137.1 |
| C | 14 | 254 | 8730 | 59.35 | 588 | 591 | 137.1 |
| D | 12 | 227 | 2036561 | 15507.23 | 536 | 523 | 131.3 |
| D | 12 | 191 | 141931 | 1077.02 | 536 | 523 | 131.3 |
| D | 12 | 128 | 96457 | 730.67 | 536 | 523 | 131.3 |
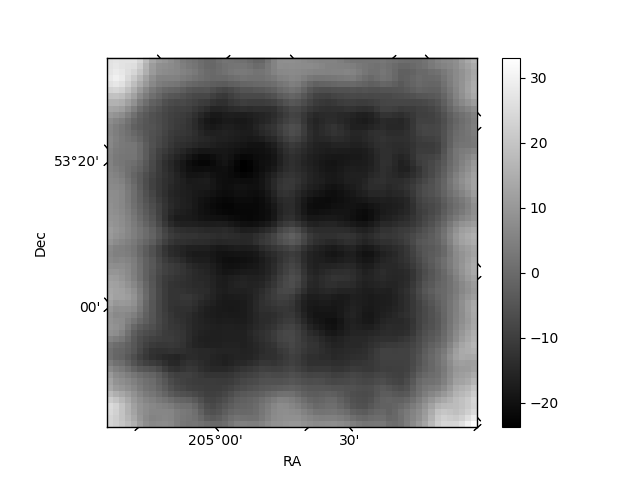
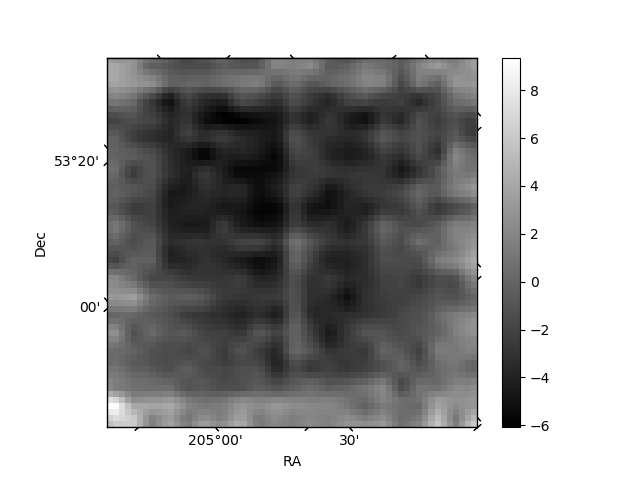
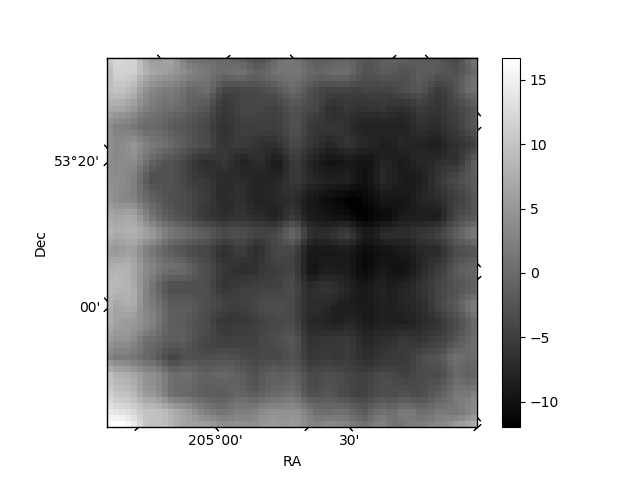
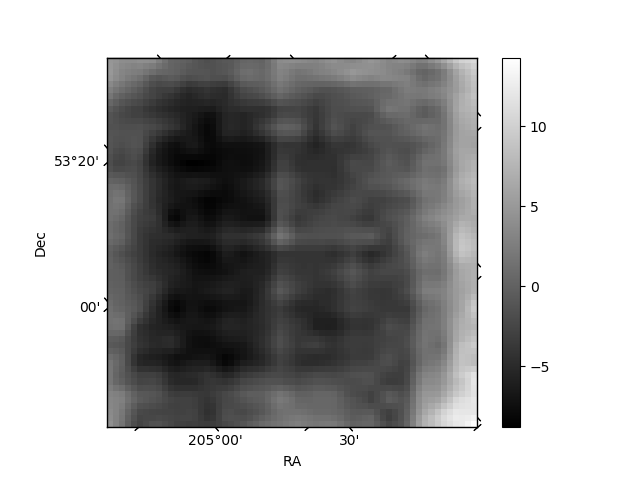
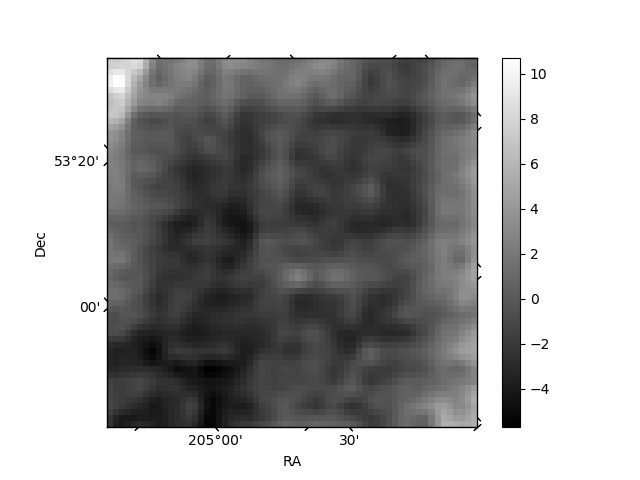
Histogram calculated using DETX and DETY for each event in the final _common_clean file
| Quadrant A | 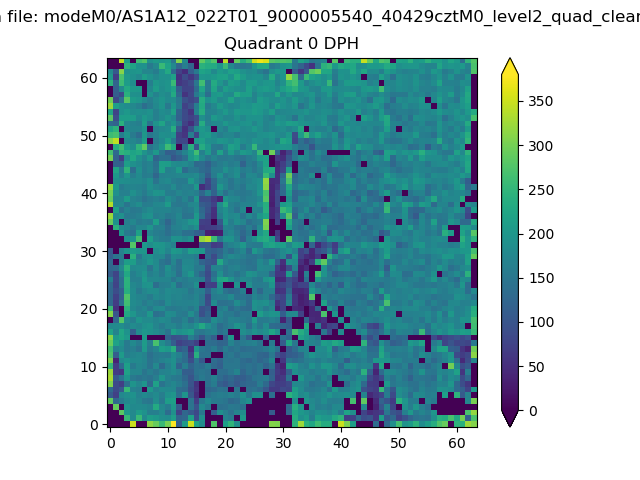 |
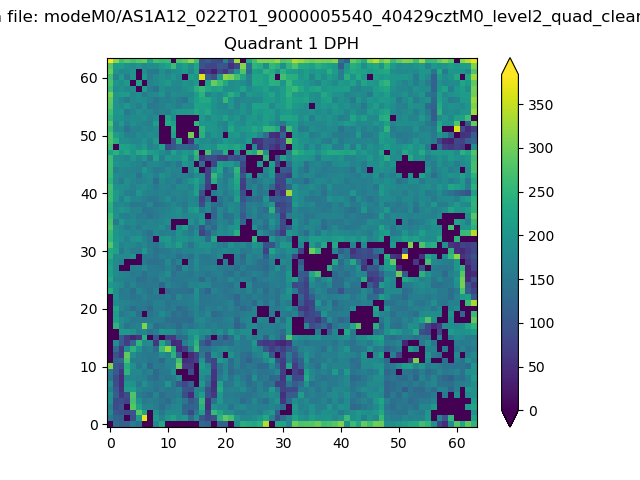 |
Quadrant B |
|---|---|---|---|
| Quadrant D | 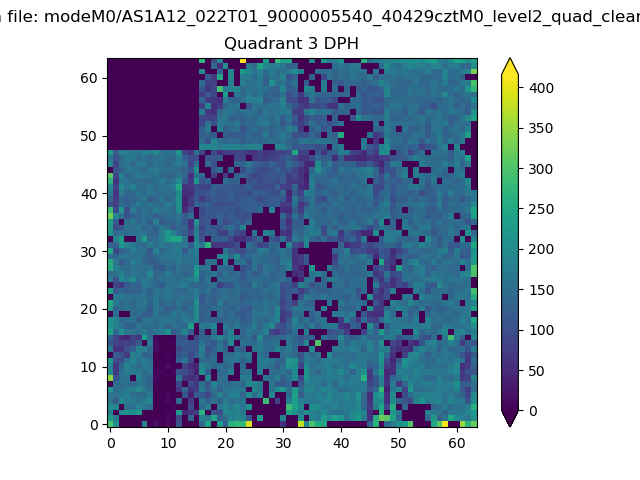 |
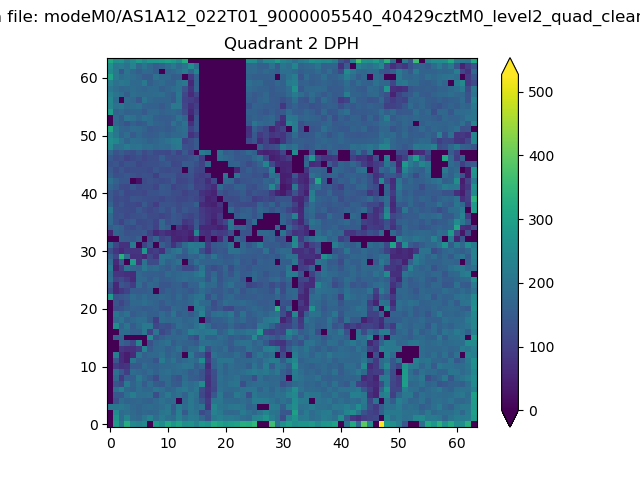 |
Quadrant C |
| Plot type | Count rate plots | Images |
|---|---|---|
| Comparison with Poisson distribution Blue bars denote a histogram of data divided into 1 sec bins. Red curve is a Poisson curve with rate = median count rate of data. |
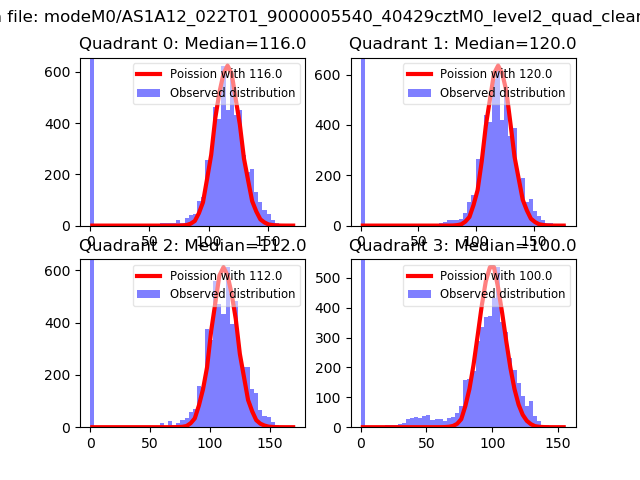 |
 |
| Quadrant-wise count rates Data is divided into 100 sec bins |
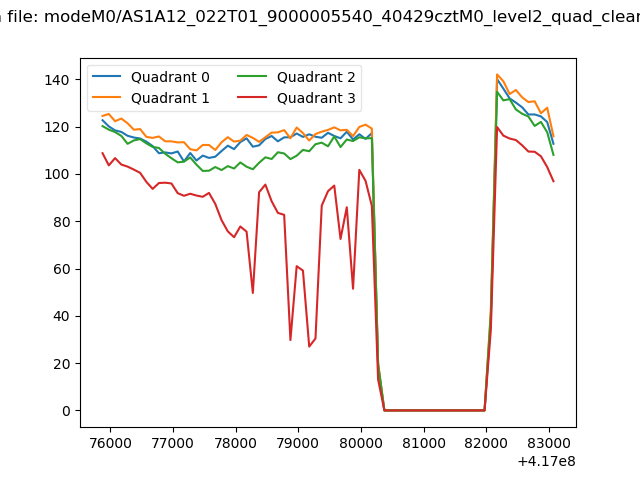 |
|
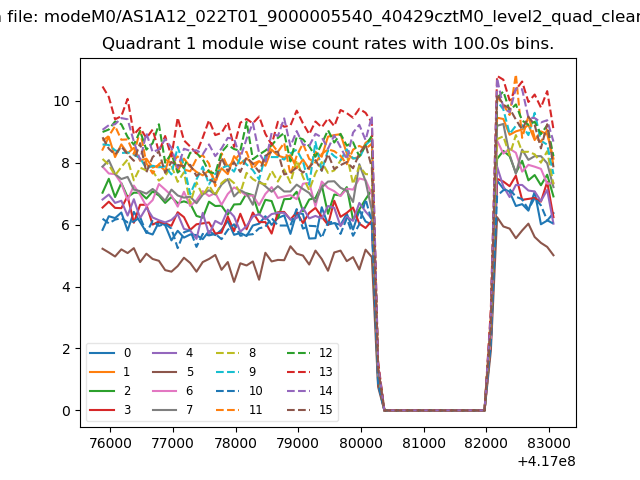
| Module-wise count rates for Quadrant A Data is divided into 100 sec bins |
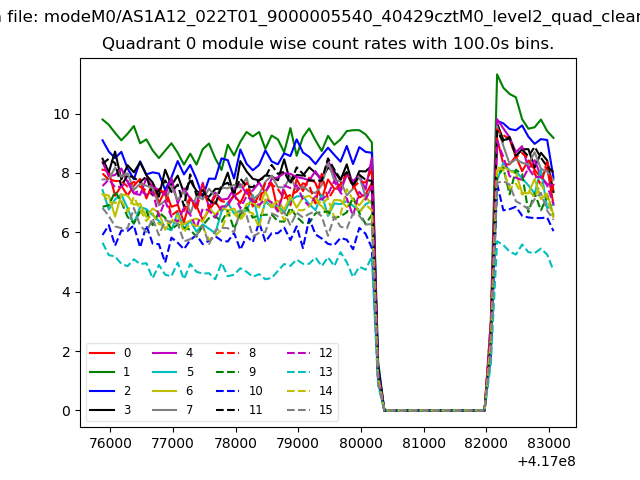 |
 |
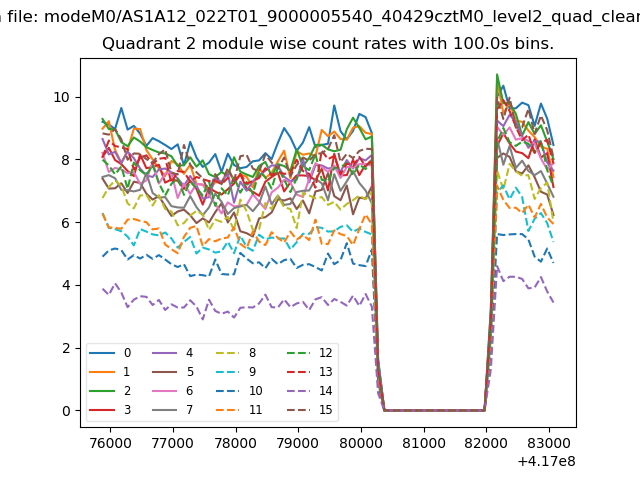
| Module-wise count rates for Quadrant B Data is divided into 100 sec bins |
 |
 |
| Module-wise count rates for Quadrant C Data is divided into 100 sec bins |
 |
 |
| Module-wise count rates for Quadrant D Data is divided into 100 sec bins |
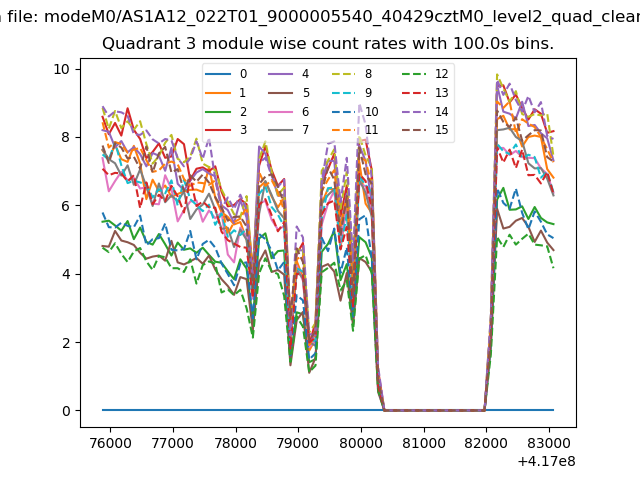 |
 |
| Parameter | Plot |
|---|---|
| CZT HV Monitor | 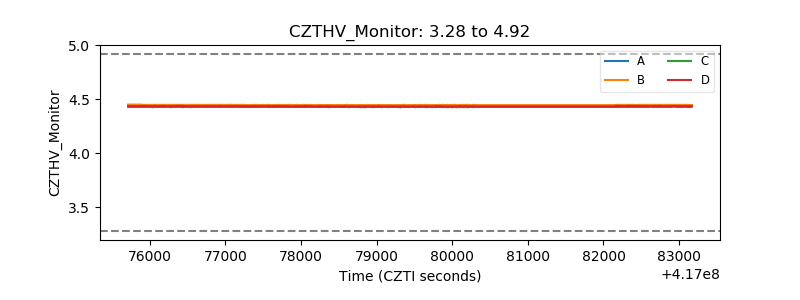 |
| D_VDD | 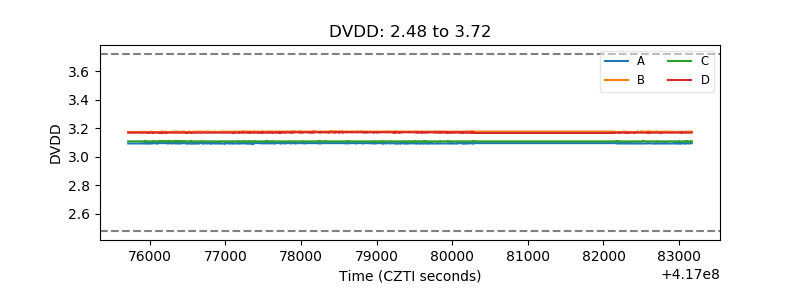 |
| Temperature 1 | 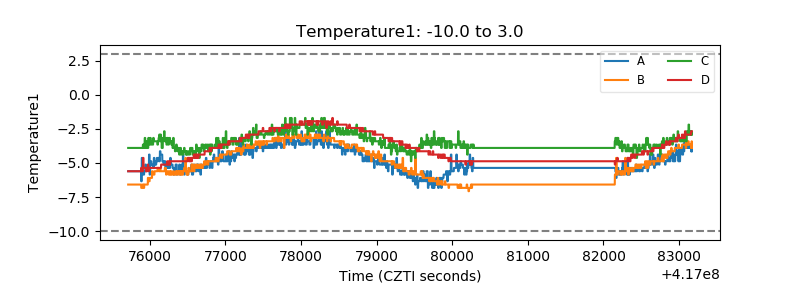 |
| Veto HV Monitor | 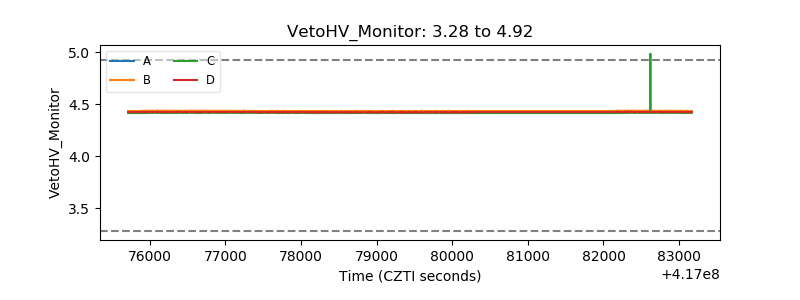 |
| Veto LLD | 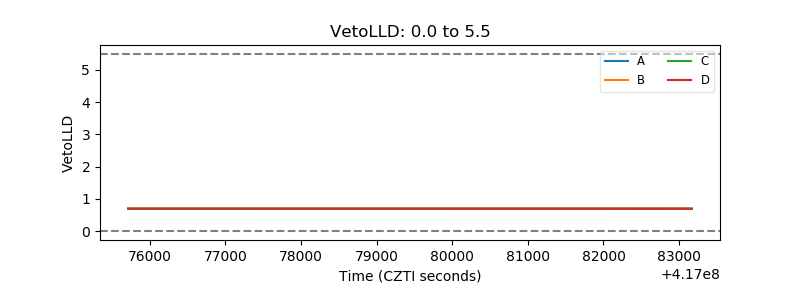 |
| Alpha Counter | 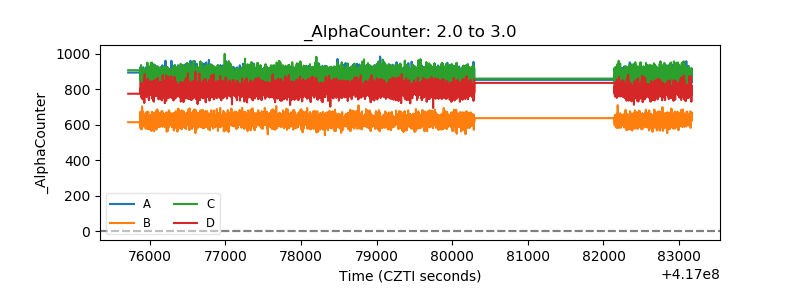 |
| _CPM_Rate | 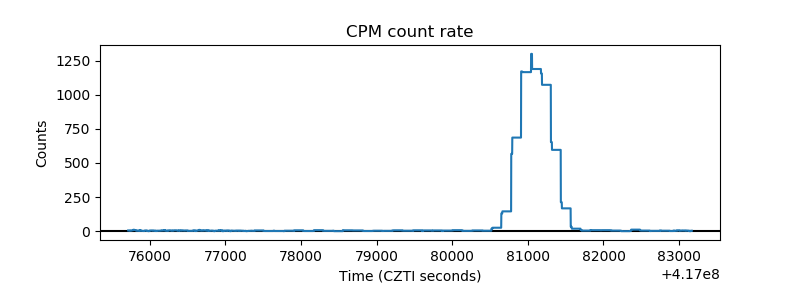 |
| CZT Counter | 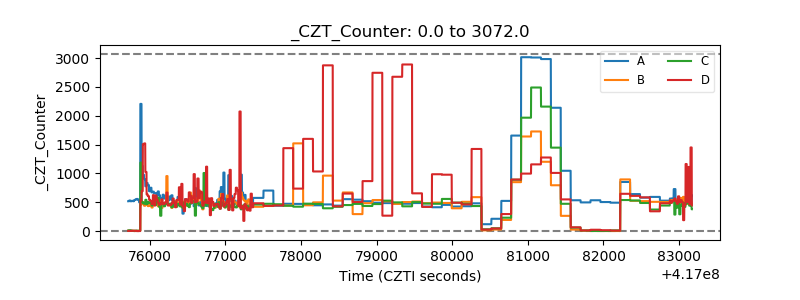 |
| +2.5 Volts monitor | 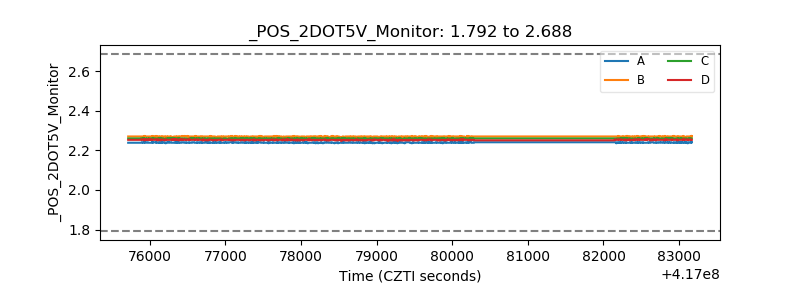 |
| +5 Volts monitor | 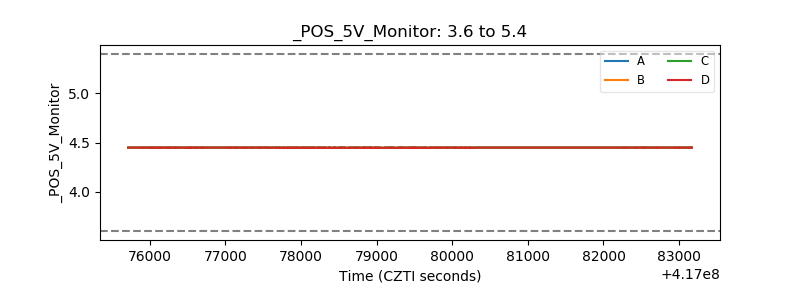 |
| _ROLL_ROT | 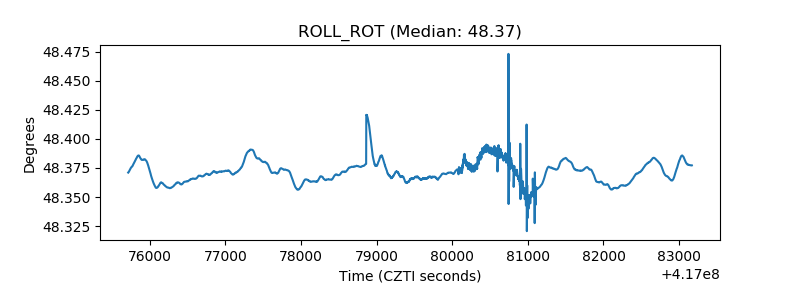 |
| _Roll_DEC | 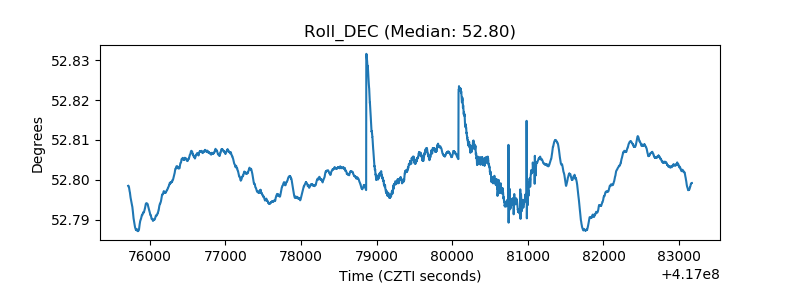 |
| _Roll_RA | 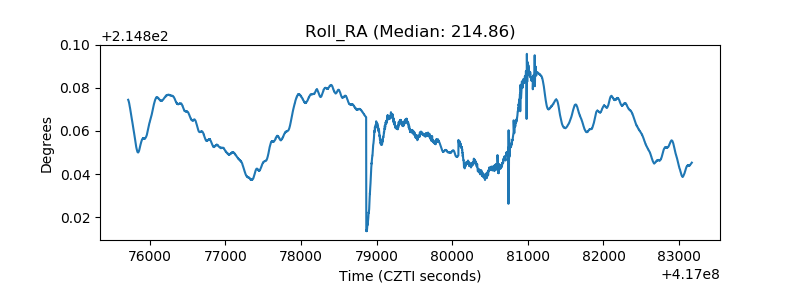 |
| Veto Counter | 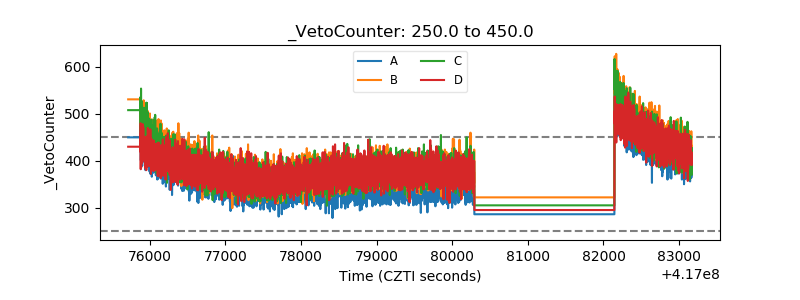 |